TLDR:
- In the last 3 months, on-chain activity has been on a consistent downward trend as observed from the lack of blockspace demand across DeFi and NFTs.
- Fund inflows were primarily attributed to stablecoin and blue-chip tokens.
- Fund outflows were mainly from token unlocks.
- Mint proceeds have trended down by almost 500%.
- Most of the smart money NFT traders are in risk-off mode, either profiting from free mints or holding notable blue-chip collections.
Current State of the Crypto Market
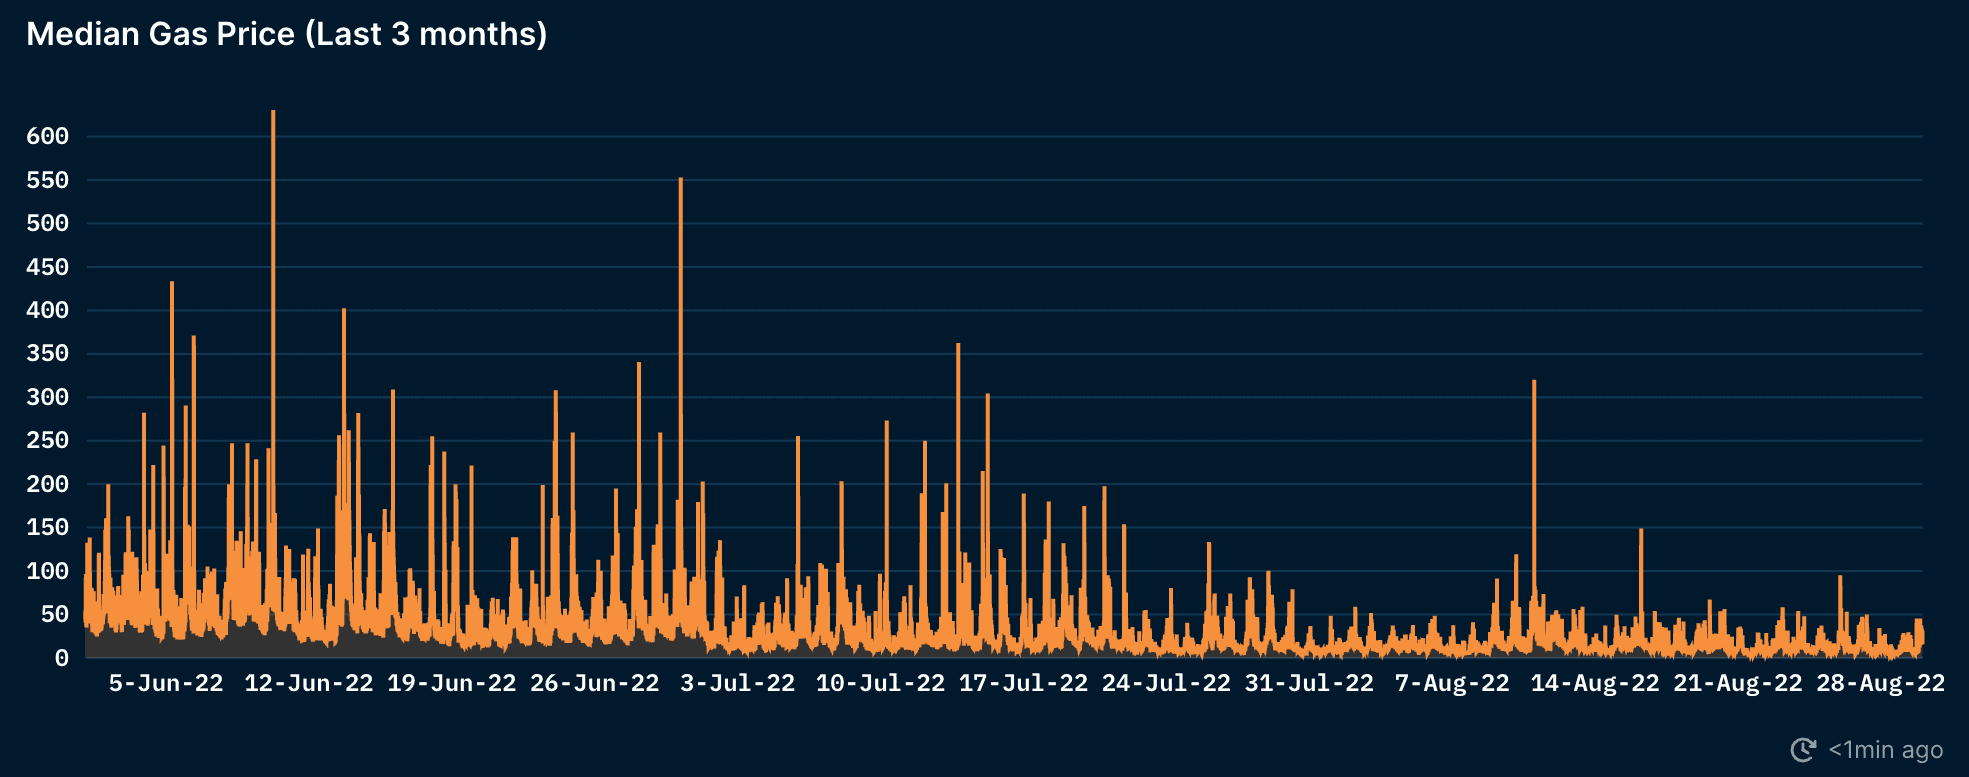
Median gas prices have been steadily decreasing over the last 3 months amidst a slowdown in the broader macro & crypto market.
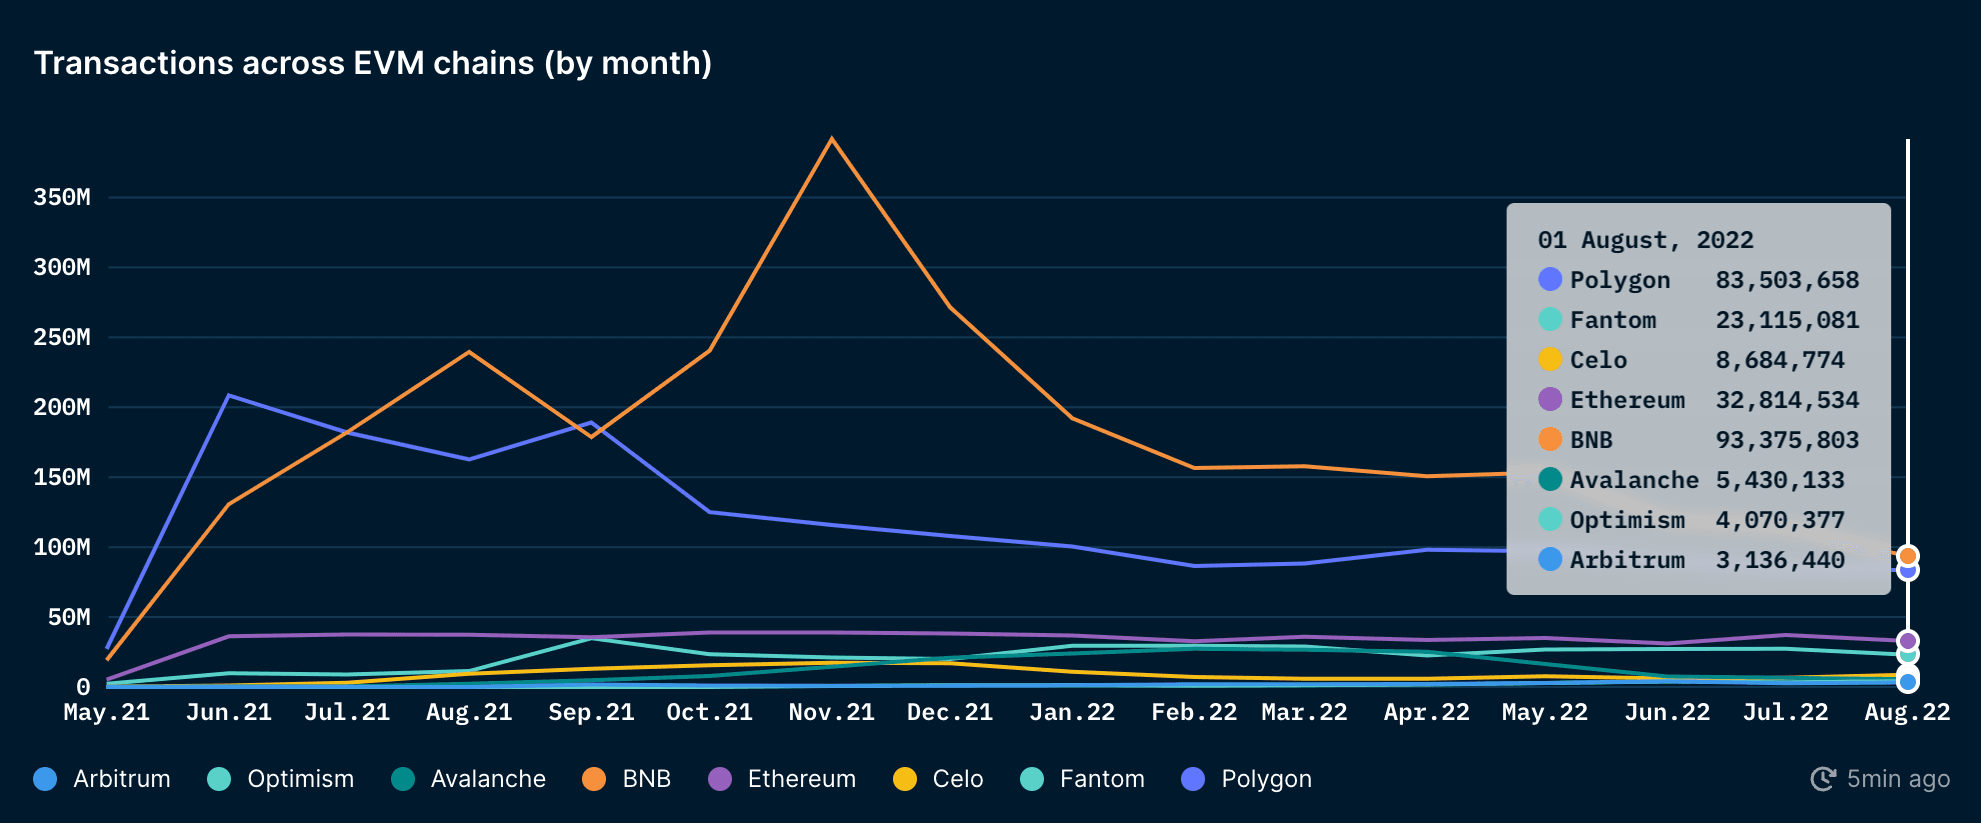
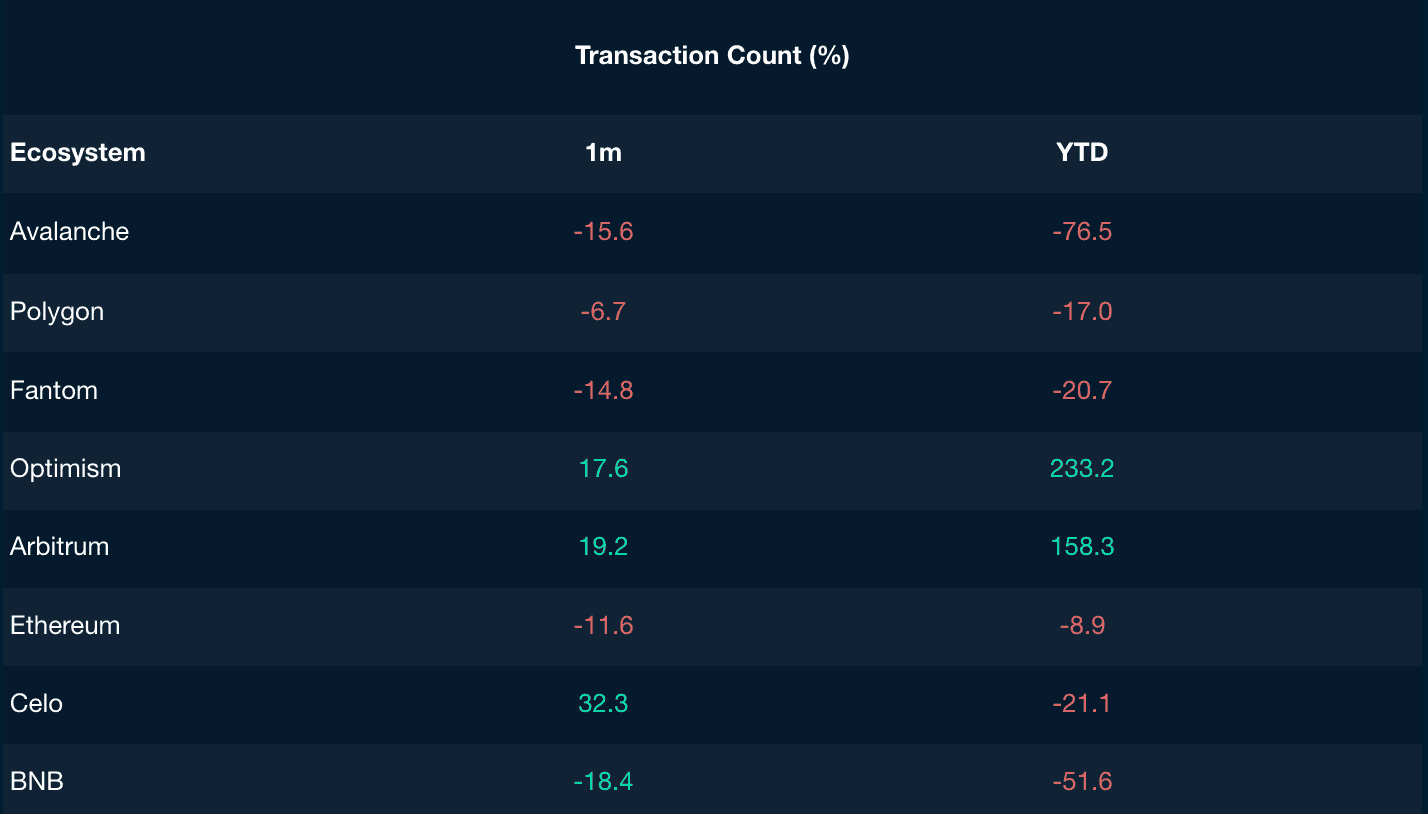
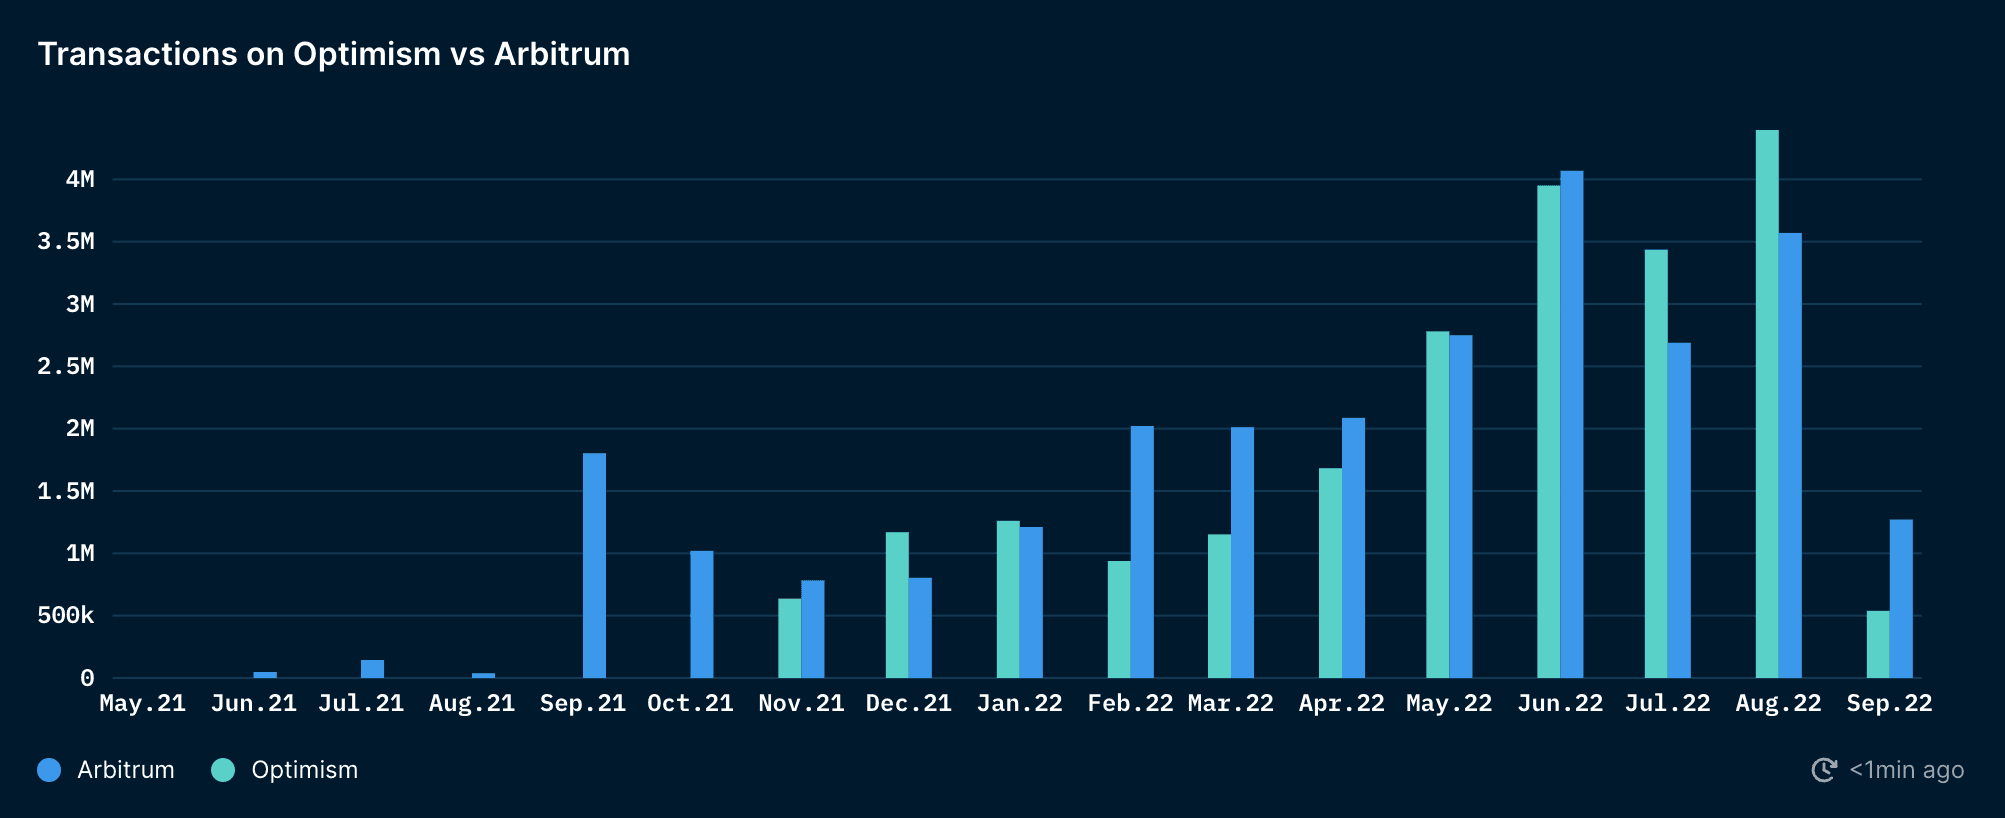
Majority of EVM chains have experienced a slowdown in network activity as defined by a declining transaction count YTD. Two notable exceptions that bucked the trend are Arbitrum and Optimism.
Zooming in to Arbitrum and Optimism, both of these notable L2s have experienced a ~4x increase in transaction count YTD. Arbitrum has also recently reclaimed its position as the dominant optimistic rollup L2 with $2.7b in TVL compared to Optimism at $1.5b. Optimism’s transaction count grew significantly from ecosystem incentives but fell off in the recent weeks. Arbitrum recently launched their Nitro technology stack, and has seen a surge in transaction count since.
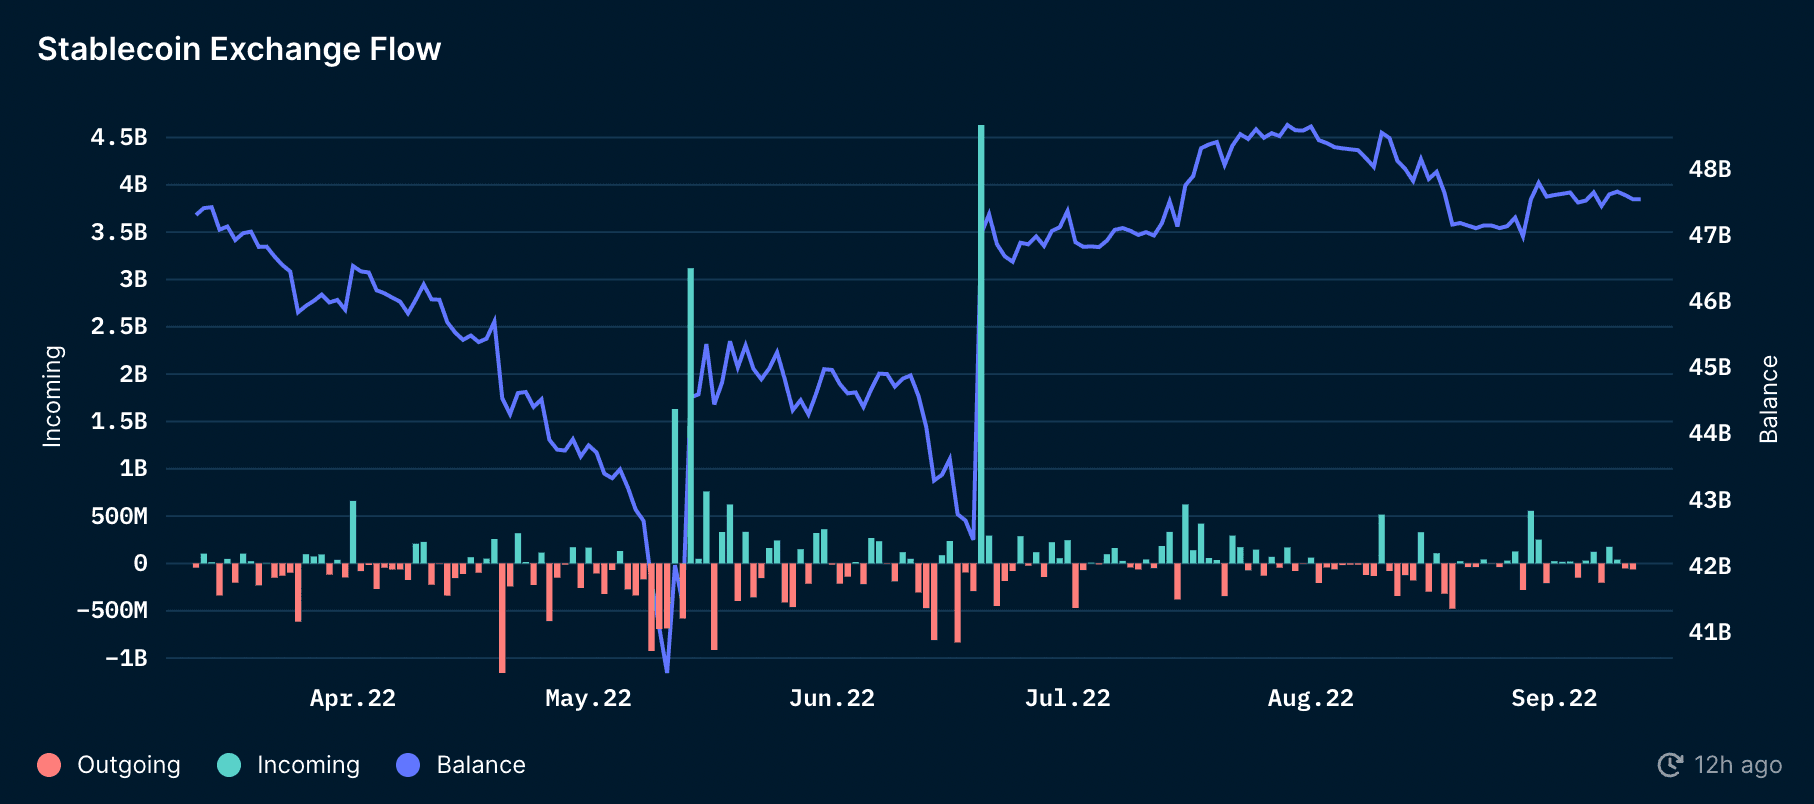
There were notable inflows of stablecoin into exchanges in the recent months. More notably, there were two major spikes on 12-14 May and 20 June. On 12-14 May, there was a $3.1b inflow of stablecoins into exchanges that coincided with the UST/Luna debacle where ETH dropped from ~$3k to $2k. There was another significant inflow of $4.6b on 20 June when ETH prices went below $1k.
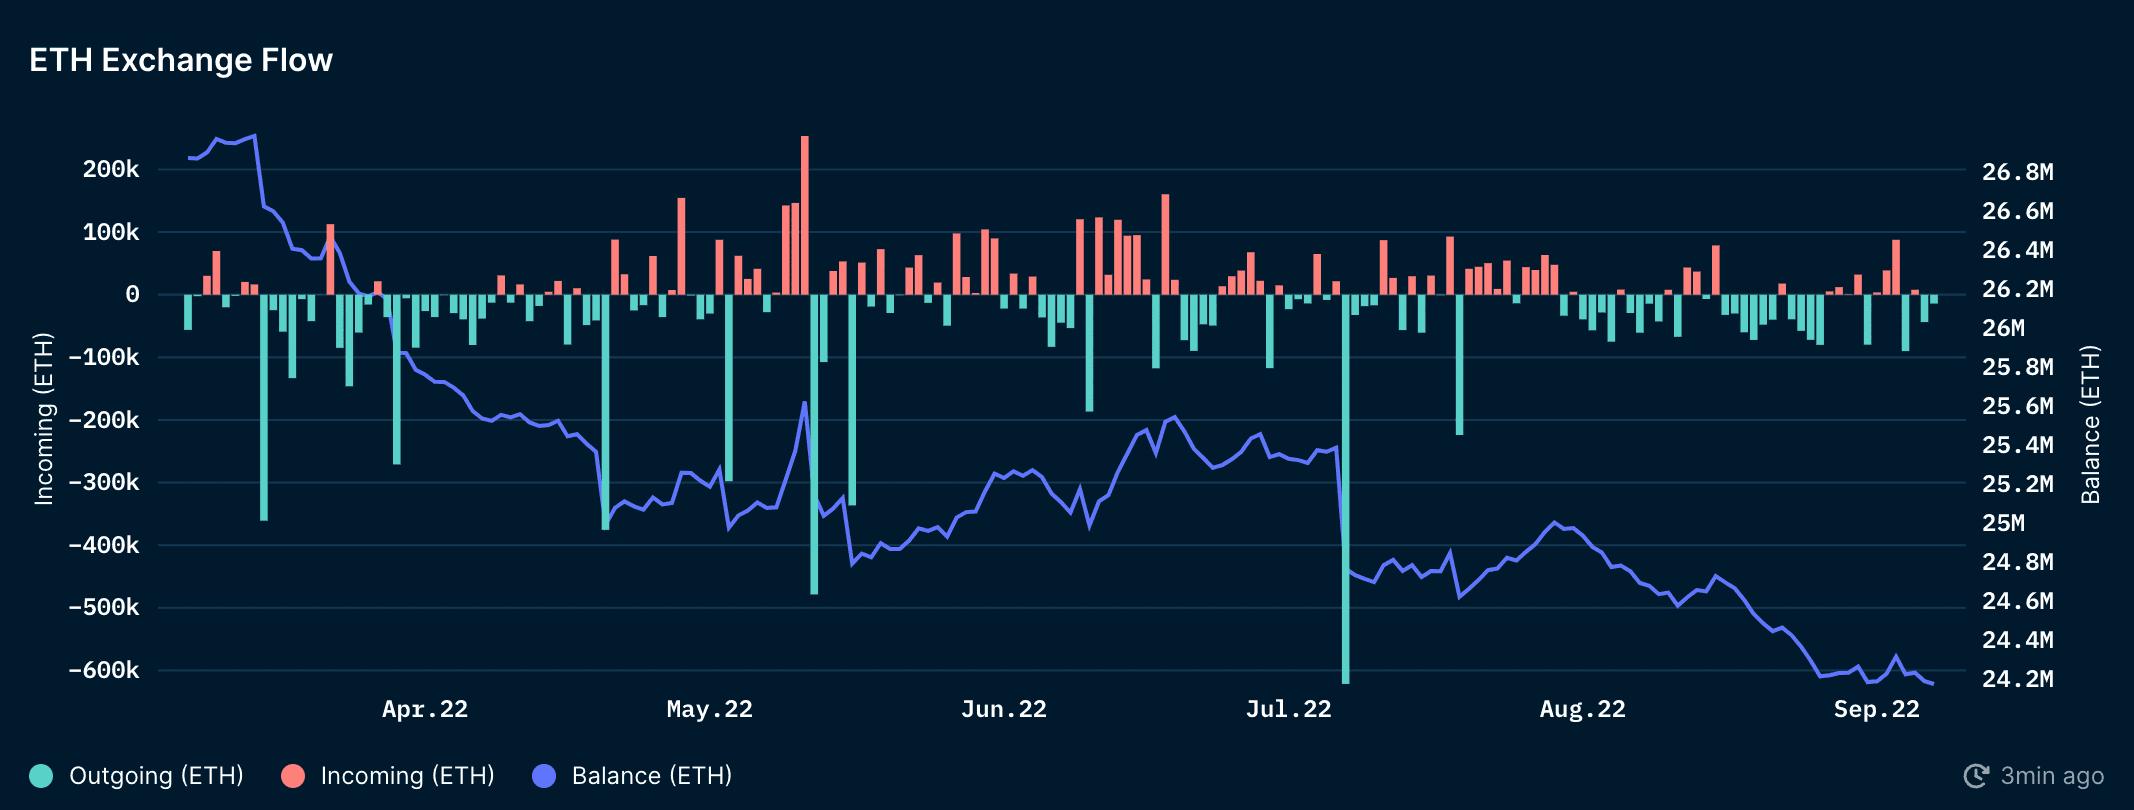
Based on the major spikes of stablecoin flowing into exchanges, there was a similar pattern in ETH exchange flow. The largest outflow occurred on 7 July 2022 with an outflow of 621k ETH. Large amounts of ETH have continued to leave exchange wallets recently, in light of the Merge event.
Zooming in on Smart Money Activity
Fund inflows
Methodology:
- Fund inflow can be a good indicator of what funds are accumulating and buying during this bearish period.
- Note that a large inflow can be attributed to token inflows from un-staking or vesting unlocks.
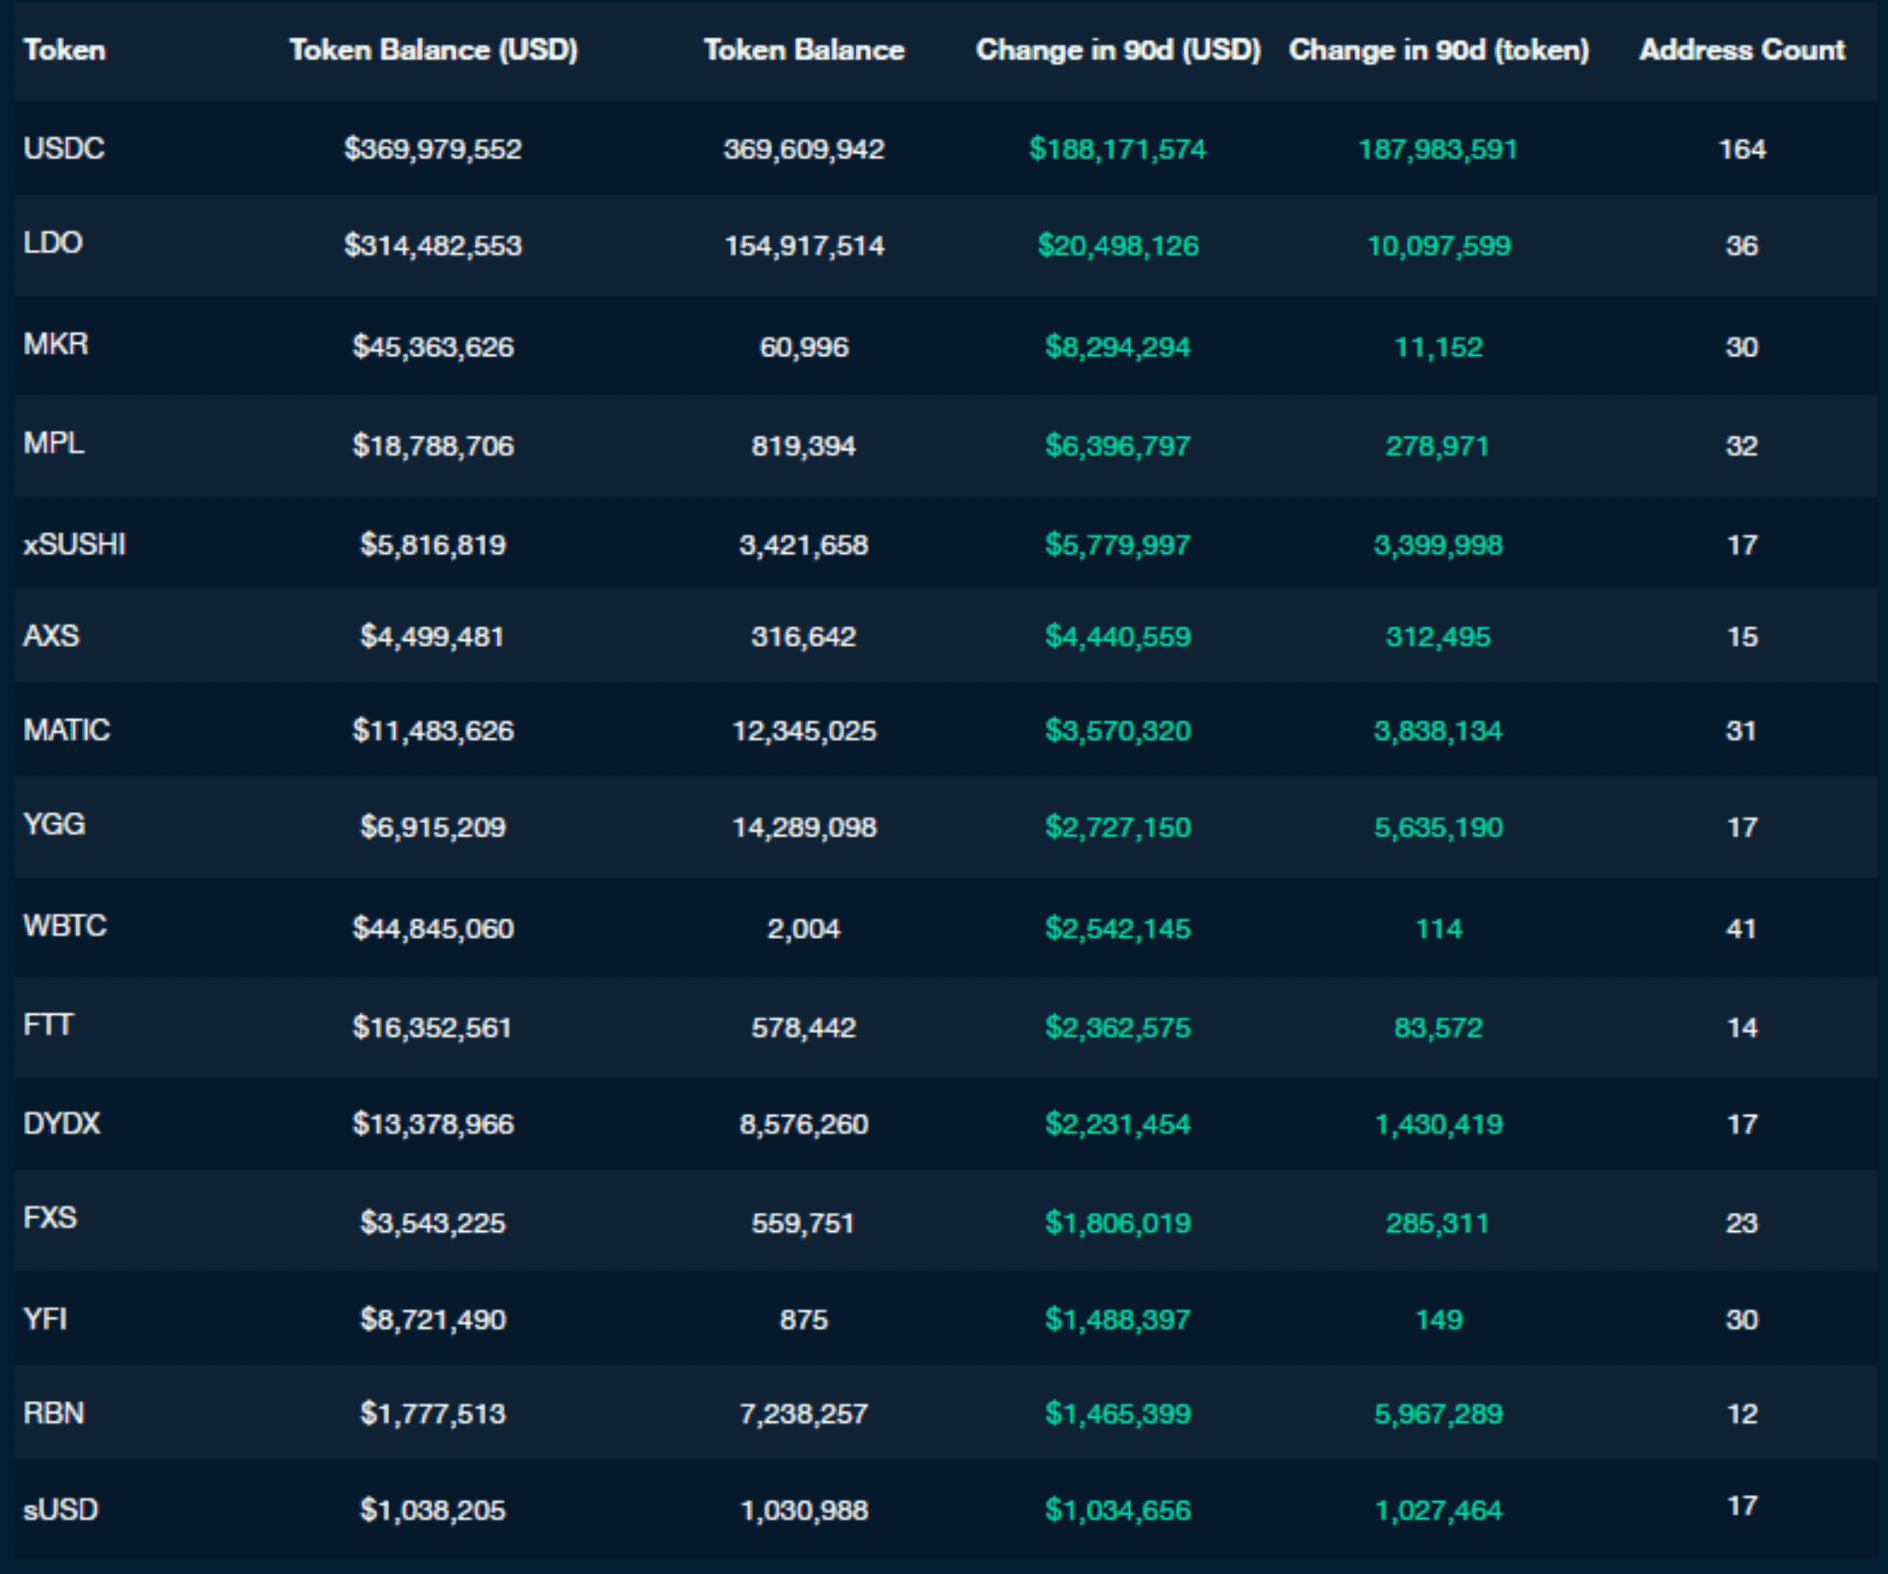
Source: Nansen Query (as of 12 Sep 2022)
Main observations
- In the last 90 days, the top 10 largest inflows into funds are USDC, LDO, MKR, MPL, xSUSHI, AXS, MATIC, YGG, WBTC, and FTT.
- The top 10 holdings as ranked by market value across funds are USDC, LDO, UNI, WETH, COMP, MKR, WBTC, DAI, USDT, and MPL.
- The top 10 tokens most commonly held tokens by fund wallets ranked by # of addresses are USDC, USDT, DAI, WETH, SUSHI, COMP. AAVE, WBTC, CRV, and UNI.
- USDC is the most popular stablecoin held by funds by a wide margin. At the time of writing, USDC has a balance of $370m among funds while DAI and USDT are at $26m and $22m respectively.
Performance of Tokens Benchmarked to ETH (in the last 3 months)
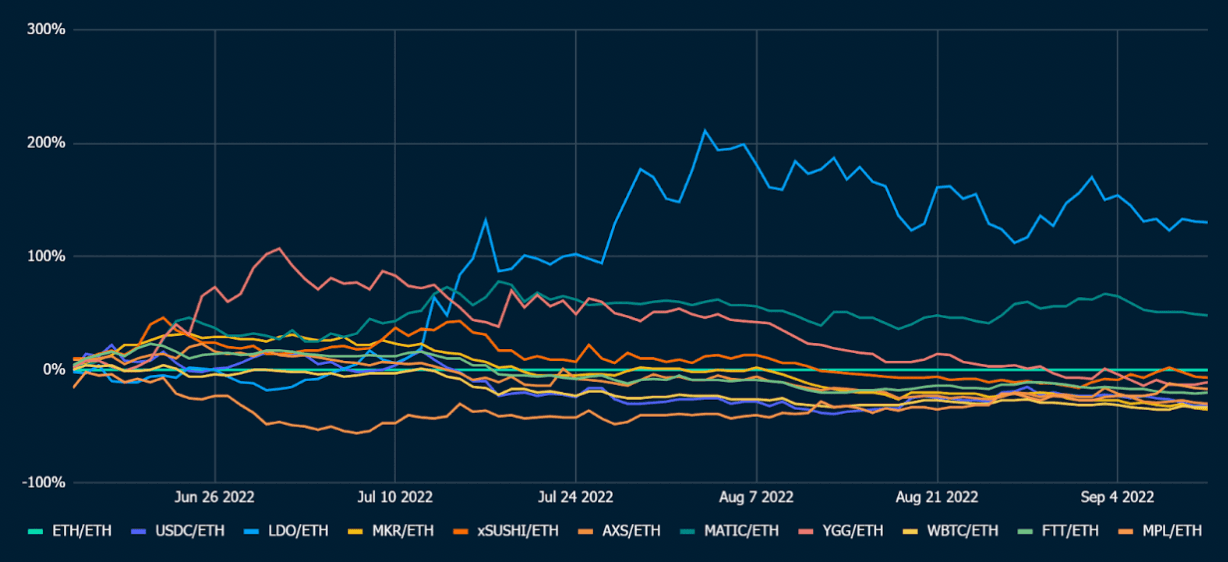
The above chart takes into account the top 10 token inflows into funds and benchmarks it against ETH’s performance in the last 90 days.
- Of the top 10 token inflows into funds, only 2 tokens have outperformed ETH in the last 90 days; LDO by 130% and MATIC by 48%.
- USDC, MKR, MPL, xSUSHI, AXS, YGG, WBTC, and FTT have all underperformed ETH in the last 90 days and are down -31%,-35%, -17%, -7%, -30%, -11%, -33% and -20% respectively.
Analysis on Fund Movements on Tokens
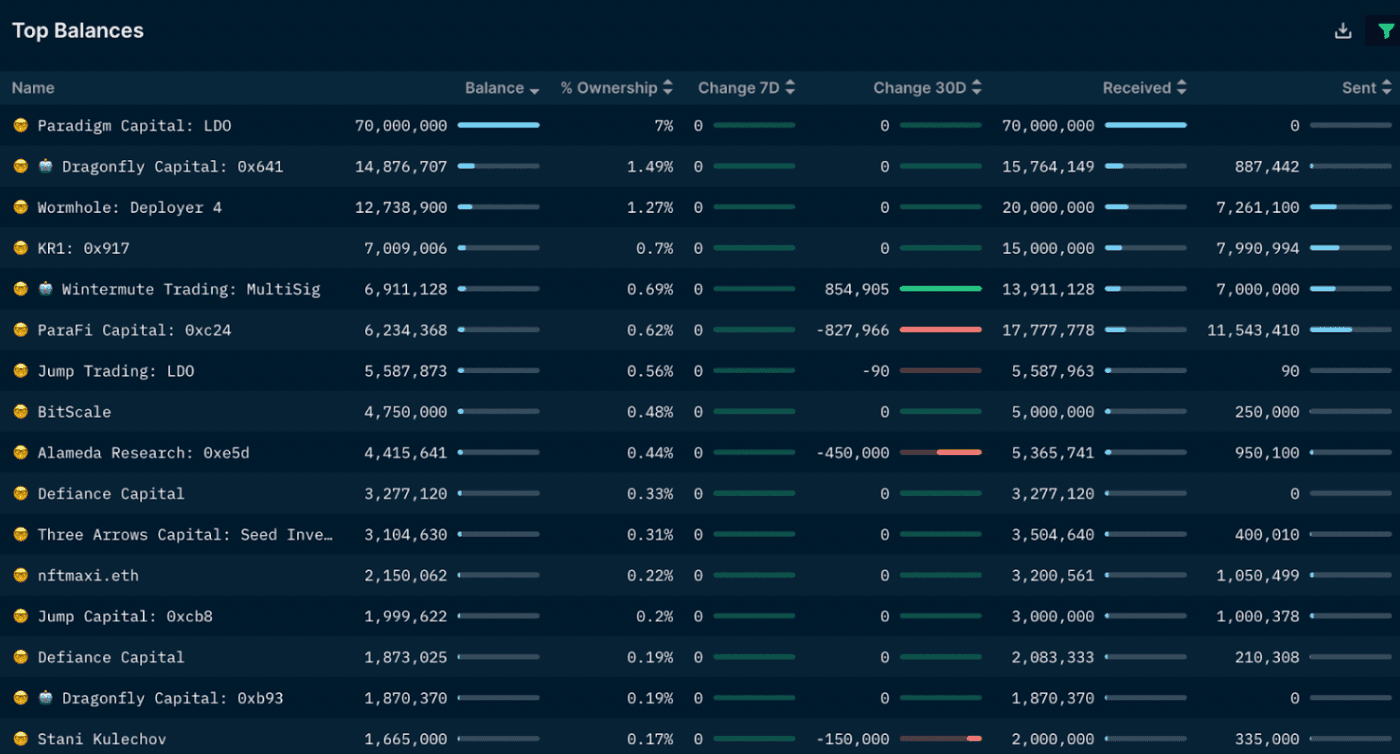
Lido Finance (LDO)- LDO is an interesting one to watch with the upcoming merge narrative. In the last 90 days, there was over $15m inflows of LDO into fund wallets. Currently, there is a balance of $295m USD worth of LDO tokens from all the tagged funds.
- Paradigm has the largest LDO balance with 70m (~$143m), followed by Dragonfly Capital (0x641) with 14.8m LDO (~$30.6m), Wintermute Trading:Multisig with 6.9m LDO (~14.4m), Parafi Capital with 6.2m LDO (~$12.7m) as of 2 Sep 2022. -Dragonfly Capital (0x641) received 14m LDO (~$28.7m) from a “Whale” wallet on 21 July 2022.
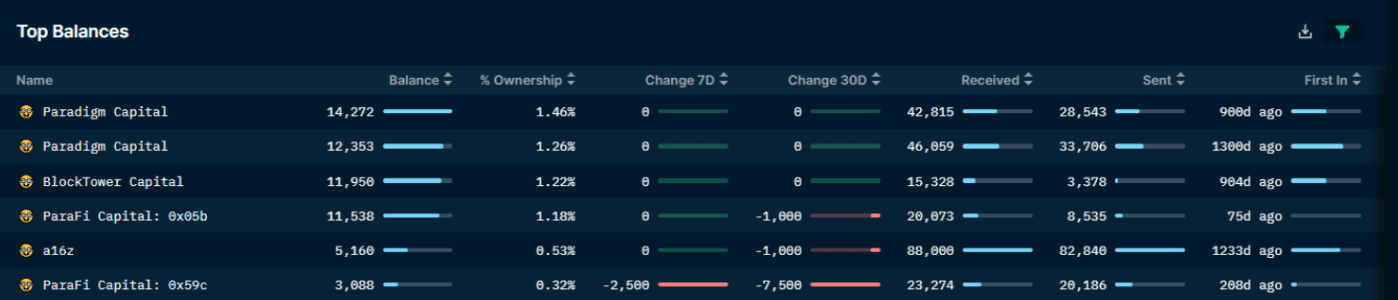
- Paradigm has the largest balance with 27k MKR tokens ($19m) followed by Parafi Capital(0x05b/0x59c) with 15k MKR ($10m) and BlockTower Capital with 12k MKR ($8.4m).
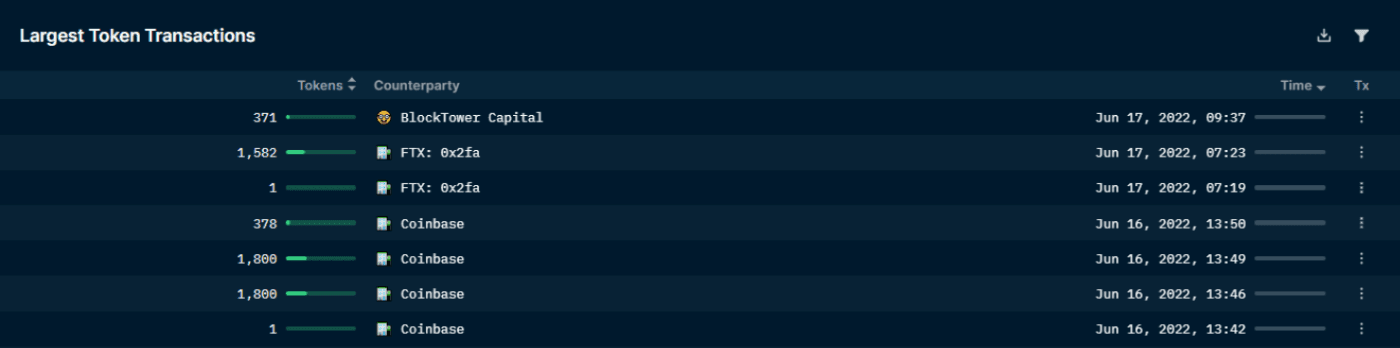
- Between 16-17 June 2022, BlockTower Capital received 5.6k MKR tokens from wallets labeled FTX and Coinbase. The token price at the time was $778 and the position is currently down -7% and trading at $712.
- There has been a significant inflow of MPL in the last 90 days. There was an inflow of $6m USD worth of MPL into fund wallets. The current balance across all fund wallets stand at $18.7m (excluding staked MPL).
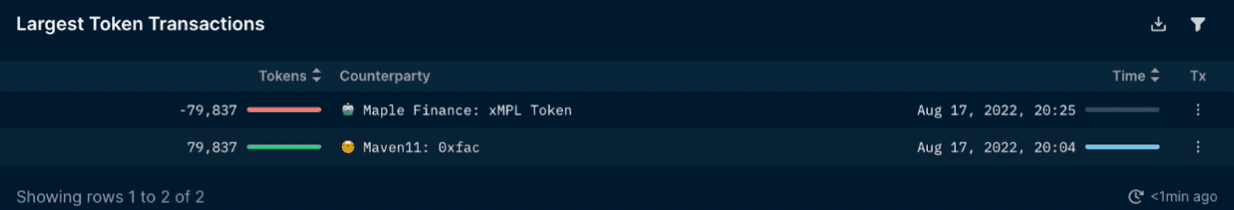
- Maven11 (0xfac) acquired 76,624 MPL tokens on 26 Jul 2022 and on 17 Aug 2022, sent 79,837 MPL tokens ($1.39m) to another address, which then staked it for xMPL token.
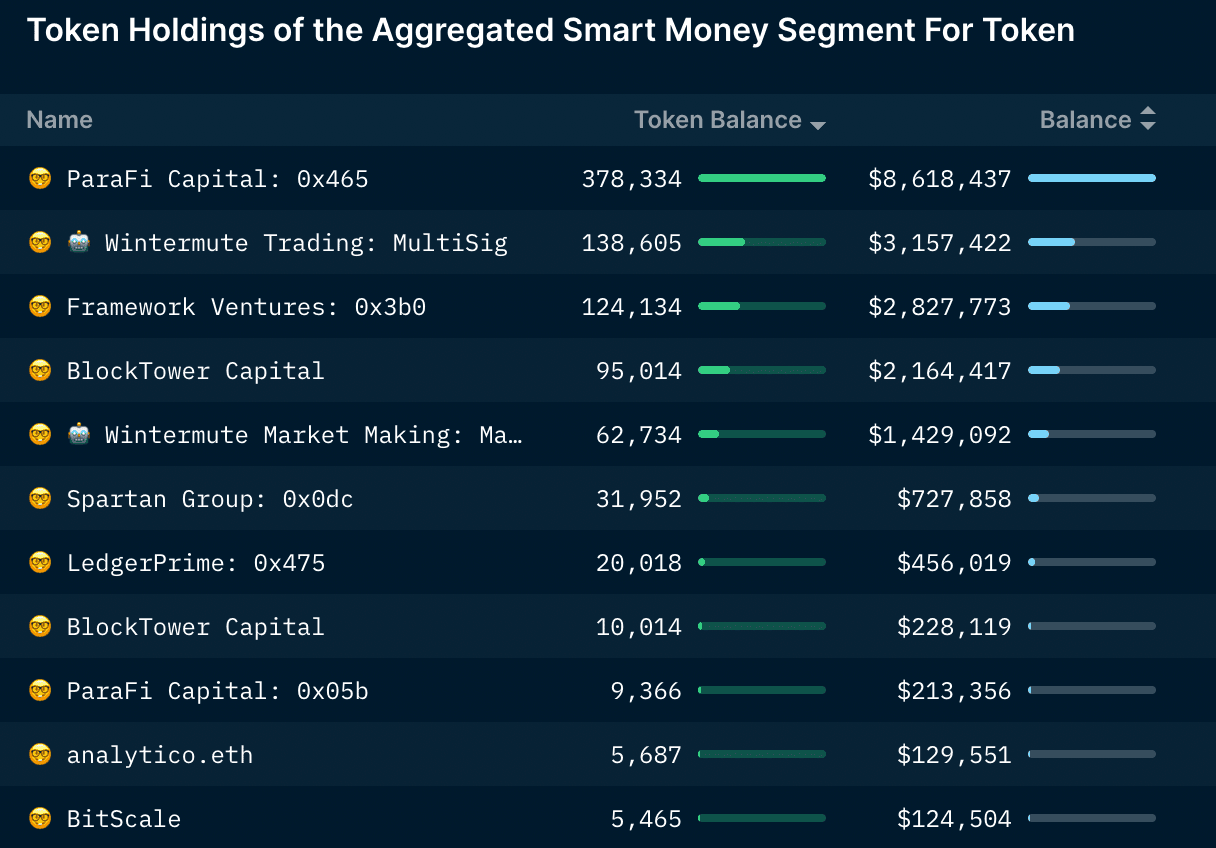
- ParaFi Capital (0xe7d) received 375k MPL on 8 June 2022 and sent it to another Parafi Capital (0x465) address, which was then staked for xMPL. ParaFi Capital currently has the largest MPL position for funds, with a token balance of 378k (~$8.6m).
- Wintermute Trading: Multisig has the second largest balance of MPL (~$3.1m) out of all the tagged funds as of 13 Sep 2022. Note that they have 5 other wallets that have never interacted with the MPL token, and some of their tagged wallets are still holding a sum of <$1m USD.
Fund outflows
Methodology:
- Fund outflow can be a good indicator of what funds are selling, transferring, or staking.
- Note that a large outflow can be attributed to token transfers to a separate wallet or staking on a different contract, and not necessarily selling.
Main observations
- Large token outflows can be attributed to recent token unlocks and investors deciding to reduce their position/holdings due to many reasons.
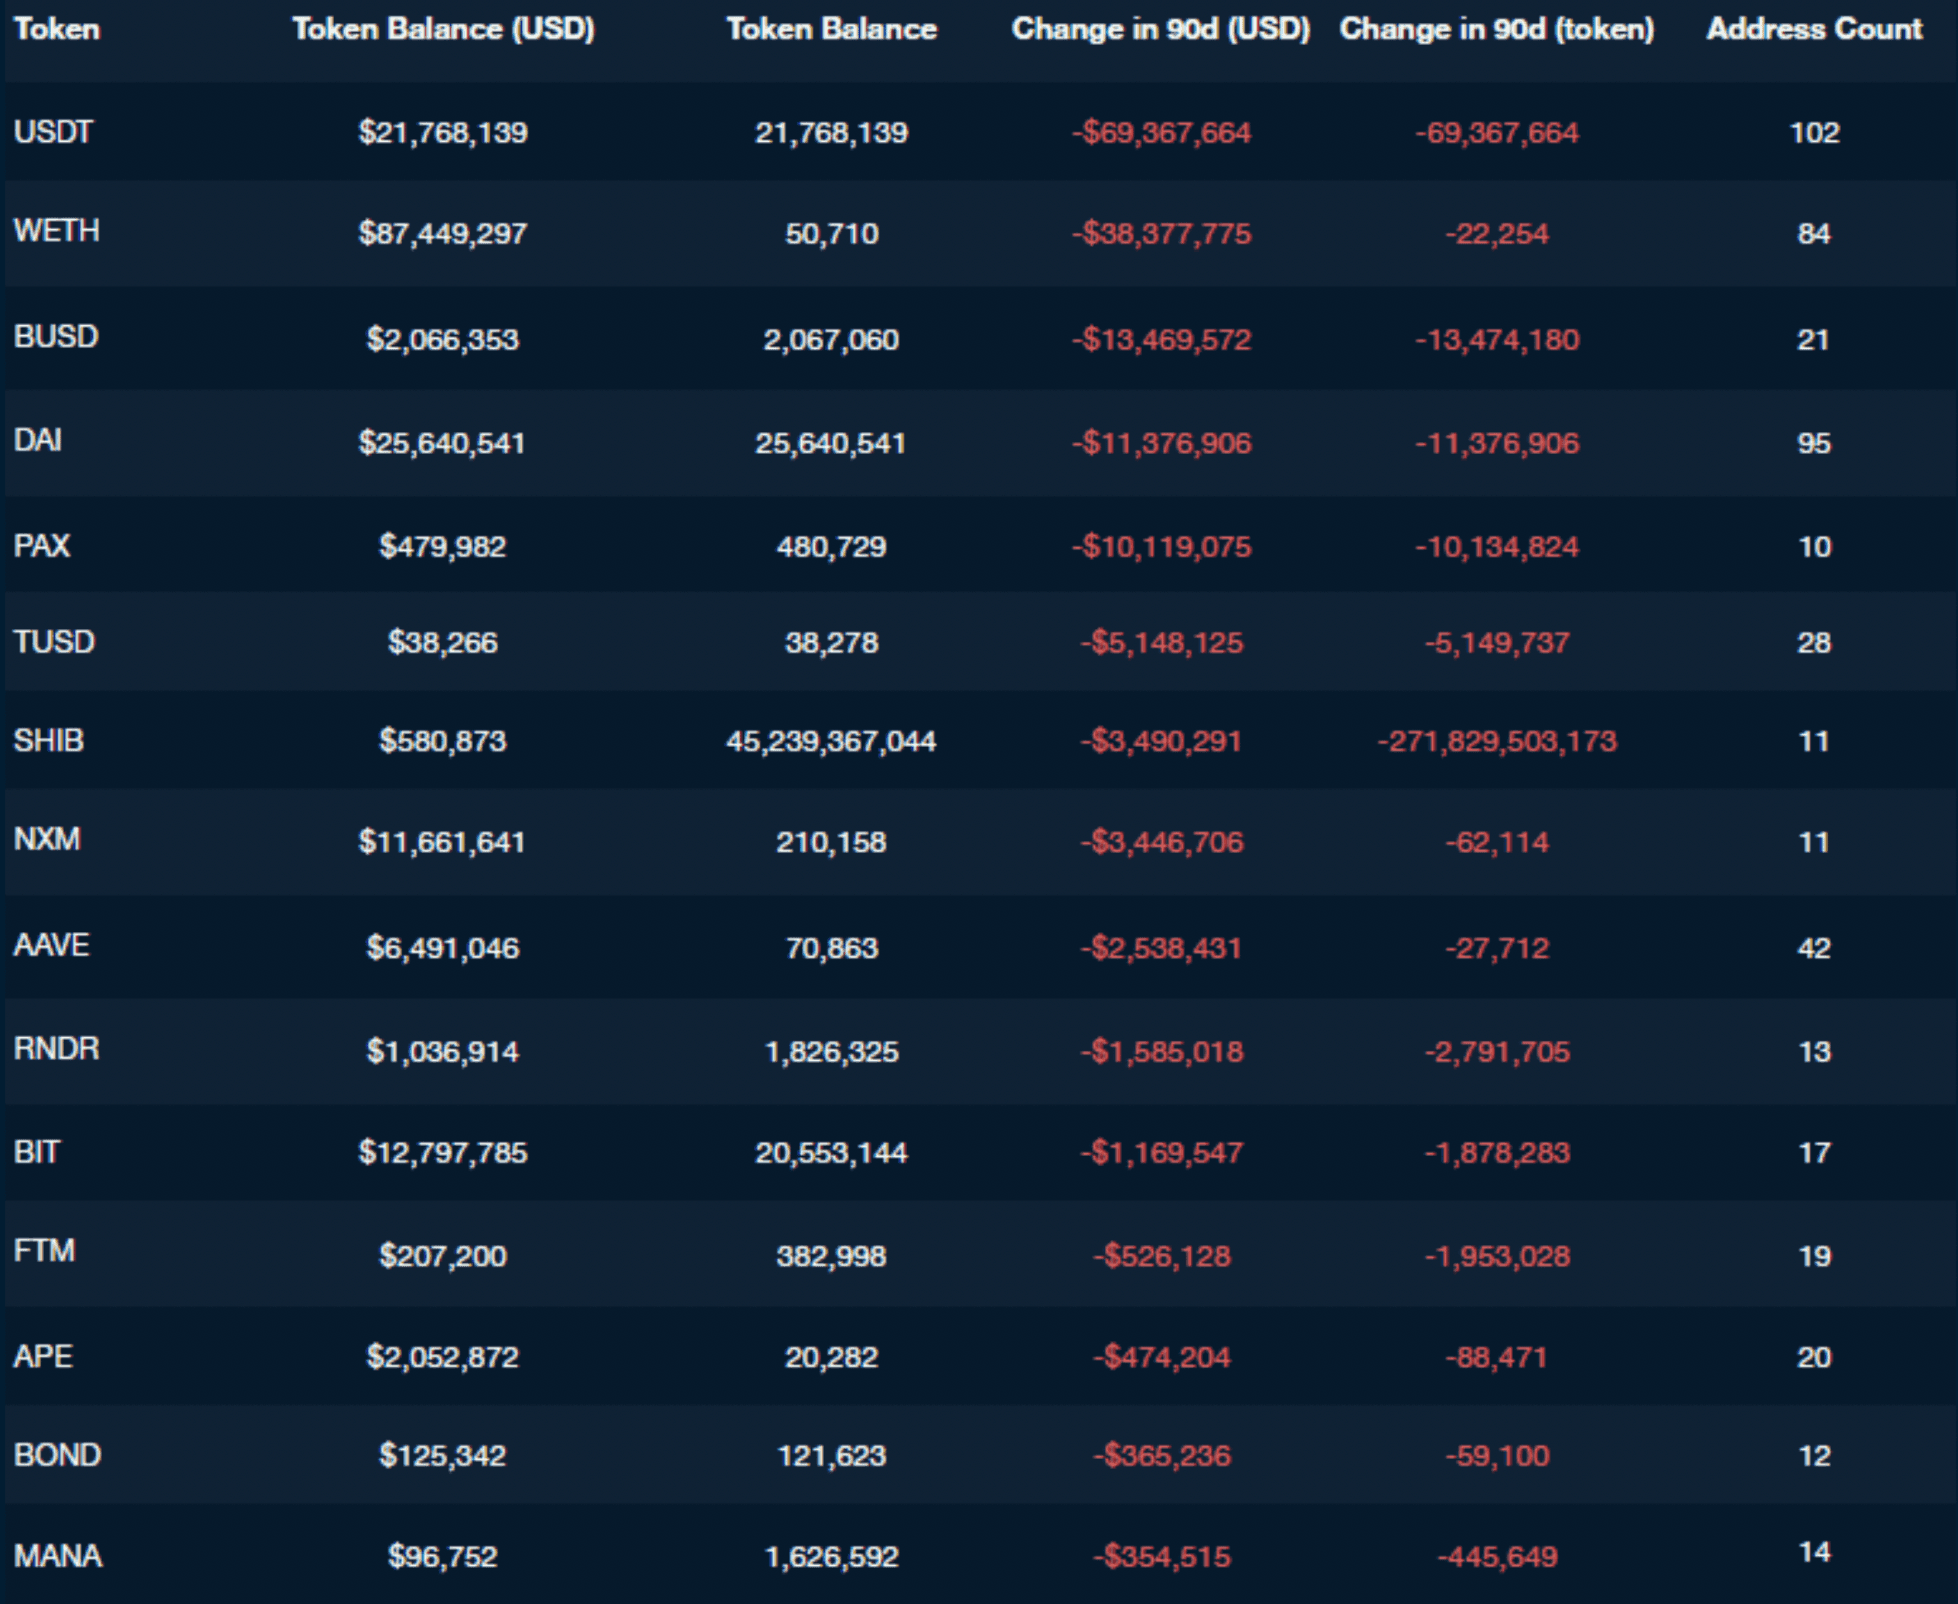
- In the last 90 days, the top 10 largest outflows from funds are USDT, WETH, BUSD, DAI, PAX, TUSD, SHIB, NXM, AAVE, and RNDR.
Performance of Tokens Benchmarked to ETH (in the last 3 months)
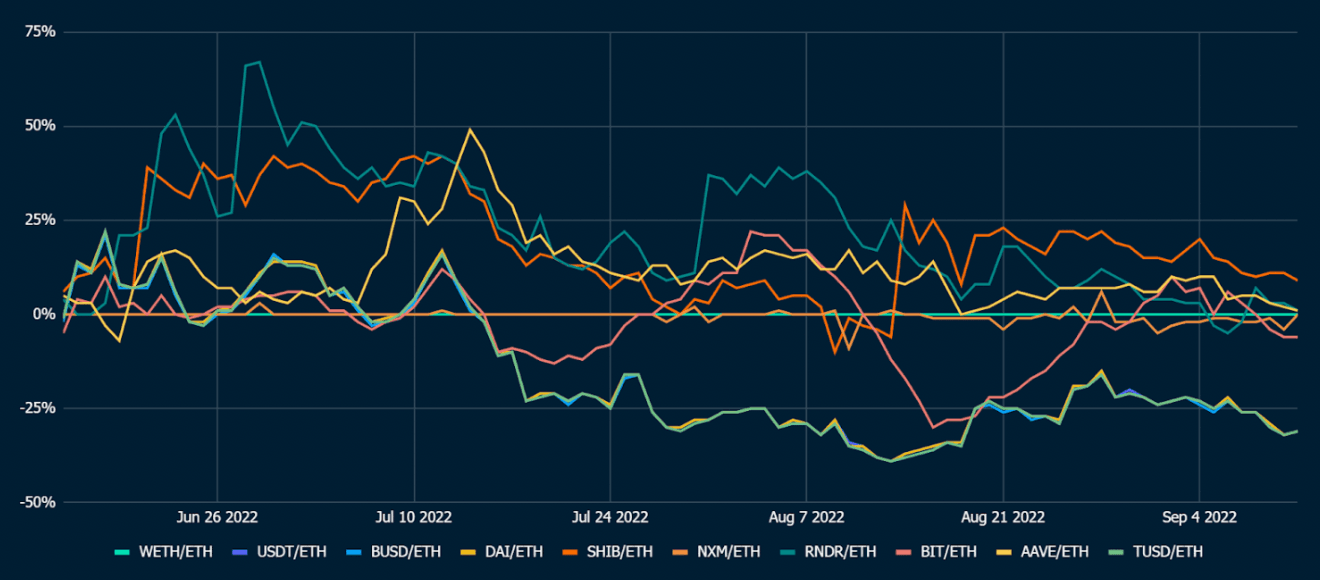
The above chart takes into account the top 10 token outflows from funds and benchmarks it against ETH’s performance in the last 90 days.
- Of the top token outflows from funds, SHIB, AAVE, and RNDR has outperformed ETH slightly by 9%, 1% and 1% respectively in the last 90 days.
- NXM has traded flat against ETH (0%).
- BIT underperformed ETH in the last 90 days and is down -6%.
- All the stablecoins (USDT, BUSD, DAI, TUSD) have underperformed by 31% vs ETH.
Analysis on Fund Movements on Tokens
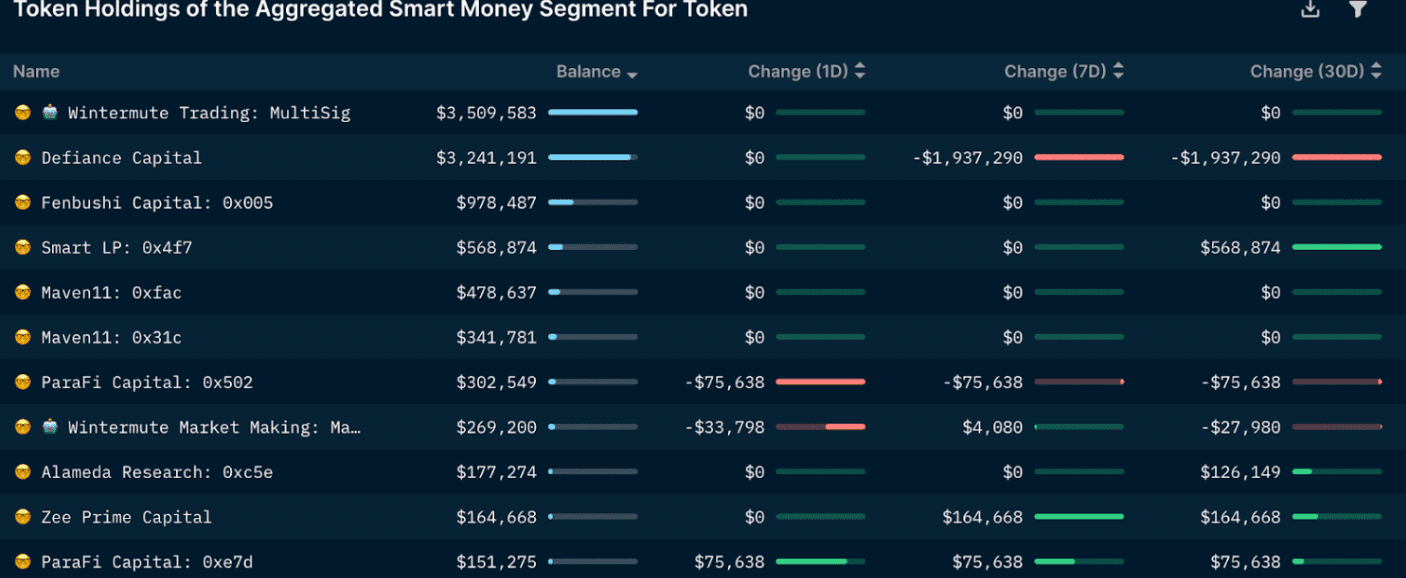
AAVE- There has been a large outflow of AAVE in the last 90 days. A total of $8.7m worth of AAVE was sent out from smart money fund wallets in the last 90 days. Despite the large outflow, smart money investors are still accumulating/ holding AAVE with a balance of $9.5m AAVE aggregated in fund smart money wallets as of 6 Sep 2022.
- The top token holders for AAVE are Wintermute Trading (~$3.5m), Defiance Capital ($3.2m), and Fenbushi Capital (~$978k).
- DeFiance Capital had an outflow of $1.9m worth of AAVE token in the last 30 days. On 30 August, they swapped 24k AAVE to ETH ($2m).
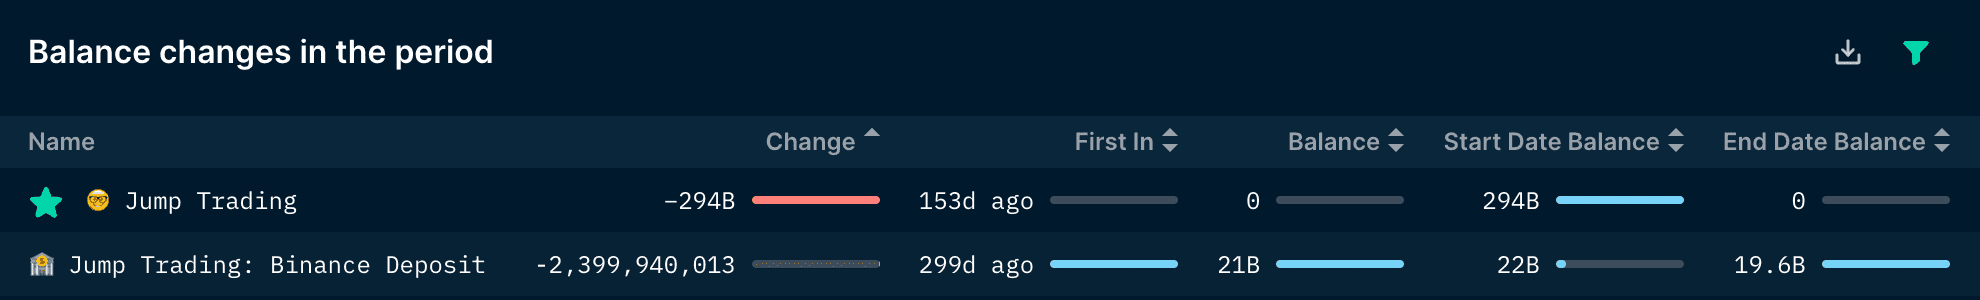
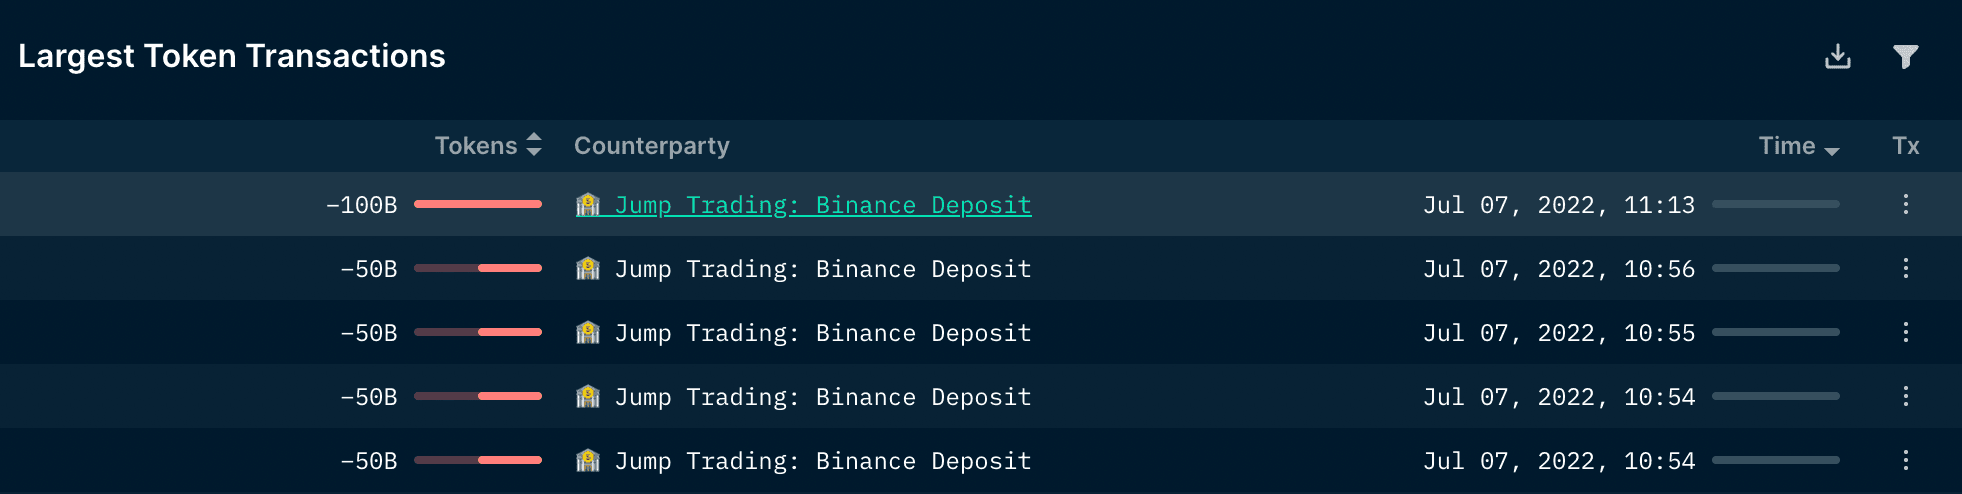
- A net outflow of 272b SHIB from funds in the last 90 days.
- Jump Trading sent a total of 300b SHIB (~$3.85m) to Jump Trading: Binance deposit on 6 Jul 2022.
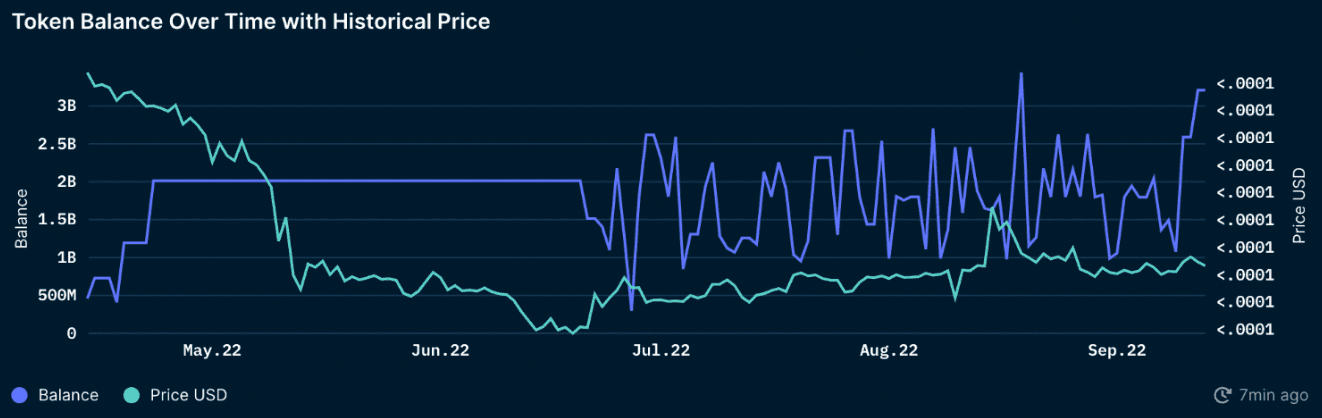
- LedgerPrime (0xcc5) has been trading in and out of their SHIB position since June this year.
- LedgerPrime’s SHIB balance over time with historical price is choppy and volatile, which infers that they are actively trading SHIB and monitoring their positions.
- Their current token balance from this wallet is $40.6k SHIB.
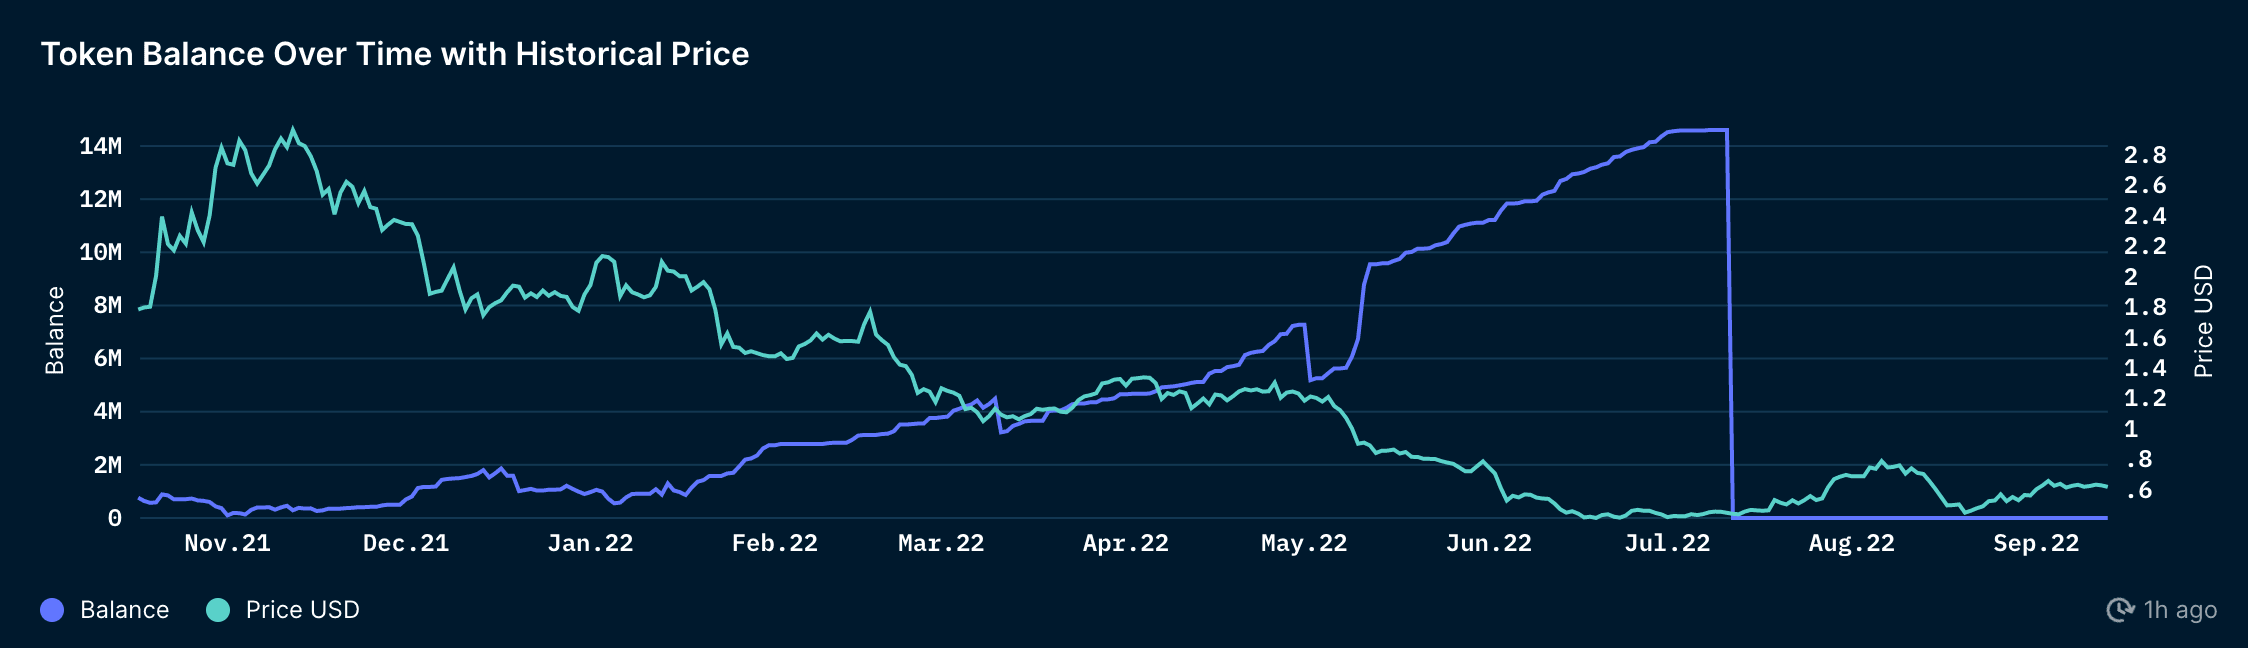
- A net outflow of $1.2m BIT in the last 90 days with Alameda Research and Spartan Group leading the outflows.
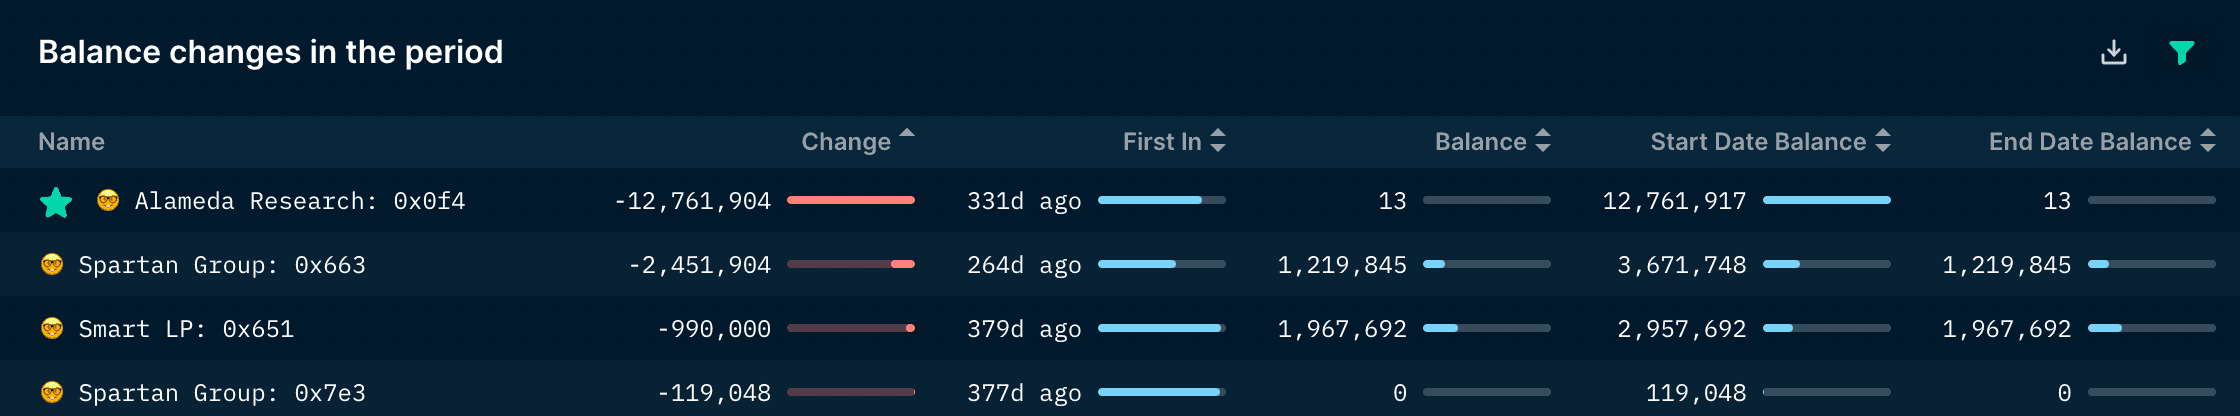
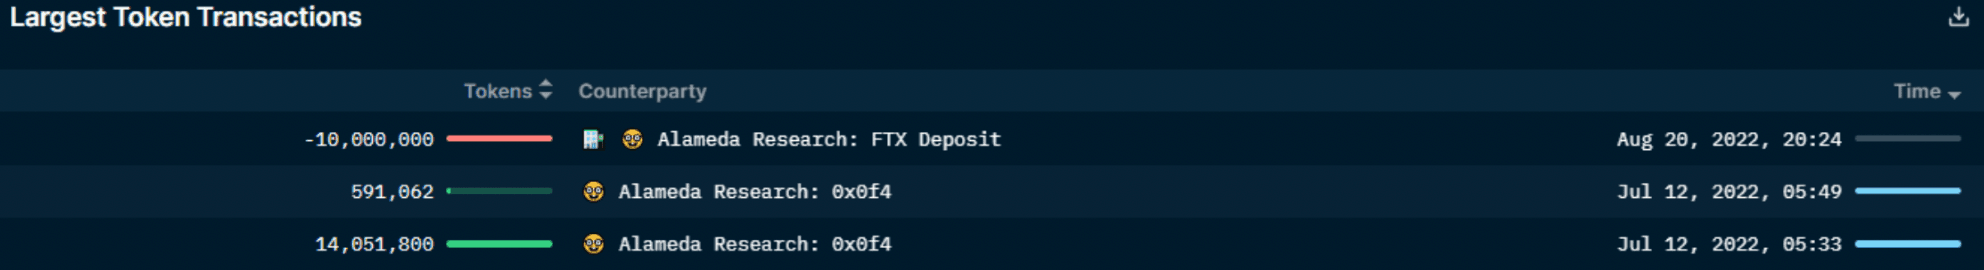
- Alameda Research (0x0f4) has been accumulating BIT since Oct 2021 and on 12 Jul 2022, it sent 14.6m BIT (~$8.7m) to Alameda Research (0xc5e). 10m BIT (~$6.2m) was then sent to Alameda Research: FTX deposit on 20 Aug 2022.
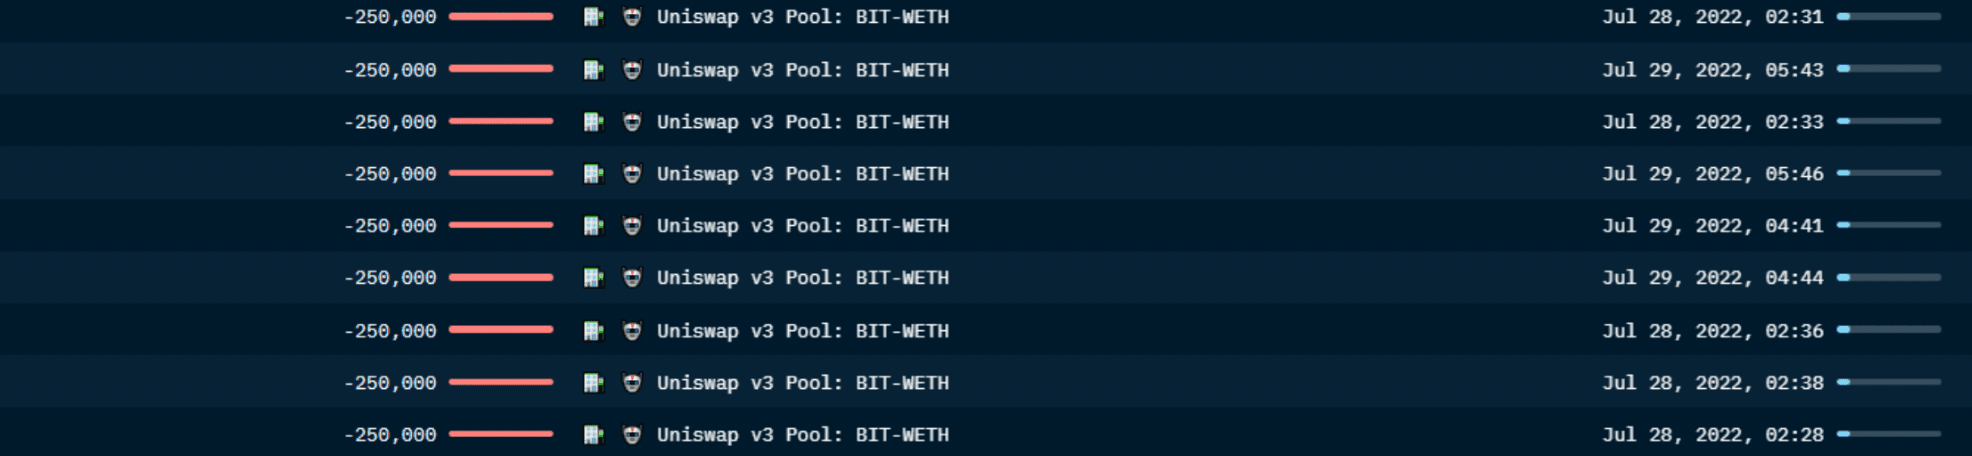
- Between 28 Jul and 9 Aug, Spartan Group (0x7e3) sold 2.8m BIT ($1.7m).
NFT Market Overview (Ethereum)
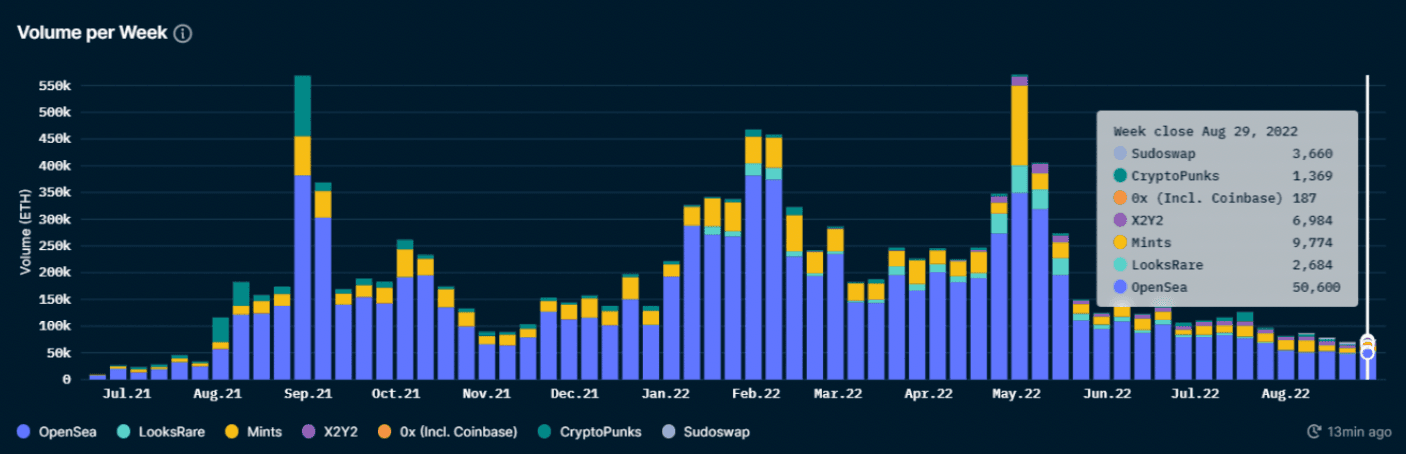
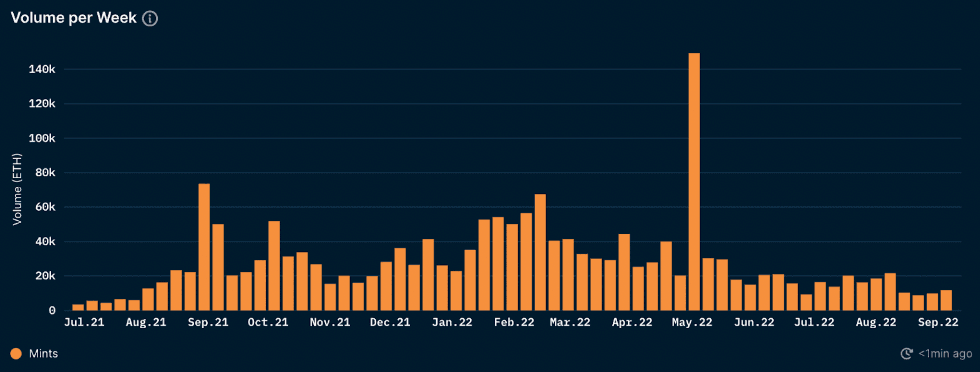
The NFT market has been on a consistent downtrend since early June this year. At the start of the year, NFT volumes were ranging between 300-400k ETH per week (~$470-500m). As of 30 Aug 2022, NFT volumes were hovering at ~100k ETH (~$100-150m) each week.
The overall NFT market as measured in ETH volume continues to fall and has dropped to levels previously unseen since Nov 2021.
Primary Market: How are Mints Performing?
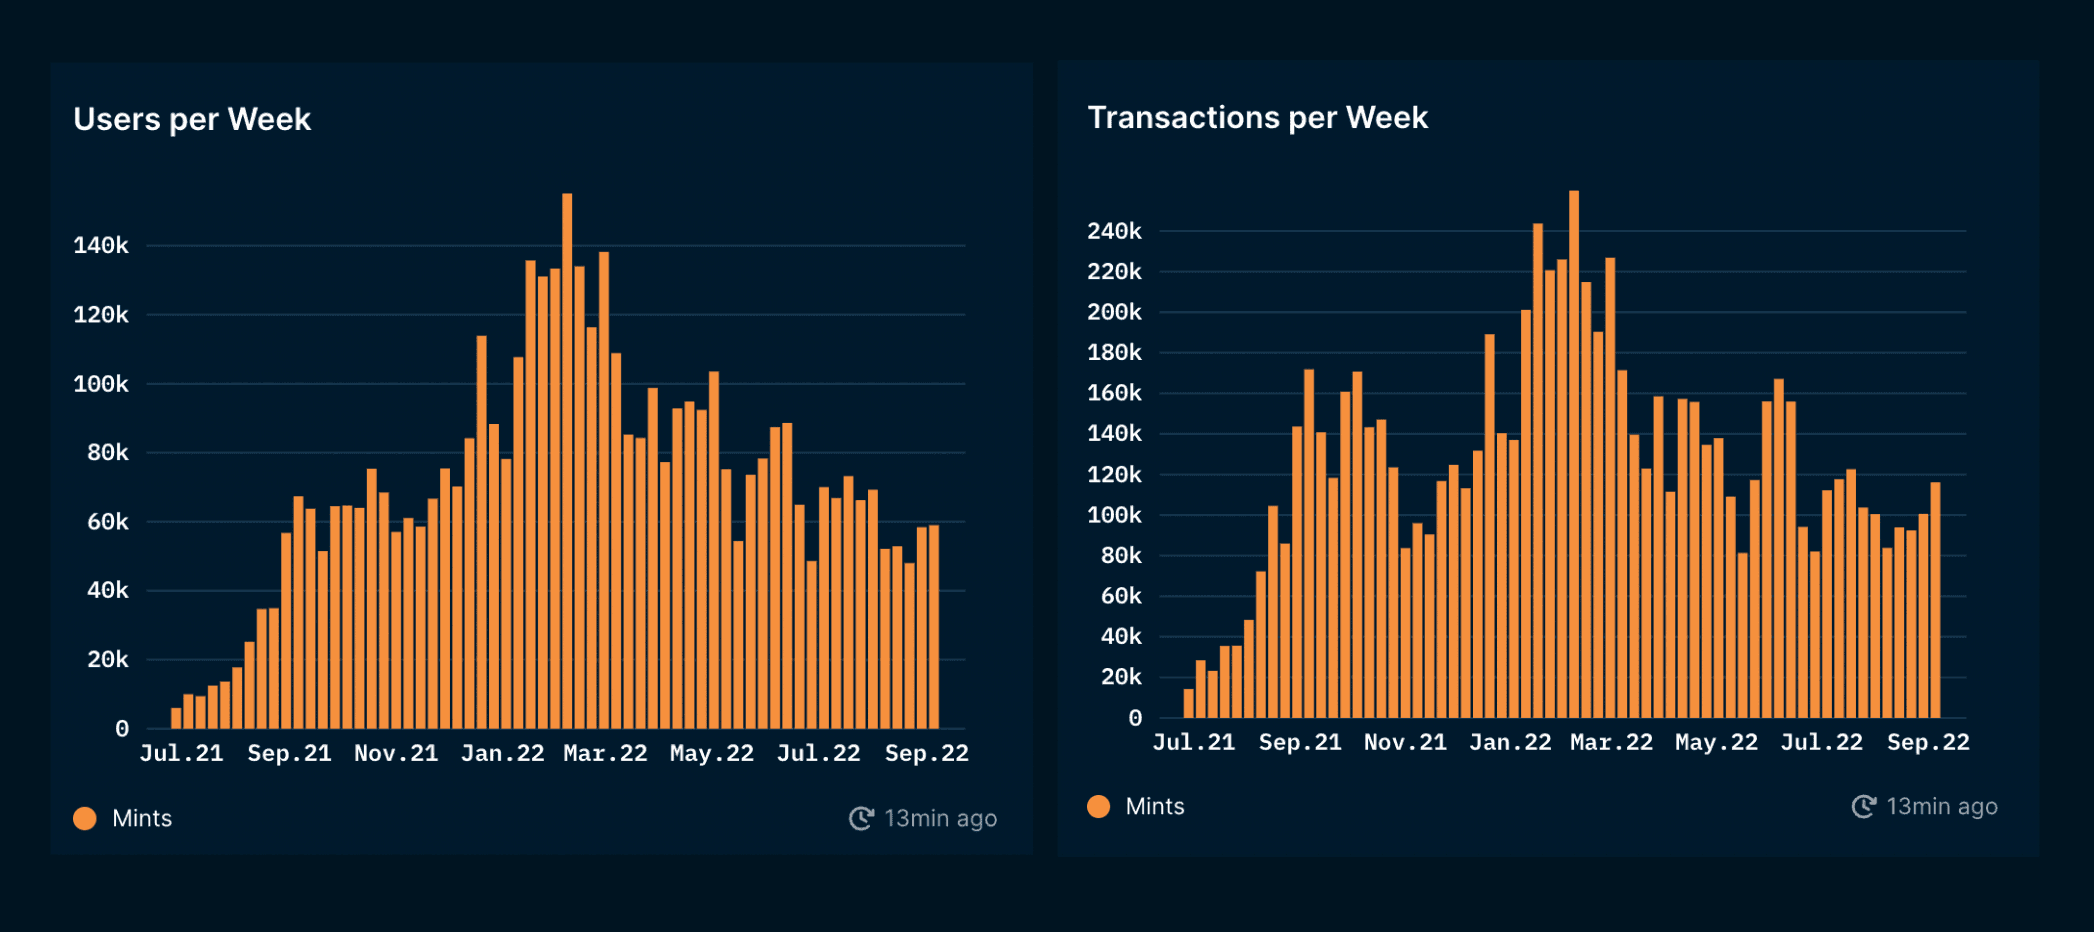
Overall, there is growing fatigue in the NFT primary market (i.e: mints). Compared to the volumes (in ETH) generated earlier this year, mint proceeds have trended down by nearly 500%. The lower volumes per week might also be attributed to free mint meta, in which collections are prioritizing their users/ community over raising capital in the primary market. Free mints typically result in less capital raised from NFT projects, which can be observed by the lower volumes.
Both users and transactions per week have also been on a downward trend. This could imply that there is a lower appetite for NFT traders to mint newer collections. There is a risk-off behavior within NFT traders, possibly to wait until there are better signs of market recovery to re-deploy their capital on NFTs. Both users and transactions per week have trended down by >50% YTD.
Secondary Market: What are Smart NFT Traders Buying/ Selling?
Methodology:
- Removed all of the notable collections with inflated market-caps to surface what smart NFT traders are buying/ selling for mid-cap NFTs.
- Collections removed from data collection are: BAYC, CryptoPunks, Otherdeed for Otherside, Mutant Ape Yacht Club, Clone X, Chromie Squiggle: Art Blocks, Ethereum Name Service (ENS), Moonbirds, Blankface, Veefriends. These collections have a market cap of >= 100k ETH (~$160m).
- Mid-cap NFTs are collections with sufficient liquidity, and buy/sell volume, but have not proven their blue-chip status over the test of time. If Smart NFT traders are accumulating and diversifying their positions for these collections in a bearish/ sideway market, this might signal potential alpha and conviction as longer-term plays.
The four relevant segments as a strong proxy for the behavior of Smart Money in NFTs are:
- Blue Chip Holder- Wallets that are currently holding at least one Blue Chip NFT in their portfolio. The Blue Chip projects are the same as the ones defined in the Nansen Blue Chip NFT Index
- Smart NFT Early Adopter- The top 100 addresses that have invested in selected blue-chip projects before a specified date and are still holding an NFT from the project
- Smart NFT Hodler- The top 100 addresses in terms of estimated profits of their current NFT portfolio and top 100 addresses based on our internal hodler score metric
- Smart NFT Trader- The top 100 addresses in terms of realized profits from NFT sales and top 100 addresses based on our internal trader score metric
Top collections bought by Smart Money in the last 90 days (ranked by ETH volume)
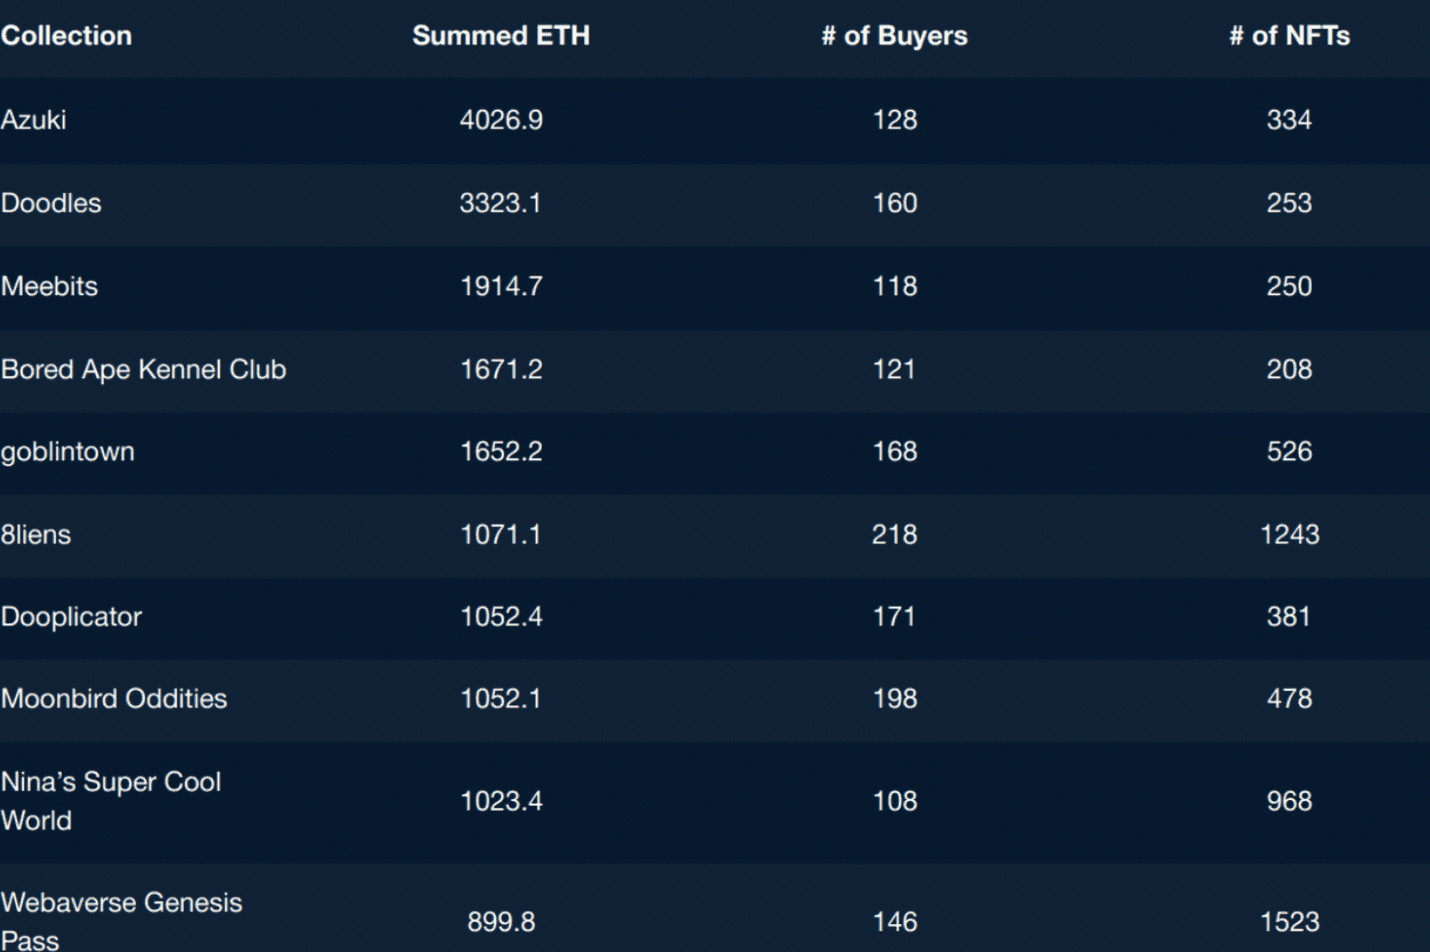
- Ranked by the highest summed ETH value, Azuki, Doodles, Meebits, BAKC, goblintown, 8liens, Dooplicator, Moonbird Oddities, Nina’s Super Cool World, Webaverse, etc. had the most buys in ETH value.
- Ranked by the most buyers for an individual collection, 10KTF Stockroom, The Potatoz, 8liens, Moonrunners, Moonbird Oddities, Rare Apepe YC are listed as the top collections.
NFT collections with the highest net positive change in quantity (SM buys - SM sells)
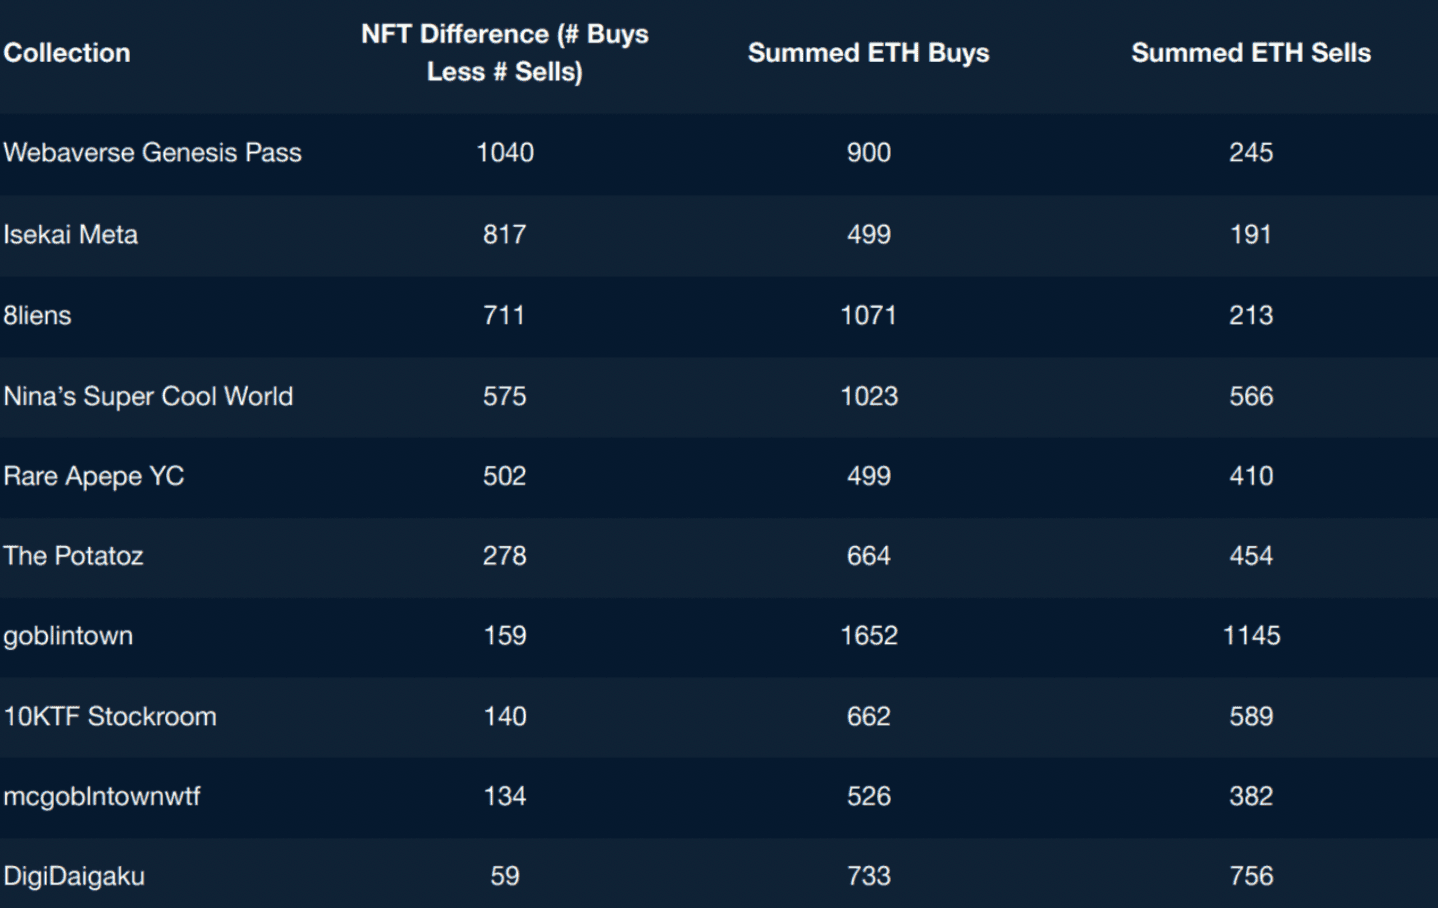
- The NFT difference column refers to the # of buys less # of sells.
- In the last 90 days, the collections with the highest net positive change in quantity among Smart Money are Webaverse Genesis Pass, Isekai Meta, 8liens, Nina’s Super Cool World, Rare Apepe YC, The Potatoz and Goblintown.
Top collections sold by Smart Money in the last 60 days (ranked by ETH volume)
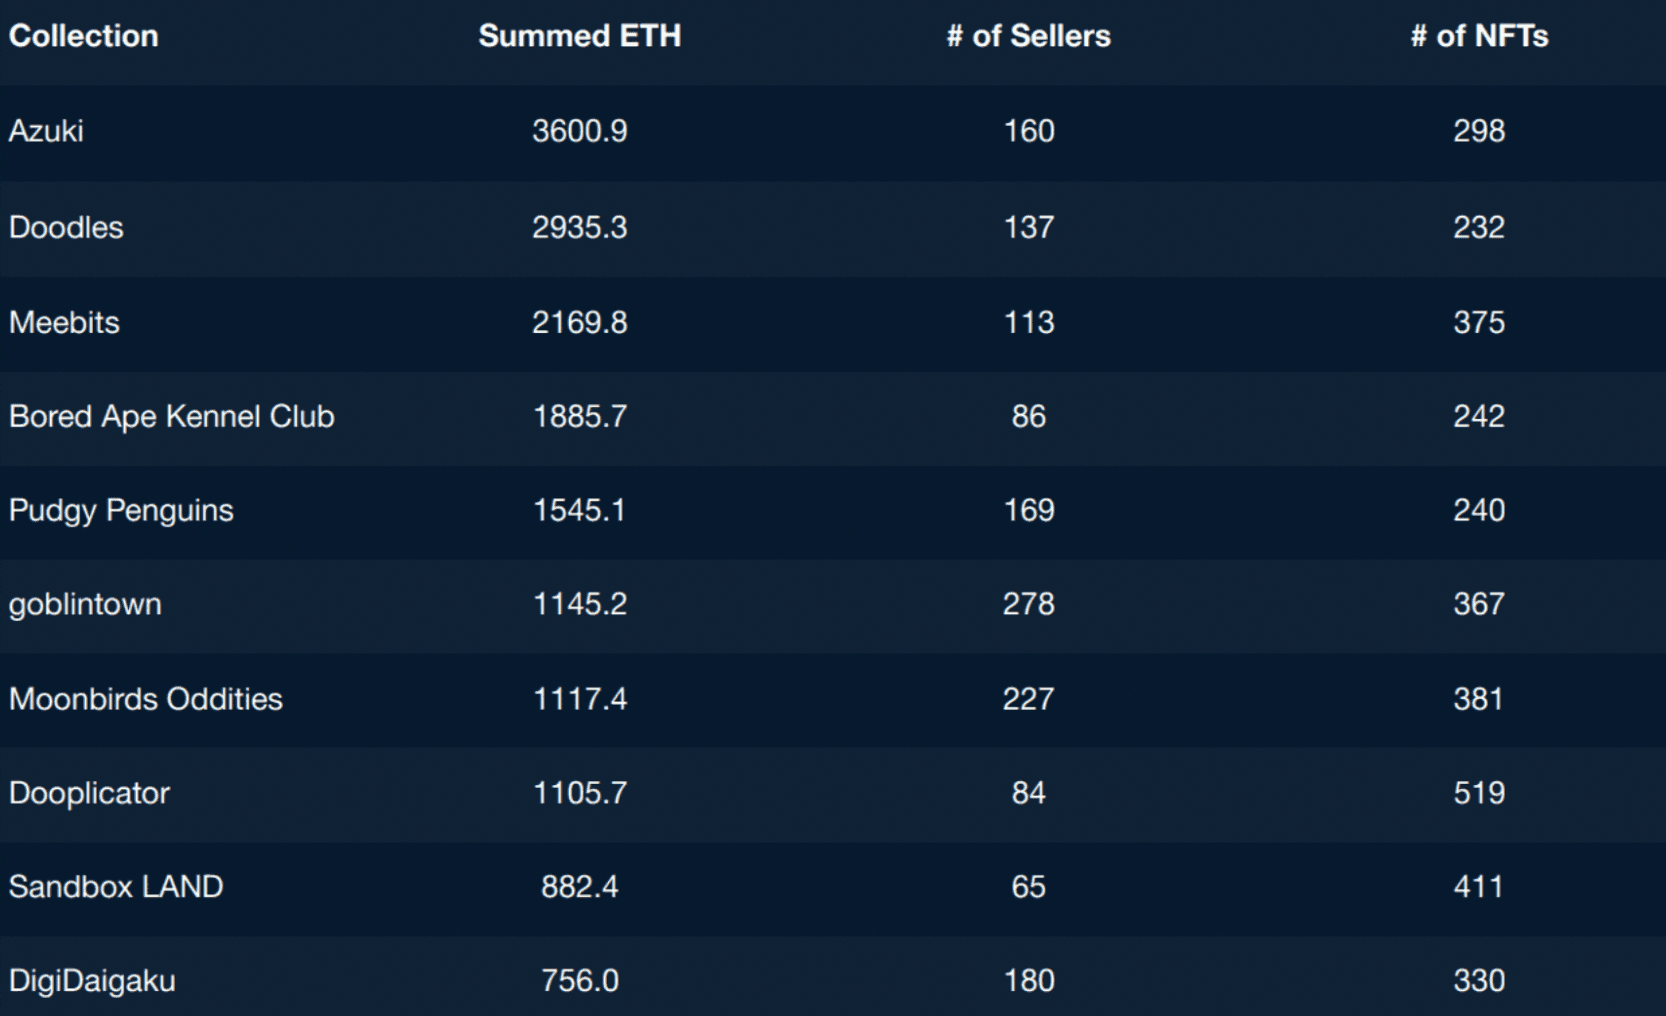
- Ranked by the highest ETH summed value for smart NFT traders, Azuki, Doodles, Meebits, BAKC, Pudgy Penguins, goblintown, Moonbird Oddities, Dooplicator, Sandbox LAND stand out as collections that were sold off.
NFT collections with the highest net negative change in quantity (SM buys - SM sells)
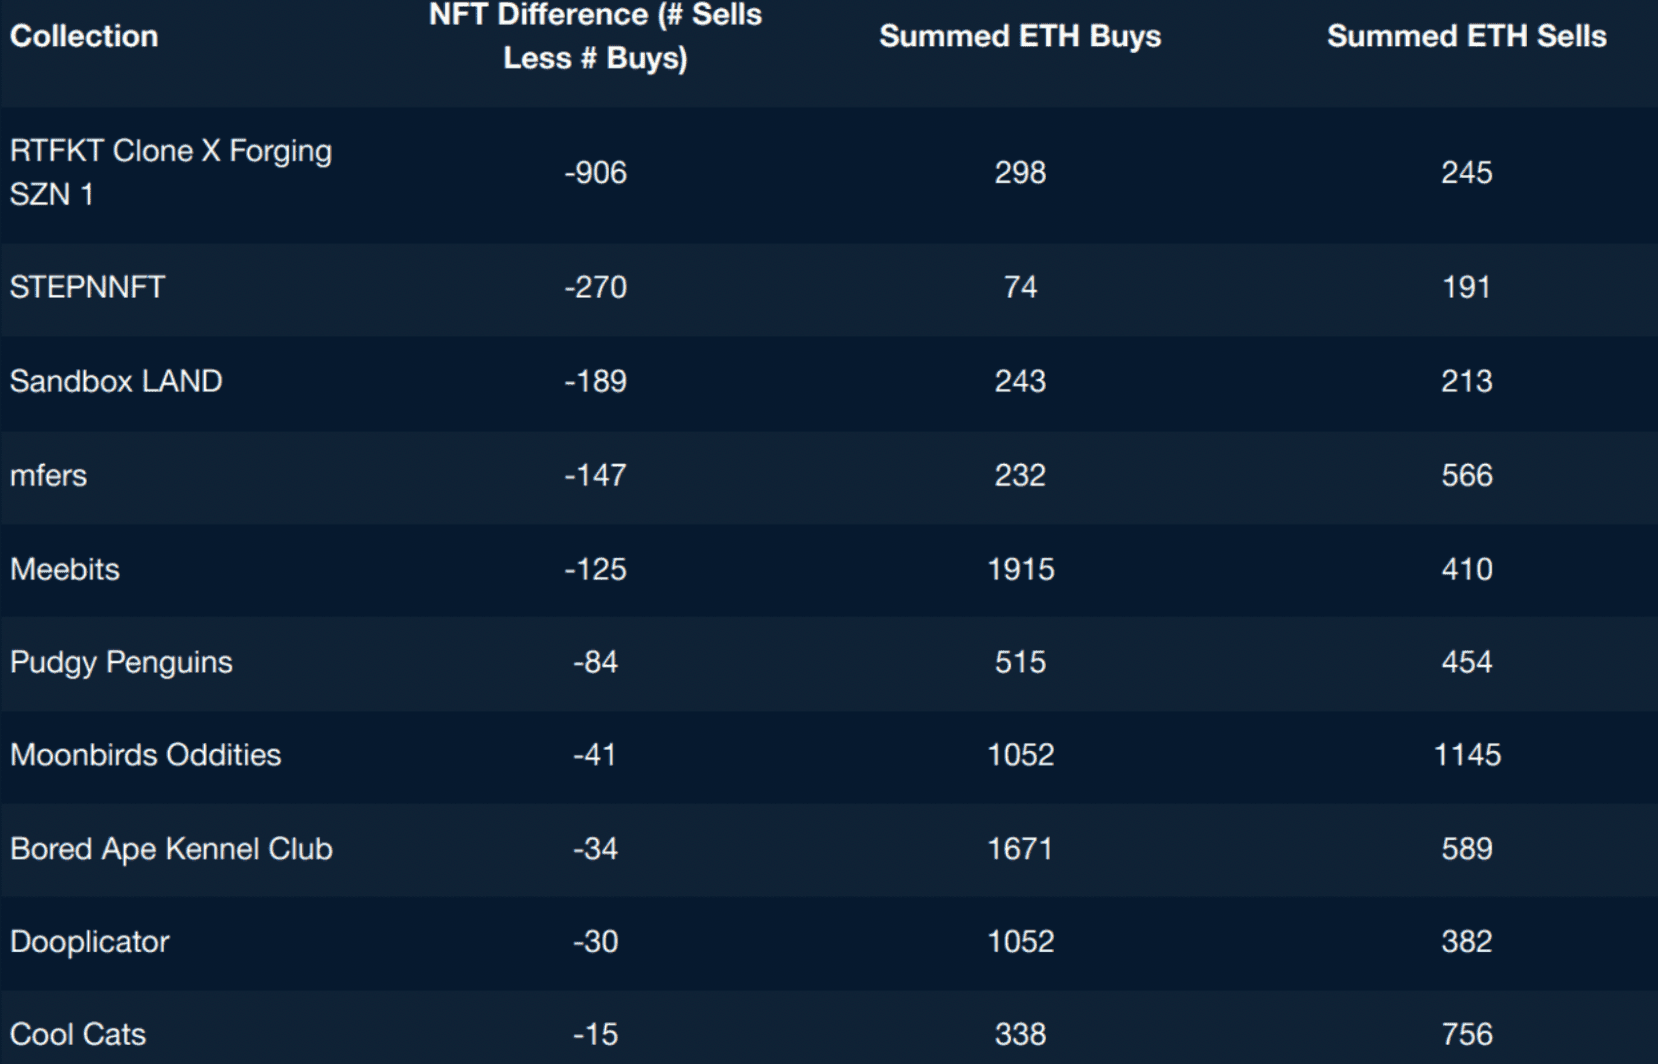
- In the last 90 days, the collections with the highest net negative change in quantity among Smart Money are RTFKT Clone X Forging SZN, STEPNNFT, Sandbox LAND, mfers, Meebits, Pudgy Penguins, Moonbird Oddities, and BoredApeKennelClub
- A large majority of these are secondary collections or airdrops indicating that Smart Money may be de-risking and locking in profits without having to sell the main collection.
Most Profitable NFT Traders (in the last 3 months)
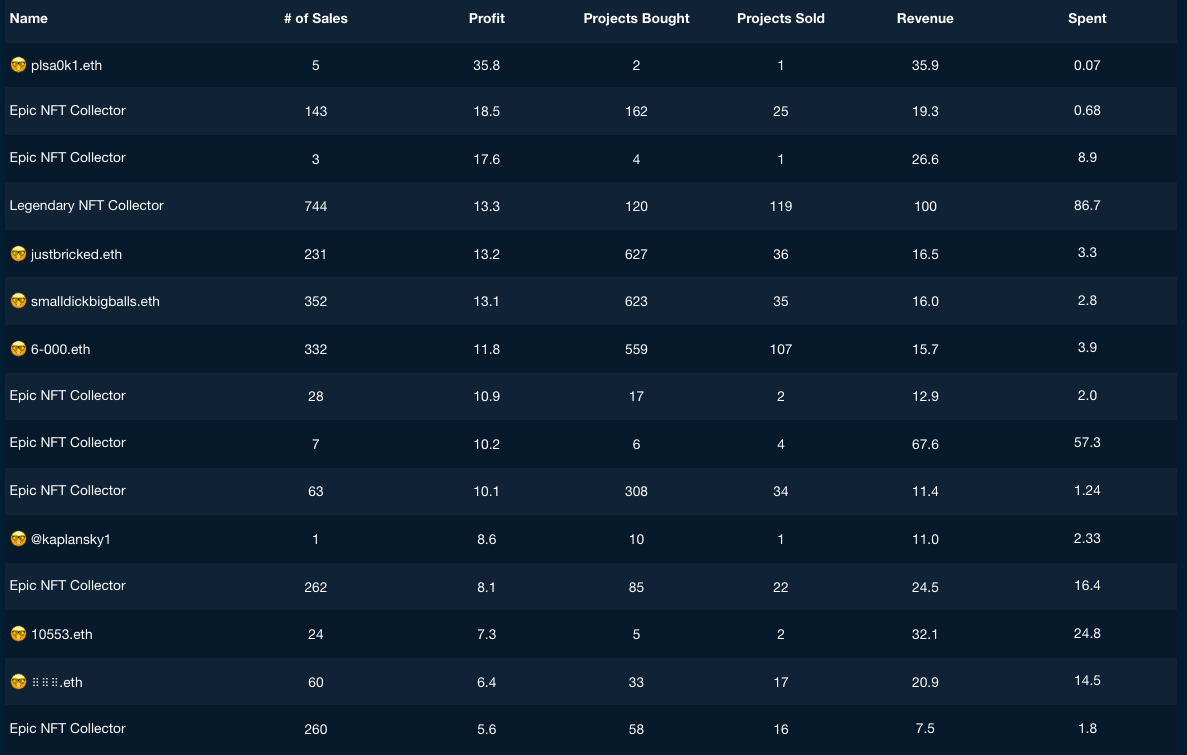
- Based on the above chart that is adjusted for wash-trading, there wasn’t an abundance of profit-taking opportunities within the past 3 months.
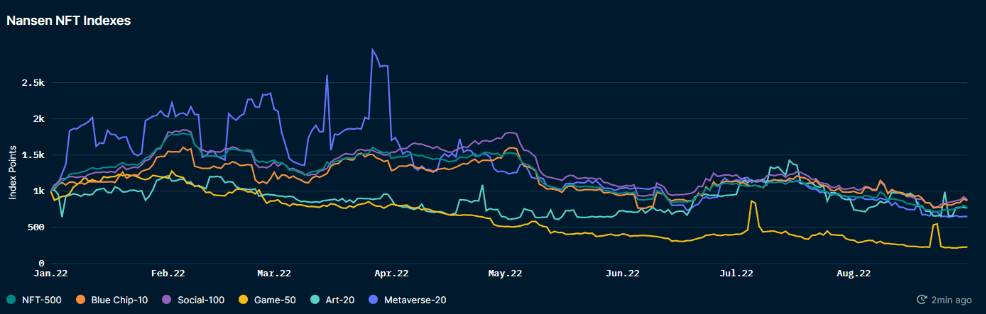
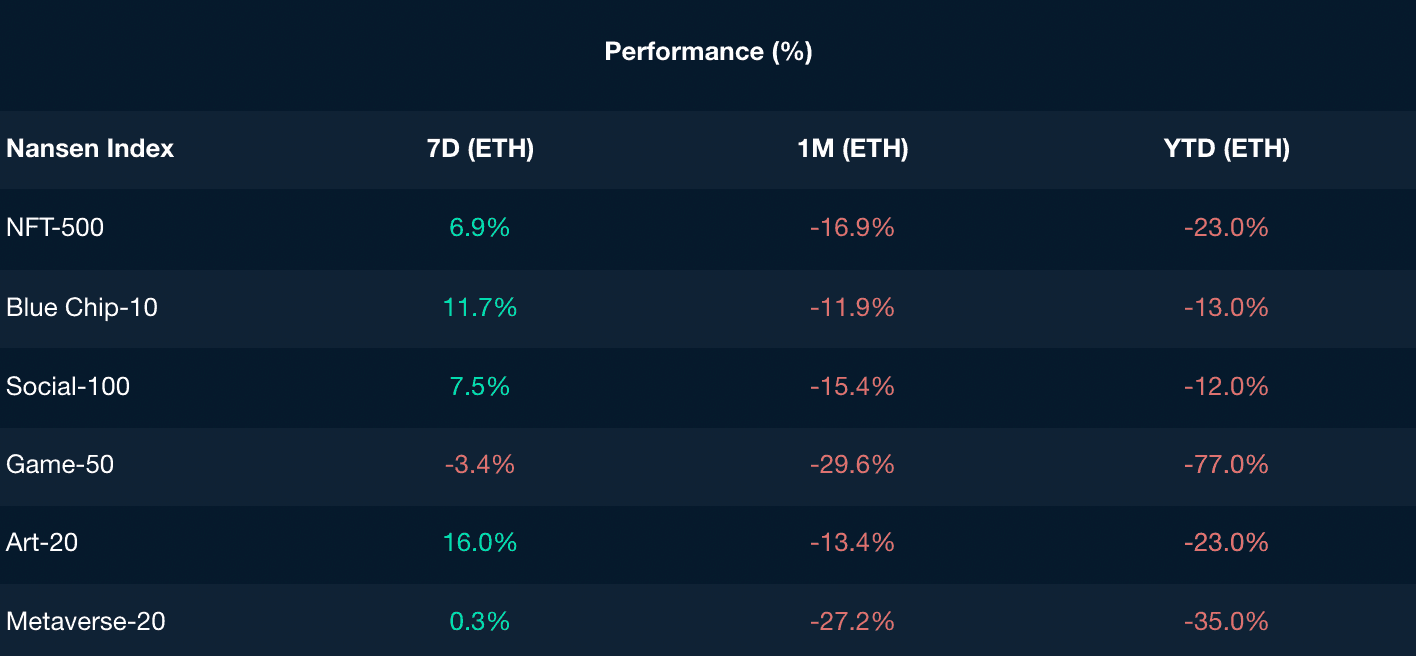
- Earlier, we mentioned that the overall NFT market as measured in ETH volume continued to decline and has dropped to levels previously unseen since Nov 2021. Every single Nansen NFT Index (including the Blue Chip-10) is down between -12% to -77% as measured in ETH terms. Most of these traders are currently not trading as much as previously, or are not realizing a significant amount of profits.
Most Profitable NFT Collections from Top 15 Smart NFT Traders (in the last 3 months)
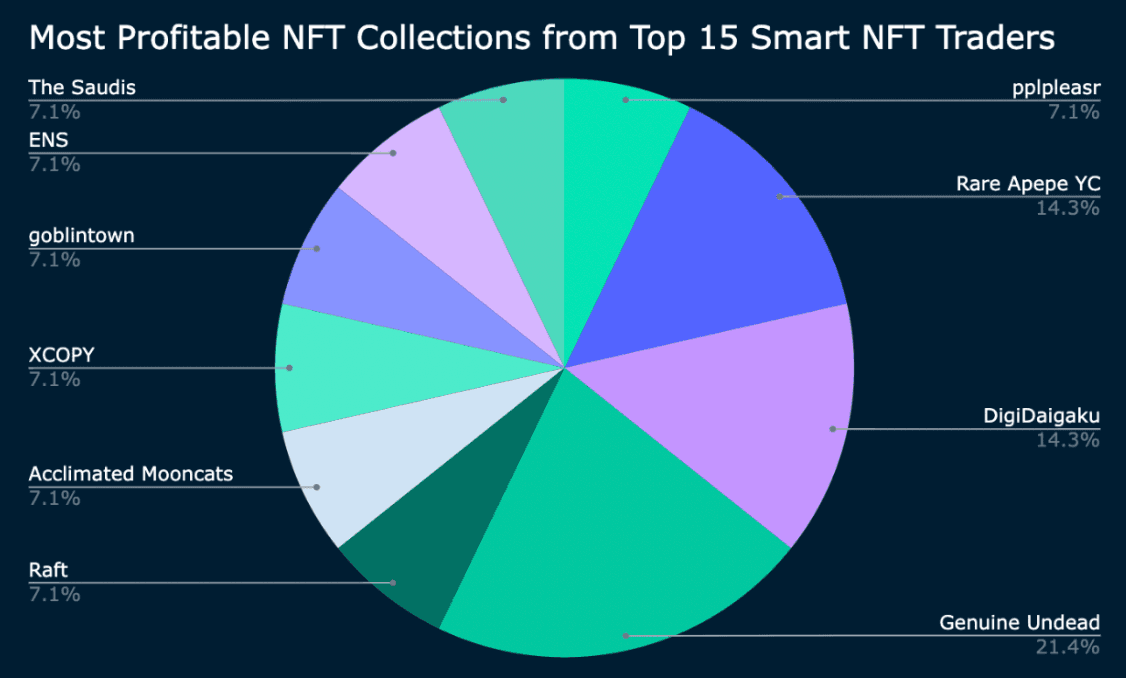
- From the list above, we drilled down to each of the smart NFT collectors and analyzed the top NFT collection in which they realized profits from in the last 3 month window.
- In order to surface the signal, we filtered out all the existing labels and only kept smart money wallets, Epic NFT collector, and Legendary NFT collector.
- To ensure that these wallets are active addresses, regularly trading and realizing profits and/or holding notable NFTs, we filtered out addresses that had only made a single trade, regardless of their Smart NFT Trader categorization.
- Based on our findings, Epic NFT Collector realized the most profit in the last 3 months, after filtering the other labels. This label generated a total of 50 ETH profit from the Otherdeed for Otherside NFT collection.
- Genuine Undead was the collection where 3 of the Top 15 Smart NFT Traders realized their profits, followed by DigiDaigaku, and Rare Apepe VC. - Majority of the other collections where users realized profits are newer collections that launched within the past 3 months.
- Most of these NFT collections above started off as a free mint, with both prices and community rallying for a significant amount of profit.
Conclusion
- The demand for blockspace is on a consistent downward trend. This implies that on-chain activity has been down significantly in the past 3 months; NFT market activity by volume has also been the lowest since November 2021. This shows that there is fatigue across the various verticals in crypto, both in DeFi and NFTs.
- Fund inflows were mainly into stablecoins and blue-chips. Many of these funds seem to be de-risking their positions and holding on to notable blue-chip assets.
- Fund outflows can be attributed to recent token unlocks and investors deciding to reduce their position and holdings due to many reasons.
- In the NFT primary market, mint proceeds have trended down by over 500%. There’s been a shift from pay-to-mint to free mints to shore up user base, which we found to be the most profitable type of mints in the last few months.
- In the NFT secondary market, most of the smart money buyers have either invested in newer mints or faced a strong selling pressure on older collections and airdrops, which showed another sign of risk-off mode.