Introduction
Lately, the stablecoin market has faced some big challenges due to recent events like the banking crisis and heightened regulatory oversight. These events have caused considerable fluctuations in the market, with different stablecoins displaying diverse reactions.
This report looks at how the stablecoin market changed during the crisis, exploring how different stablecoins reacted with varying degrees of correlation. It also investigates the role of lending pools during the USDC de-pegging event. Furthermore, It delves into the correlations between specific stablecoins, the effects of these correlations on risk management, and the changing usage trends across the DeFi ecosystem. Lastly, the report underscores the vulnerability of the stablecoin market to external crises and the ongoing search for a truly decentralized stablecoin.
The de-peg
The USDC de-peg was a significant event, with widespread effects on the prices of other stablecoins in the market. Some of the major stablecoins reacted differently to this event, with varying degrees of impact. To better understand this, the table below presents several key metrics for the top stablecoins between the 9th and 16th of March 2023. It is worth remembering that this was triggerred by the collapse of Silicon Valley Bank on the 10th of March as a result of a bank run(second-biggest bank collapse in U.S. history). Circle, the issuer of the USDC stablecoin, had $3.3b out of the ~$40b reserves, that are used to back USDC, with SVB as of the 11th of March.
The table gives a complete look at the stablecoins analyzed, showing data such as the mean, maximum, and minimum prices, the highest and lowest percentage changes from the $1 mark, as well as the standard deviation of prices. This helps us understand how the various stablecoins performed, highlighting the magnitude of the de-peg's influence.

From the data in the table, it is clear that the majority of the top stablecoins are linked, whether directly or indirectly, to the US Dollar. Throughout the specified period, the mean value of USDT and LUSD remained marginally above $1. Moreover, the average prices of BUSD and TUSD demonstrated a decent performance, hovering around 0.999, while USDC, FRAX, and DAI exhibited notably lower mean prices.
Taking into consideration the minimal percentage deviation from $1, it is clear that, aside from USDC which was the catalyst for the crisis, DAI and FRAX also experienced a substantial de-pegging, with their values declining by more than 10% (-10.6% and -11%, respectively). In contrast, USDT showcased the most resilience, with its lowest price during the event deviating by a mere -0.298% from $1, followed by BUSD at -0.769%. These two stablecoins were the most successful in maintaining their value as close to $1 during the de-pegging event.
Although LUSD is not directly influenced by USDC, being backed by Ethereum, it still encountered a de-pegging of approximately -4.55%, which is substantial. However, it registered the highest percentage change from $1 at 3.54% (with the exception of RAI). It is worth noting that RAI is not pegged to the dollar; hence, analyzing its percentage change from $1 is not particularly relevant. Nonetheless, by observing its standard deviation (which was the highest among the group), it is evident that RAI also underwent significant volatility during the de-pegging period under investigation.
In summary, the data reveals that the top stablecoins were impacted by the USDC de-peg to varying degrees. Some exhibited greater resilience during periods of de-pegging while others closely mimicked USDC.
De-peg chart for the top stablecoins
The chart displayed above presents an overview of the price movements of various stablecoins during the de-pegging period. An analysis of the numbers from the table and the chart shows a pattern emerging.
- The performance of USDC, DAI, and FRAX seems to be strongly correlated, while the price movements of the remaining stablecoins appear to be less reliant on USDC. This is not unexpected, however, given that USDC is extensively employed in both protocols (in MakerDAO and Frax Finance). The chart shows that the price movements between USDC and FRAX, in particular, are almost identical, closely tracking each other during the fall and recovery.
- During the de-pegging period, TUSD also experienced a setback but recovered much more rapidly, and the impact was also much weaker. USDT and BUSD demonstrated the least volatility throughout the observed period.
- The chart also reveals an interesting point that is not evident in the table, namely the response time of the stablecoins' price movements. A notable observation can be made by focusing on the price movements of LUSD. An uptick in the price of LUSD can be observed before any major de-pegging occurred on the 10th of March. This shows that individuals that were first to make significant moves began to de-risk their USDC position, with some of the inflows ending up in LUSD, causing the price to spike. This suggests that the early withdrawers saw LUSD as one of the safest places to deposit their assets during the crisis. This is not surprising given that the problems were caused by the recent banking crisis, which spilled over into the crypto market. LUSD, along with RAI, is one of the only stablecoins on the list without any fiat backing, making it potentially more protected than other stablecoins with fiat exposure (during a crisis triggered by bank failures).
Price correlation matrix during the de-peg

The chart above provides a correlation matrix between the various stablecoins in order to quantify and understand the extent of their interdependence. The analysis looked into the correlation between the price movement of the above stablecoins during the de-peg and recovery period ( namely starting from March 9th to March 16th).
Understanding the relationship between the various stablecoins can help aid in minimizing contagion risk. A correlation matrix is valuable in providing insights into these relationships.
By analyzing the correlation matrix table above, we uncover the degree to which stablecoins move in tandem with each other. If two stablecoins have a high positive correlation, it suggests that they are influenced by similar market drivers. On the contrary, a negative correlation indicates that these stablecoins move in opposite directions, potentially due to diverging risk exposures and market conditions.
During the de-pegging period, we observed how different stablecoins react to market volatility and how their prices moved relative to each other. This can help us identify stablecoins that demonstrate greater resilience during turbulent times and those that may be more susceptible to volatility.
The correlation matrix can enable us to uncover patterns and trends that may be missed if we solely concentrate on individual stablecoins.
The correlation matrix above can also be used as further confirmation of the price correlation observed between certain stablecoins in the previous section.
- Based on the chart, the correlation between DAI and USDC stands at a remarkable 0.98. This demonstrates a strong, positive relationship between the two stablecoins, indicating that they tend to move in the same direction, particularly during the USDC de-peg. Similarly, DAI and FRAX exhibit a high positive correlation of 0.99, reinforcing the notion that these two stablecoins share a strong connection in terms of their price movements. The extremely high correlation metrics are a confirmation that during times of crisis (triggered by USDC specifically) the DAI and the FRAX protocol implementation do not offer any additional hedge and act as a proxy to the USDC price (simply reflecting its price movement).
- On the other hand, the negative correlation of -0.59 between USDC and USDT during the de-peg period indicates an inverse relationship between the two. This implies that when the value of USDC declined, the value of USDT surged, and vice versa. This demonstrates that although both stablecoins are backed by fiat, there is sufficient separation between the two distinct issuers (such as utilizing different banking services), resulting in a negative correlation.
- In addition, we can observe that USDC demonstrates a robust positive correlation with several other stablecoins, including LUSD (0.68), TUSD (0.75), and RAI (0.86). The high correlation between USDC and RAI is particularly unexpected since RAI is not pegged to the US dollar. Nonetheless, during the de-pegging of USDC, there appeared to be a substantial shift in the flow of stablecoins, both fiat and non-fiat-backed, as users sought to mitigate risk. This implies that the stablecoin market continues to absorb risks and volatility as a whole to a significant degree.
- Notably, USDT showed a distinct pattern, with negative correlations observed in its relationships with FRAX (-0.6), TUSD (-0.18), and RAI (-0.38), as well as a near-zero correlation with BUSD (0.08). This suggests that USDT's price behavior is determined more independently in comparison to other stablecoins in the market.
- These findings can assist users in constructing well-diversified portfolios and identifying potential hedging opportunities in the dynamic landscape of the stablecoin markets. For example, the data suggest that there is little justification for diversifying holdings into DAI, FRAX, and USDC from a risk management point of view.
Value locked across dApps and Exchanges
Assessing the utility of stablecoins in the market is crucial in understanding their value and potential impact. One way to measure their utility is by analyzing their use cases across different fields within DeFi, such as in applications, bridges, and lending protocols. A higher usage of a stablecoin in these contexts indicates a higher level of trust and perceived value by the market.
To better understand the adoption of stablecoins since the USDC de-peg, it is useful to compare the ‘total value locked (TVL)’ across DEXs, staking pools, lending protocols, and bridges. Examining the ‘TVL’ for the top stablecoins such as USDT, DAI, USDC, BUSD, FRAX, TUSD, and USDP, can determine market preferences and the extent to which a stablecoin has been integrated into the DeFi ecosystem. This information provides valuable insights into the market's adoption and acceptance of different stablecoins, which can be essential for investors and stakeholders making informed decisions about their potential in the crypto market.
The chart below gives an overview of the number of tokens locked in bridges, DEXs, CEXs, staking pools, and lending pools as identified by Nansen labels (starting from the 1st of January 2023).
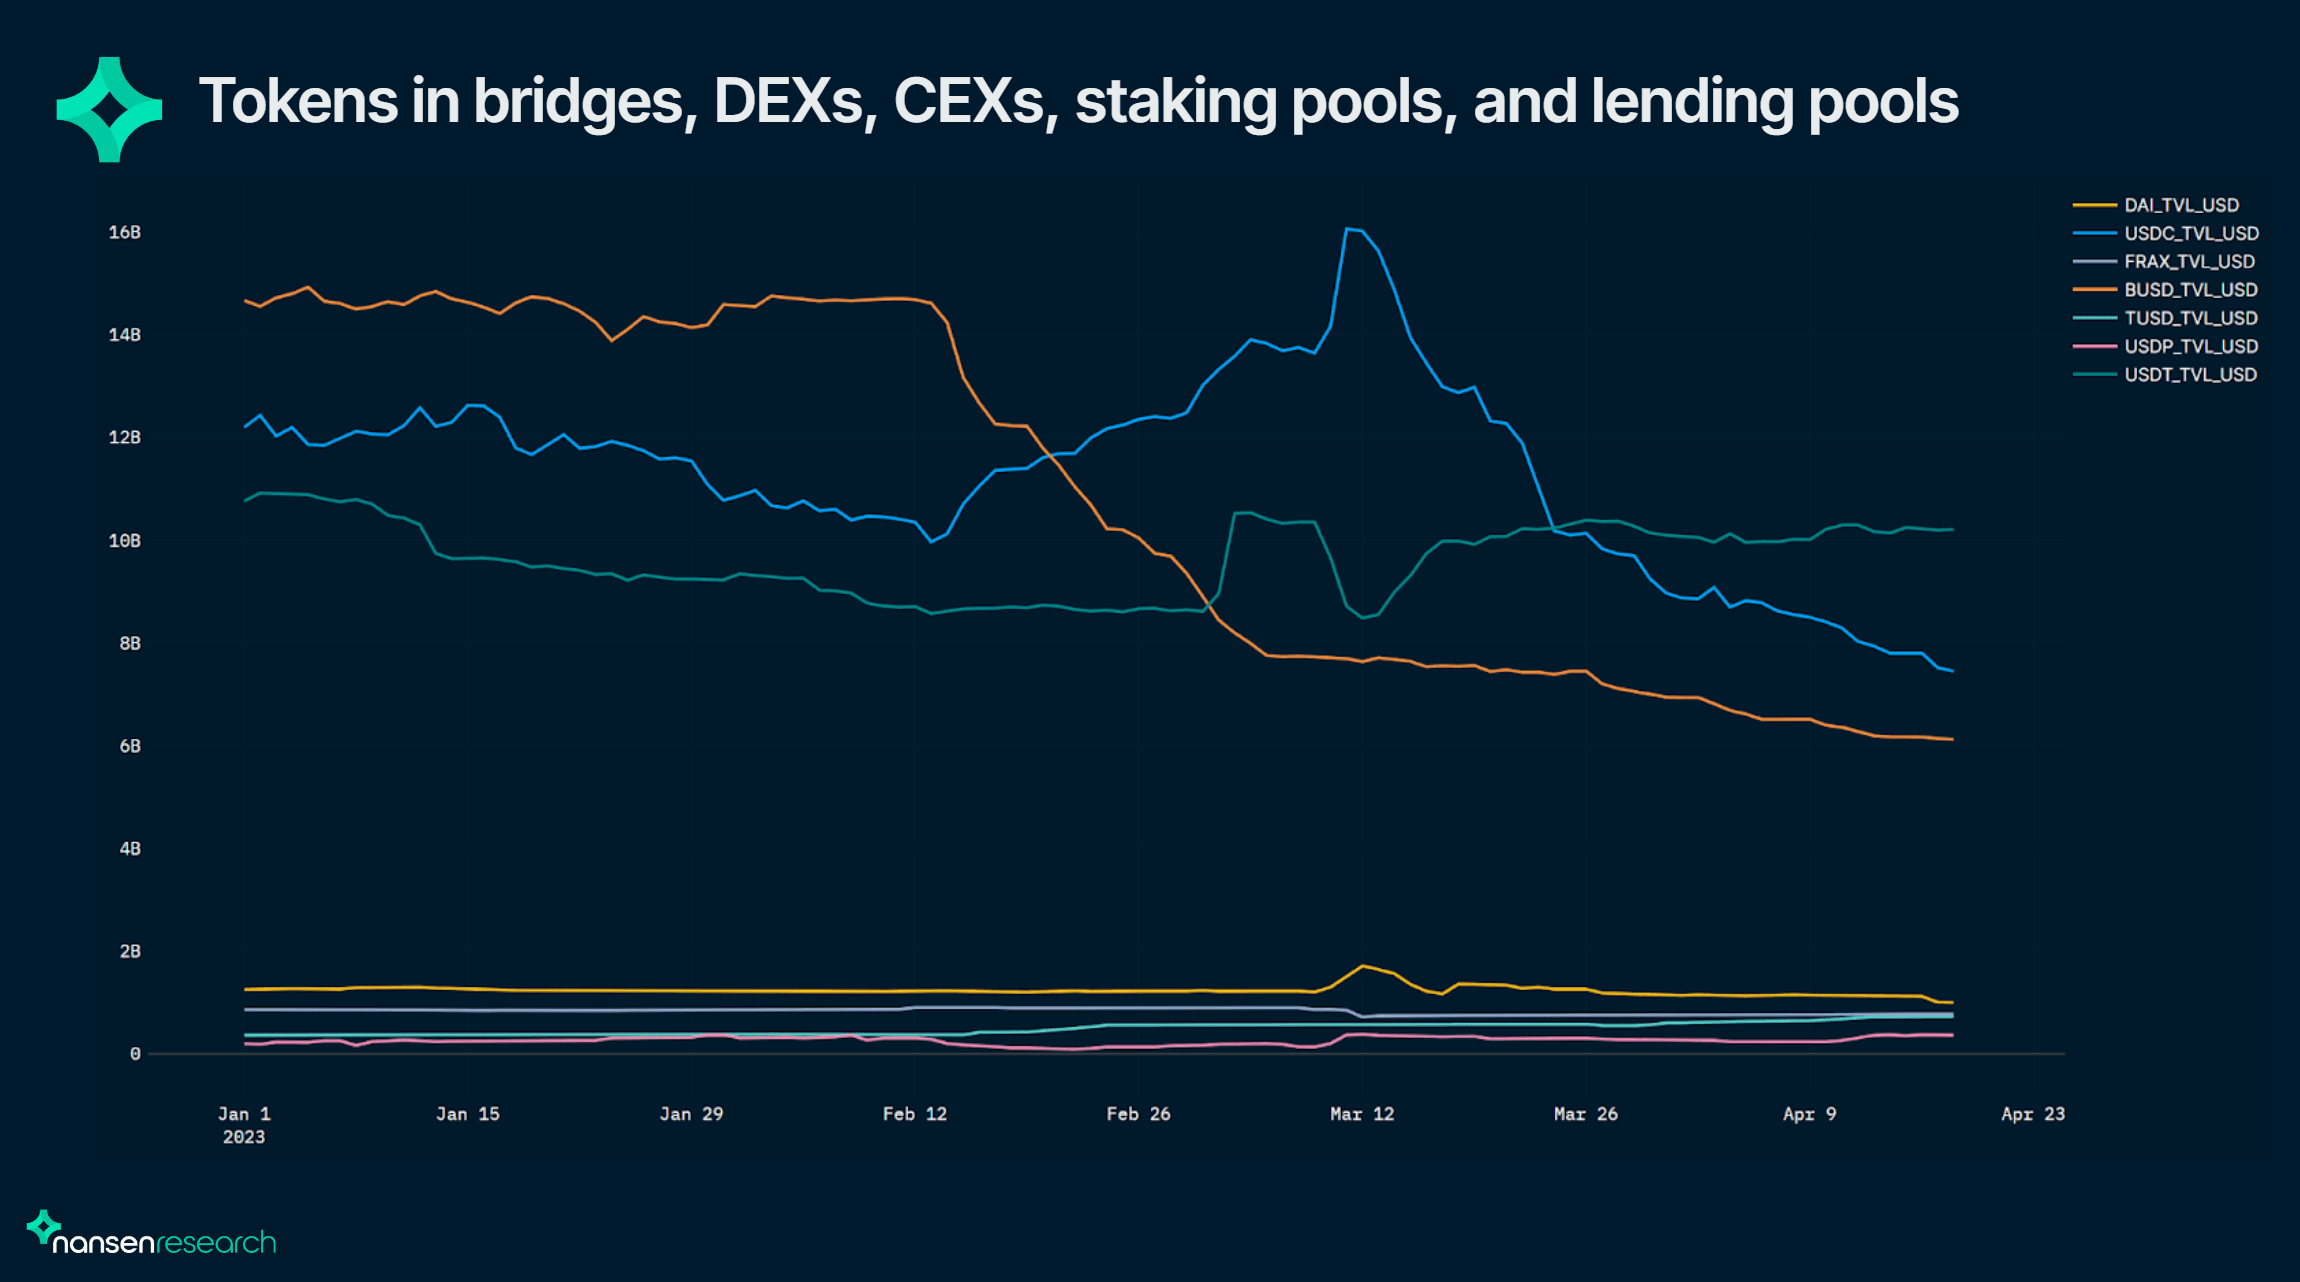
It is evident that the stablecoin market is dominated by three main competitors, namely BUSD, USDC, and USDT, in terms of the number of tokens locked across all fields mentioned. However, the usage of these stablecoins has been subject to fluctuations and disruptions in recent months.
The decline in the usage of BUSD can be attributed to the New York Department of Financial Services (NYDFS) directive, which required Paxos to cease issuance of new BUSD, causing the total amount locked to drop significantly from around $14.6bn in mid-February to around $6bn in mid-April. This trend is expected to continue, as there are no indications of a reversal.
On the other hand, the decline in BUSD's usage has been advantageous for USDC, as it managed to increase its dominance in line with BUSD's decline. However, its rise was short-lived as it de-pegged due to liquidity issues in mid-March, in which USDT emerged as the winner. Interestingly, USDC's usage has not recovered even after the de-peg was corrected, indicating a loss of credibility in the market since the debacle.
Apart from the top three stablecoins, the usage of DAI, FRAX, TUSD, and USDP is much lower in the space, with the number of tokens locked for these four stablecoins being around $987m, $768m, $717m, and $355m respectively, as of mid-April. DAI, in particular, shows similar usage patterns as USDC, with a yearly peak on the 12th of March at $1.7bn and declining ever since then.
The regulatory challenges encountered by BUSD and the liquidity difficulties faced by USDC have created a favorable environment for USDT, resulting in its dominance increasing by approximately $2bn since the USDC de-peg. As a result, USDT has now catapulted to the top position in the stablecoin market. Unless there is a significant change in the market sentiment of USDC, these changes are expected to remain in effect (at least) for the near future.
It is crucial to note however, that while comparing a stablecoin's integration into the DeFi ecosystem is informative, higher usage does not necessarily equate to a safer or superior store of value within the market. The market may prioritize various aspects of a stablecoin and, at times, disregard certain elements. A stablecoin's widespread use does not guarantee its security, decentralization, or utility. Numerous other factors, such as ease of use, perceived strength due to the reputation of the company issuing the stablecoin, marketing, and PR efforts, venture capital backing, and more, can influence the adoption of a stablecoin, sometimes more than the underlying solution and technology it employs.
As a result, while examining stablecoin usage across diverse applications can provide valuable insights, it is essential to recognize the limitations of this data. It is equally important to consider other factors beyond usage and market adoption when evaluating stablecoins, including their degree of decentralization, security, and associated risks.
Fluctuations of value locked in lending pools

In assessing the popularity and market acceptance of stablecoins, the availability of stablecoin markets and their usage across Defi applications are important metrics to consider. However, sudden token increases within specific applications, particularly lending pools, over a short period can be a negative sign. A more detailed analysis of the number of tokens locked in lending pools since the beginning of the year provides a deeper insight into this trend.
The chart presented above illustrates a significant spike in the amount of USDC locked in lending pools on the 12th of March, which coincides with the USDC de-peg. Concurrently, there was a decrease in the amount of stETH, WBTC, and USDT deposits in lending pools. This suggests that many USDC holders sought to de-risk their positions by borrowing against their holdings rather than selling them directly on the market (in the event of a complete collapse, borrowers would have no incentive to repay their loans). This allowed holders to minimize potential losses while transferring the risk to the other counterparty.
This, however, also means that the selling pressure on USDC during the period of the de-peg could've been much higher (resulting in a larger de-peg), had it not been for the availability of lending pools.
Therefore, while an increase in the amount of a particular token locked in lending pools may seem like increased adoption, a sudden spike can also be indicative of underlying issues such as liquidity problems or a lack of confidence in the market. This is because lending pools can be used to transfer risk between different market participants. As a result, it is crucial for market participants to closely monitor these trends during times of crisis.
Stablecoin performance since de-peg
The box plot chart presented below examines the performance of various stablecoins following the recovery of USDC's de-pegging (specifically from the 16th of March to the 20th of April). This analysis offers valuable insights into the price behavior and stability of the various assets during the specified time frame.
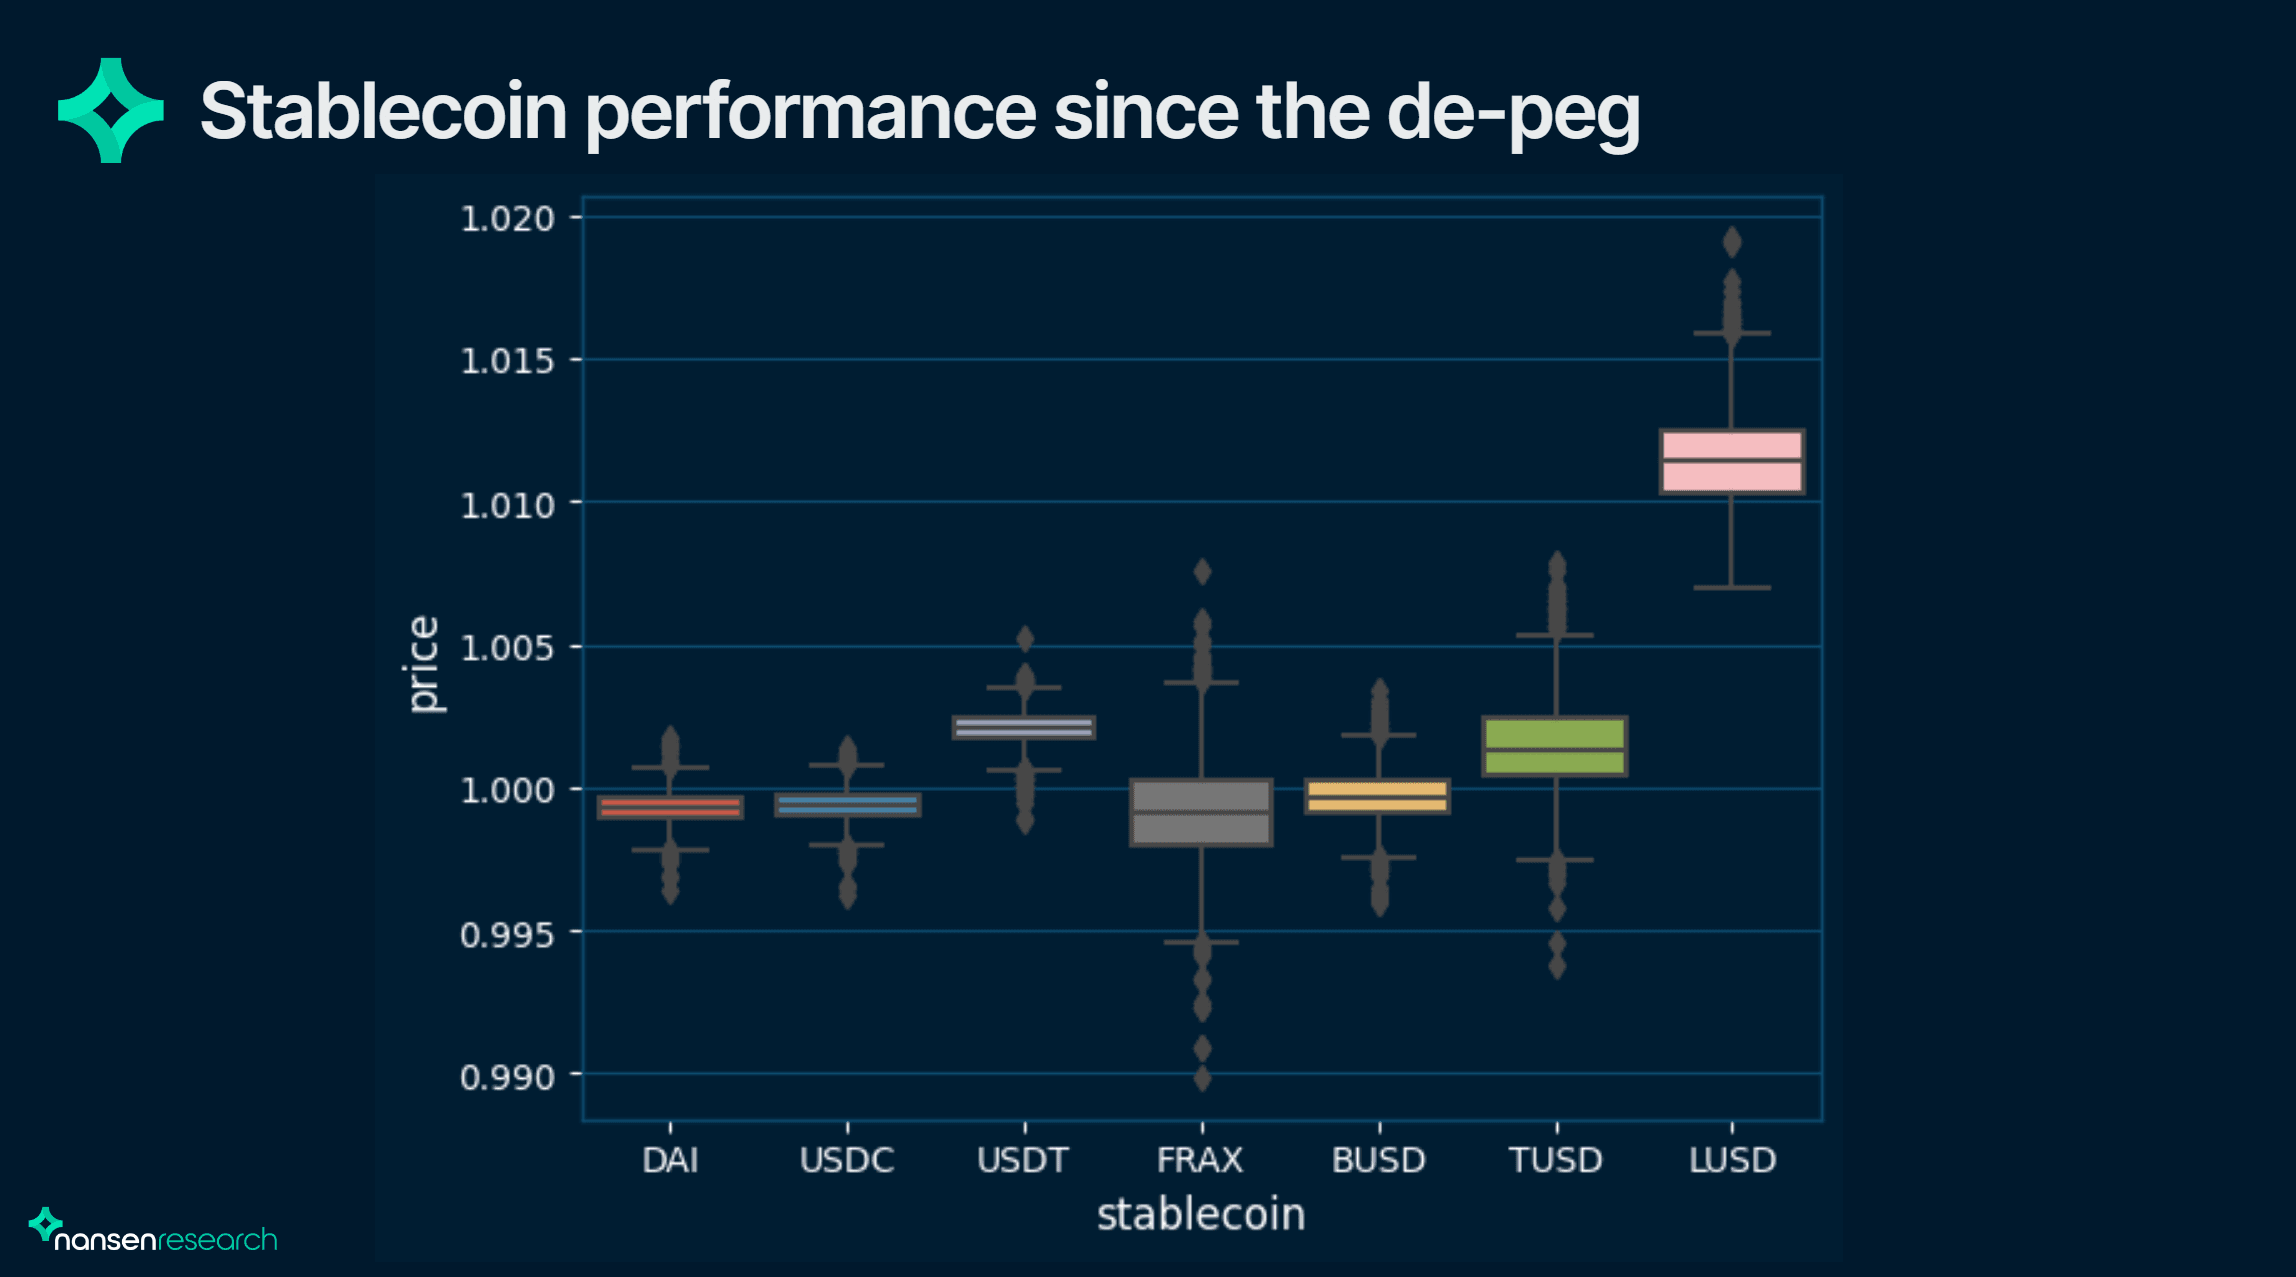
During the period observed, the median values for DAI, USDC, and FRAX consistently remained below the $1 mark. A noteworthy observation is a striking resemblance in price distribution patterns between USDC and DAI throughout this period, suggesting a strong correlation and synchronous movement between these two assets. This correlation was not limited to turbulent market conditions only (as observed in previous sections) but persisted even after USDC's recovery.
In contrast, USDT, TUSD, and LUSD exhibited a median value higher than $1 for the period under observation. Upon examining the price dynamics of BUSD, it becomes apparent that its median price is the nearest to the $1 mark among all other assets within the designated time frame.
LUSD's price behavior stood out when compared to the other assets. It not only achieved the highest minimum score, which surpassed the median scores of all other stablecoins but also registered the highest maximum score. This suggests a higher buying pressure, which led to a slight increase in its price. Throughout this period, LUSD maintained a median price of over 1.01, reflecting an almost 2% premium relative to USDC.
Regarding volatility, FRAX displayed the most pronounced fluctuations during the period under scrutiny, recording a minimum score of less than 0.990 and a maximum score of roughly 1.008. In contrast, DAI, USDC, and USDT exhibited the least variability in their pricing data following the de-pegging event.
An examination of the median values and price distribution reveals a clear distinction between stablecoins closely tied to USDC, such as DAI, and those without direct fiat exposure, like LUSD.
What is Smart Money Doing?
To understand what action Smart Money has taken as a whole, we analyzed the top stablecoins held by Smart Money. The chart below shows a breakdown of stablecoin assets held by Smart Money from the start of the year.

The graph illustrates that USDC remains the most dominant stablecoin held by Smart Money, with USDT trailing in second place and DAI occupying a distant third. There is a clear trend that can be seen which shows that Smart Money’s USDC exposure has been going down since January. This decline accelerated significantly around the 10th of March, as a result of the de-pegging event.
It is important to note however, that Smart Money’s % holdings in stablecoin has been going down from a high of around 37% recorded in November as shown in the chart below. This suggests that Smart Money has increasingly been more bullish in comaprison to last year where the overall trend was an increase in the percentage of stablecoins.

Looking at the Smart Money Holdings charts, it can be seen that USDT experienced an initial surge followed by a sharp reduction in the value held by Smart Money investors during the same de-pegging period. This implies that these investors adopted varying strategies in response to the de-pegging. While some early movers redirected funds into USDT (pushing SM USDT balance to a yearly peak) as they sought to mitigate USDC-associated risks, the subsequent drop suggests a significant departure from USDT by the same class of investors.
Over the past month, Smart Money wallets have been gradually increasing their USDT holdings, while USDC continues its downward trajectory. USDC, USDT, and DAI remain the dominant stablecoins in the portfolios of these investors. At the time of writing, the total holdings for the leading stablecoins are as follows: USDC ($388 million), USDT ($157 million), DAI ($52.9 million), USDP ($15.6 million), TUSD ($8.7 million), and BUSD ($7.8 million).
The stablecoin market has recently experienced significant fluctuations as a result of various factors like the banking crisis spillover as well as increased regulatory scrutiny.
The report highlighted that certain stablecoins are much more correlated to each other than others. USDC, DAI, and FRAX exhibit a high degree of correlation. If the objective is to maintain a diversified portfolio of stablecoins, there is minimal benefit in holding these particular assets at the same time. Additionally, holding USDC alone could be considered less risky, as it offers similar price movements without the additional exposure to smart contracts and protocol risks associated with projects that heavily utilize USDC. The correlation between DAI and USDC, in particular, remained closely synchronized even after recovery.
By looking at the number of tokens used across DeFi for the various assets, it was also determined that USDT has been the clear winner. It’s seeing its usage increase while both BUSD and USDC have been in decline. Smart Money wallets have also steadily increased their USDT holdings in the last month.
Additionally, it was observed that some users leveraged lending pools to mitigate risk during the USDC de-pegging event. This suggests that the selling pressure on USDC during the de-pegging could have been significantly higher, resulting in a larger de-peg, had it not been for the availability of lending pools.
In conclusion, it is clear that the stablecoin market was significantly impacted by the recent banking crisis spillover. Although USDC bore the brunt of the impact, the effects rapidly spread across the entire market, leading to a loss of value for many stablecoins (including those without fiat exposure). The stablecoin market continues to be dominated by fiat-backed stablecoins, posing substantial risks to the cryptocurrency space. In the event of a similar crisis, the stablecoin market remains vulnerable, as no significant changes have occurred since the previous incident.
The search for a truly decentralized stablecoin, independent of actions taken by centralized entities, is far from over. It will be interesting to see how the stablecoin market develops in the forthcoming cycles.