Introduction
It's undeniable that the NFT space offers lucrative opportunities. However, it's also possible to lose money. To maximize profits, it's essential to understand the market dynamics and know when to invest and when to exit, especially in uncertain and volatile conditions.
This report aims to provide on-chain tools to aid in timing NFT market bets. We explore possible on-chain indicators and predictive metrics for swings in the overall NFT market. Additionally, we examine connections between on-chain data and floor price movements.
The report is structured along the following steps:
- Establishing how we understand “the NFT market” and looking at floor price movement correlation within the top NFT collections
- Looking at the connection between the NFT and the overall crypto-market performance, especially BTC and ETH
- Picking out the most representative collections from the NFT market (analog to ETH and BTC for the crypto market) to use for case studies
- Case studies based on these collections regarding the most popular on-chain indicators
- Volume
- Owner structure
- Listing structure
Methodology
This section provides insight into the processes and techniques used to gather and analyze data. It aims to give a clear understanding of the steps taken to reach the results presented in this report. It also acknowledges any limitations or shortcomings in the methods employed. The purpose of this section is to give context and perspective on the results, and to ensure the validity and reliability of the findings.
Key considerations in this report include:
- Focus on on-chain data: While being fully aware that the NFT space is highly influenced by sentiments, socials, and narratives, this report focuses on on-chain data.
- Limitation to Ethereum: The analysis only considers NFT activity on the Ethereum blockchain.
- Emphasis on established collections: As this report uses collection floor price as the basis for "performance," it is putting an emphasis on established collections to ensure sufficient data points.
- ETH-denominated floor prices: The floor prices in this report are denominated in ETH. In addition to what is visible in the charts, the USD prices of NFTs are coupled with the ETH price.
A Quick Look at the NFT Market
NFTs and the overall crypto market
Nansen's NFT-500 Index (read more here) tracks the market activity of the top 500 NFT collections, weighted by market capitalization. It represents around 85% of the daily market volume, making it a good approximation for the NFT market performance as a whole.
Below, this index is compared to the two largest and arguably most representative crypto assets, Bitcoin (BTC) and Ethereum (ETH), in a normalized chart. Both are set to 1000 index points at the beginning of 2022.

As seen in the above chart, ETH and BTC prices are tightly coupled. They usually have simultaneous rallies and crashes, and even the smaller price movements are heavily correlated. When those two are compared to the NFT-500, it becomes evident that NFTs are not as tied to the overall crypto market.
Although NFTs usually follow the overall trend of the crypto market eventually in the long-term, in the mid-term they can do their own thing. When there is not much going on with crypto (i.e. ETH and BTC), NFTs can rally on their own and vice versa. The most prominent examples of this throughout 2022 were:
- Jan - Feb 2022: While the crypto markets continued trending down, the NFT market lived through a huge boom
- Feb - Mar 2022: Crypto markets continued to go sideways or even slightly upwards, while NFTs crashed from 1800 index points to just above 1200
- April - May 2022: Crypto markets trend down again after a short rally, but NFT markets hold up well
- May 2022: Also NFT markets could not escape the impact of the Terra collapse, they crash alongside crypto markets, although arguably harder
- Jul 2022: While crypto markets experienced another rough time with the 3AC and Celsius collapses, NFTs seemed to flourish and went on a short-lived rally
Correlation between NFT categories and collections
NFT collections don't always behave the same, but there is a correlation between them. At times, NFTs are "hot" and at other times, they aren't. While there are exceptions, following this trend has been a successful strategy for investing in the NFT space in the last year. Nansen’s NFT indices allow a closer look into the performance of the various NFT sectors and their correlation.

Social (orange) and Bluechip (yellow) tend to usually closely follow the NFT-500 (red), with Gaming, Metaverse and Art deviating from time to time but still following the overall trend.
This could be due to a combination of a few things:
- The NFT market (NFT-500), by market cap (5.49m ETH) is still dominated by Social NFTs (3.98m ETH) of which the Bluechips take the largest part (2.71m ETH)
- As the sector is still quite narrative-driven, depending on the current hot topics, some sectors can out- or underperform
- When looking at market trends, the Bluechip NFTs and within them the social category, are likely the ones to watch as they follow the NFT-500 most closely
Another factor to consider is that social bluechip collections, due to their strong funding and team, can adapt to trending narratives. For example, BAYC has evolved beyond a social PFP. The ecosystem now includes metaverse, art, and gaming, with the original collection regularly profiting from the other verticals through airdrops and other utilities.
Correlation between price performance of Bluechip NFTs
Following the previous logic, the report focuses on the social Bluechip NFT collections going forward. Now diving deeper into those and taking Nansen’s Bluechip-10 index as a baseline, these collections consist of:
The chart below shows that the floor prices of the collections were normalized so that their highest floor price during this time frame was set to 1. It is evident that the individual performances of the NFT collections are quite similar, especially during large price movements and overall trends. However, Crypto Punks (orange) is the longest-standing of those collections and somewhat of an outlier. Their floor price is less volatile, although the larger floor price movements still have very similar timing.

As the price movements of bluechip NFTs have been highly correlated, timing is not always identical between collections. This provides opportunities to profit from rotating between them. For example, during the last major NFT bull run, Azukis made a new all-time high while Mutant Ape Yacht Club crashed over 40%. This could be a sign that the party is over, at least temporarily. In recent times, movements have been increasing in tandem.

Closely monitoring the movements of the top social NFT collections can give you an edge. If you haven't invested in the first mover, you can take advantage of short-term swings by rotating between collections.
On-chain indicators
We'll use six social bluechip NFTs as case studies to examine several on-chain metrics and their potential to predict upcoming price movements.
Volume
The volume of Bluechip collections often experiences significant spikes when there are large price changes. However, it appears to be less useful as an indicator for the following reasons:
- Not leading: Large volume spikes usually happen simultaneously with big price changes, once you see the volume increase, the party is already in full swing. While it is still possible to profit from the momentum, it is impossible to catch the whole movement or properly prepare for it in advance.
- Ambiguous: Large volume can accompany up or down movements, it needs to be coupled with other indicators like general sentiment or market momentum to be useful.


The above charts visualize the floor prices vs volumes for the 6 bluechip collections mentioned earlier. In all cases, with the exception of Moonbirds, the volume is quite spiky with the spikes being simultaneous to large jumps in price - rather than being predictive. Furthermore, the spikes appear on large uptrends as well as large down-trends.
However, this does not mean that looking at volume is a complete waste of your time. According to the case studies, here is what to use volume for (and what not):
- What to use volume for:
- Very short-term trades, could be a sign that you should get in or out now
- For non-bluechip collections, low volumes can be a sign of low interest in the collection as a whole, often these collections are not going to make it
- Can be used as a proxy for estimating “liquidity” at a given point in time, if there is lots of volume you can likely sell or buy some NFTs of the collection without impacting the price too much or having to wait long for a buyer (although listing structure also plays a major role here)
- What not to use volume for:
- Not very useful as a forward-looking indicator for mid-term price developments (more than 1 day)
Owner Structure
Owner structure does not seem to yield much info into upcoming price movements as well. In fact, they seem to be barely changing at all for bluechips. Some reasons for this could include:
- High price per NFT: For these collections, the prices are relatively high per NFT, meaning a large concentration as seen in newly minted collections (people owning dozens to hundreds per wallet) is quite capital intensive. Also, with higher prices per NFT, fewer NFTs change hands for the same volume.
- Established collections: The Bluechip NFT collections have been around relatively long and each had their fair share of media coverage. This gave them a chance to change owners and perpetuate through the space, leading to over 70% of wallets owning only a single NFT for all collections.
Consequently, the average holder of Bluechip NFTs holds between 1 and 2 NFTs only, and there does not seem to be strong accumulation going on, rather than single NFTs switching hands between owners. This makes the owner structure interesting for estimating the stage an NFT project is in, but less insightful for predicting price swings in bluechip collections. The below charts visualize the owner structure of Bored Ape Yacht Club, which has been pretty stable throughout 2022.

The number of unique wallets (blue) and percentage of wallets / supply (green) does not change as much anymore, and appears to be ranging around 6k unique wallets, without large jumps.

As for the Smart Money distribution, the number of Smart Money traders (green) and Smart NFT Sweepers (gray) has been declining, with Early Adopters and Hodlers remaining relatively constant. This could be a sign for the maturity of the project, with less and less people actively trading it and more just holding out of conviction.

Furthermore, the average balance per wallet is not changing much either, and has seemingly found and equilibrium between 1 and 2 NFTs per wallet on average.
The charts for the other Bluechip collections look very similar in that regard, to dive in yourself please check out on Nansen:
- CryptoPunks Owner Structure
- Azuki Owner Structure
- MAYC Owner Structure
- Moonbirds Owner Structure
- CloneX Owner Structure
Looking at the ownership structure of a collection of stocks can still be useful, even if they are not blue-chip. However, it must be used correctly to be effective.
- What to use owner structure for:
- Estimate “maturity” of an NFT collection, more mature collections tend to have fewer NFTs per wallet and the owner structure is not as fluctuating anymore
- Specifically looking into single prominent holders for newer collections can be a good predictor of future success, to the point of a self-fulfilling prophecy (influencers are more likely to promote collections they hold themselves)
- What not to use owner structure for:
- Not very useful for established and bluechip collections as the owner structure is pretty stable at that point, looking at specific wallets you track anyways can still be worthwhile though
Listing Structure
Finally, the listing structure appears to provide insight not into what people are currently buying NFTs for, but rather into what holders believe their NFTs may be worth in the near future. Interestingly, the data suggests that this perceived value acts as a counter-indicator for bluechip collections and, by extension, the NFT market as a whole.
- Many listings close to floor price: People are happy to sell their bluechips close to the minimum price that is currently typical on the market. The NFT market is usually in a cooling phase, with fear being the dominant sentiment. Historically, this tended to be (close to) a good time to buy.
- Very few listings close to floor price: People are reluctant to sell at current prices and expect the floor price to generally trend upwards. This is a good indicator of greed in the market, with peak greed usually preceding larger crashes. This heated stage of the NFT market has historically been (close to) a good time to sell or at least reevaluate your position.
In this report listings near floor price are defined as listings within 15% of the floor price.
It has to be noted, that the above statements regarding historical buying and selling performance are geared toward mid to long-term holdings. It is more representative of the general NFT market or long-term holds. More short-lived collections might temporarily flourish during phases of extreme greed and never really get traction during phases of fear.
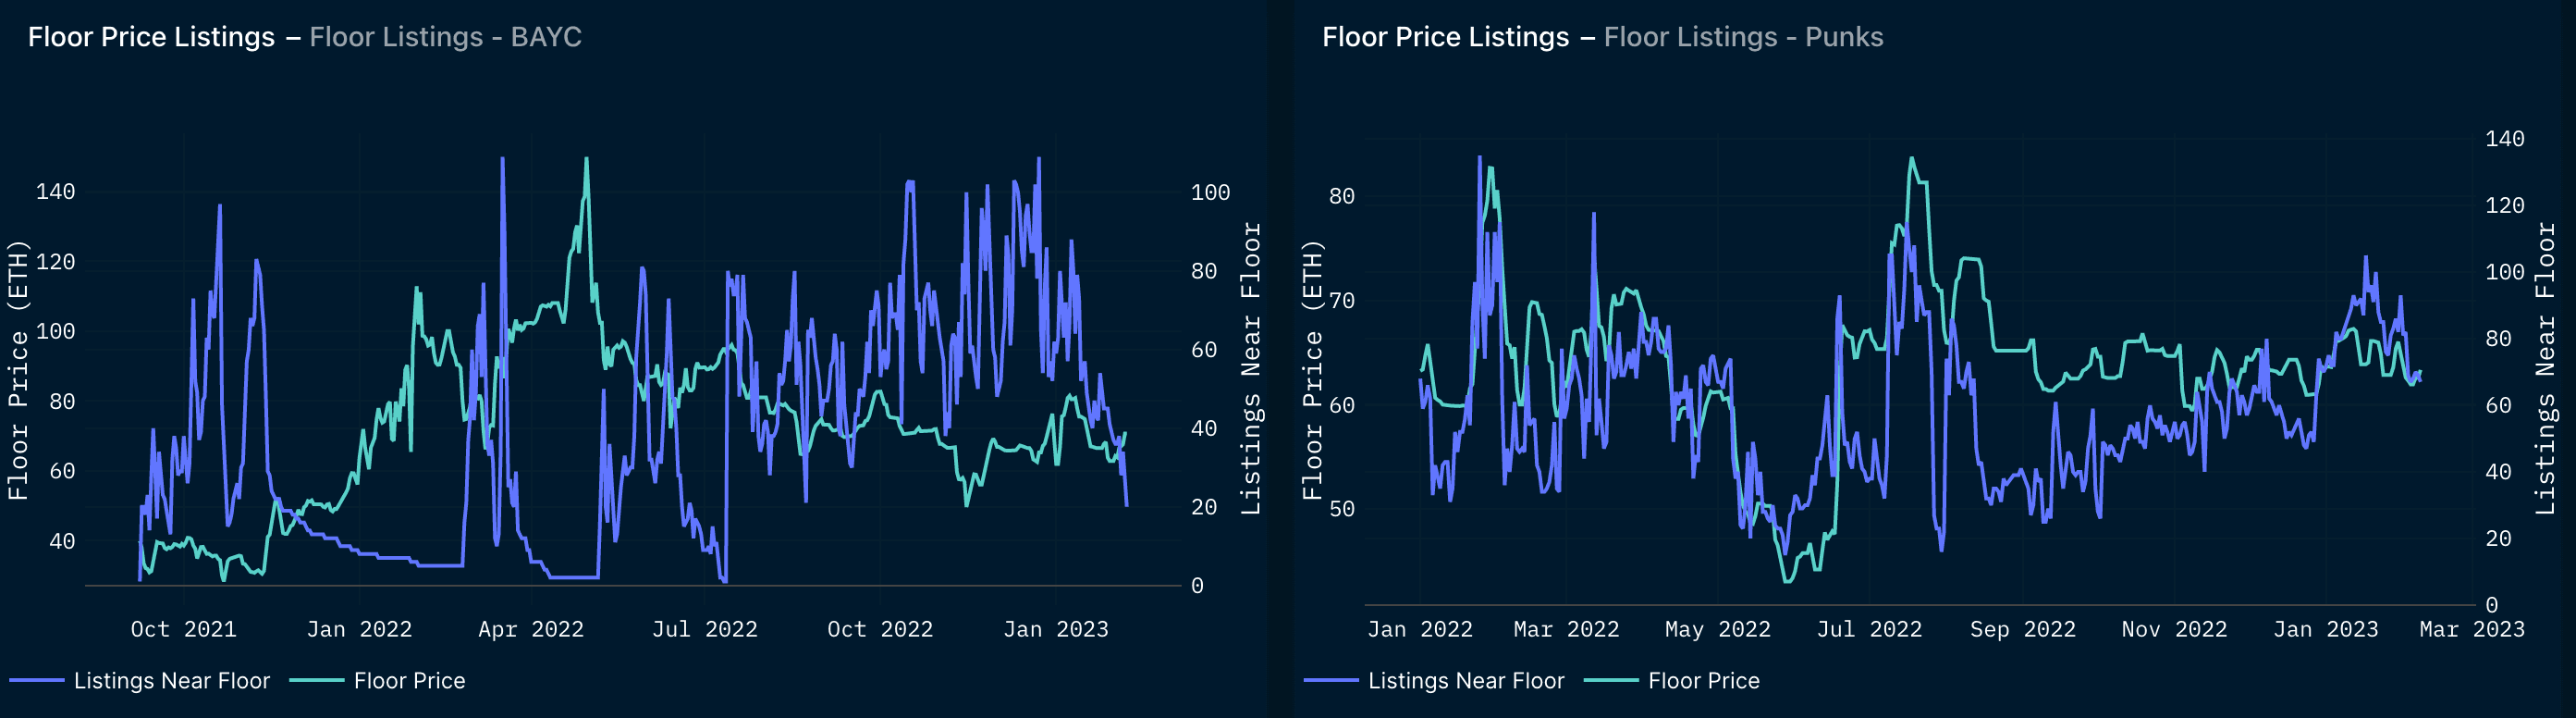
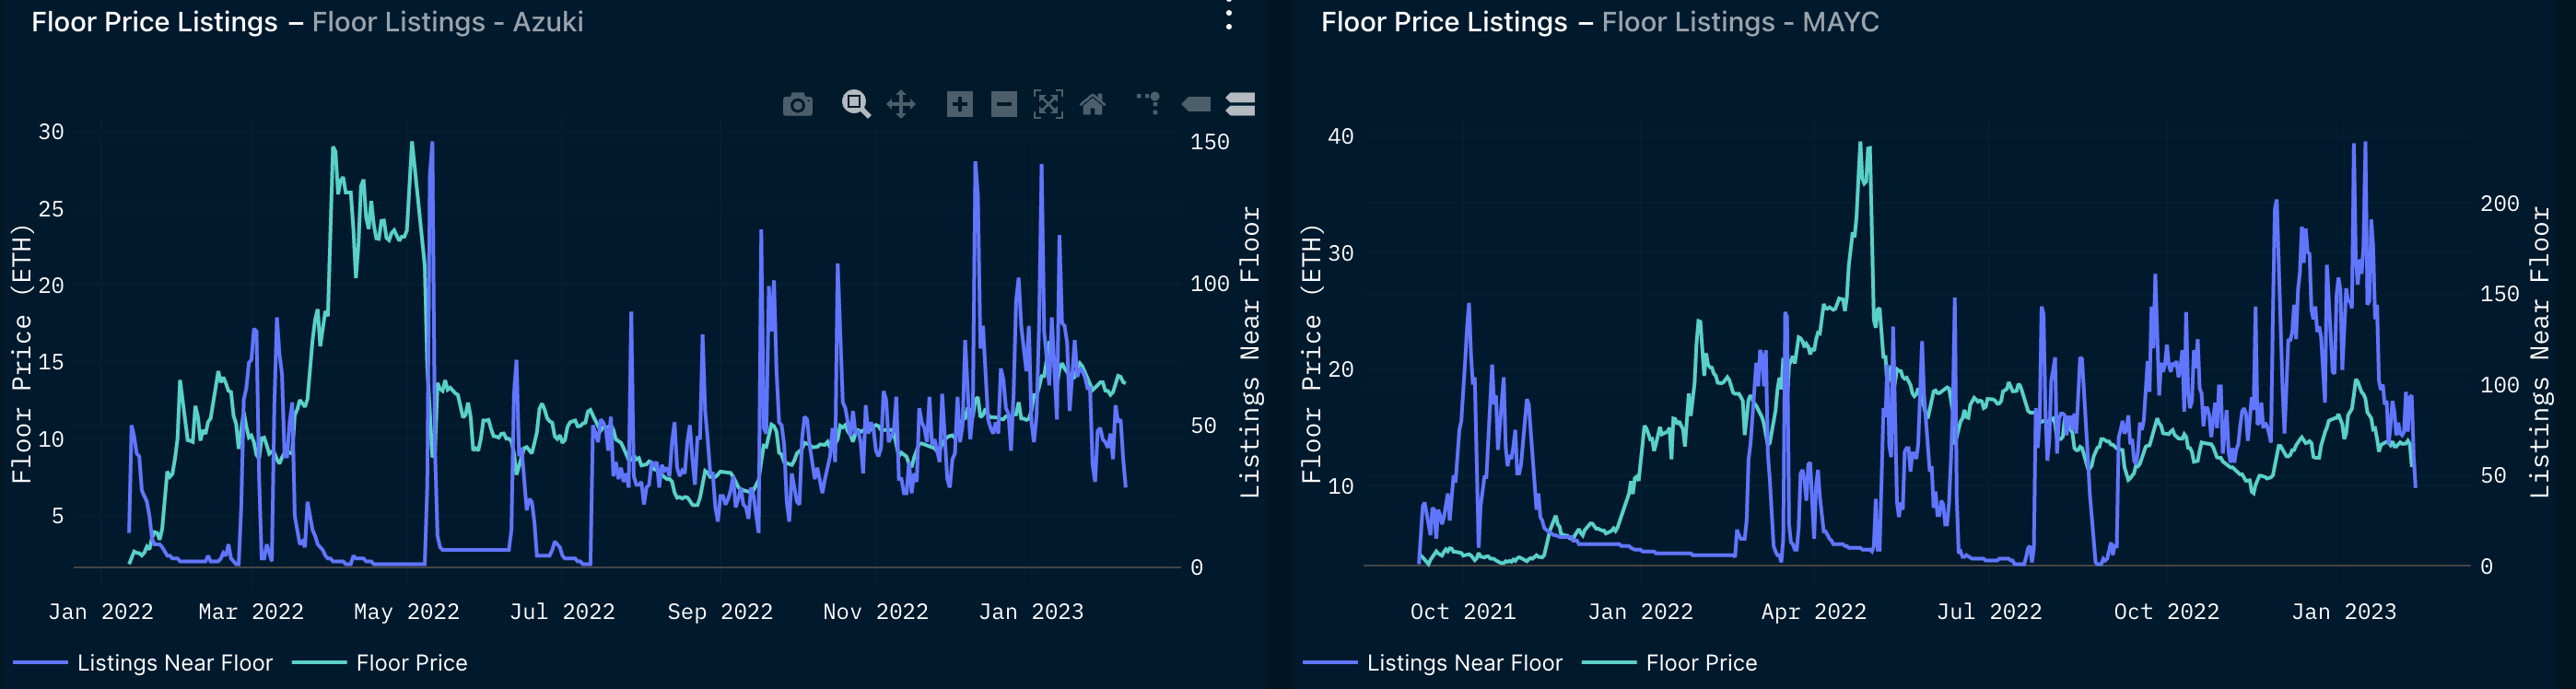
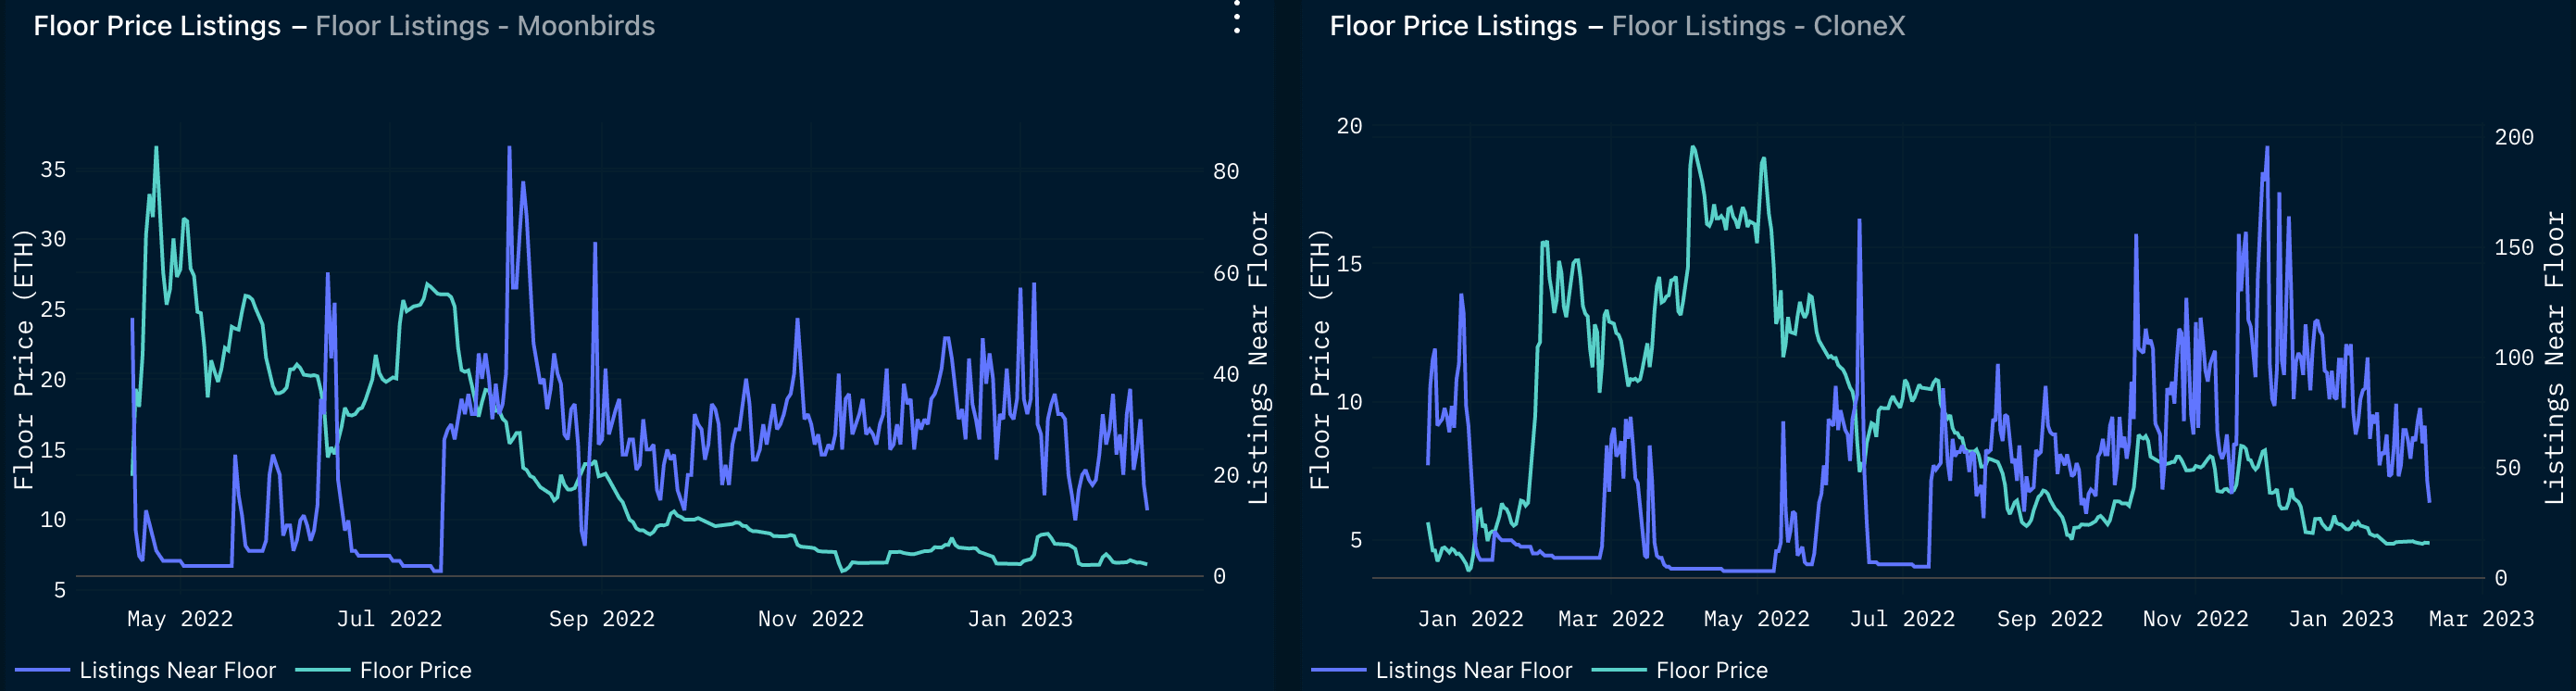
Taking a closer look at the case studies, CryptoPunks again have a slightly different behavior than the rest. The number of listings close to the floor for CryptoPunks seems to almost track floor price movements. This could be due to them being among the oldest NFT collections and also their floor prices not tracking the overall NFT market too closely as discussed previously. Additionally, the listings near the floor never reach an extremely low point and are always above 23.
As for the other collections, when floor prices reached a local top, the number of listings near floor prices where extremely low, in the lower single digits, for prolonged periods of time. Especially in the first 9 months of 2022 this has been a great indicator for NFT market swings.
In the past few months, as the moves of the NFT market have been less violent, this indicator seems to be not performing as well. For gradual price changes coupled with less extreme sentiments, the listing structure appears more ambiguous.
Overall, the listing structure turns out to be a surprisingly good indicator for future floor price movements, especially larger crashes. However, it is obviously not potent enough to base your entire trading on that, so it is important to understand how to best use this information. According to our case studies:
- What to use the listing structure for:
- Use the number of listings near the floor price for bluechip collections to get a feeling for the general greed or fear within the NFT market
- Use this in conjunction with other metrics to reevaluate your mid to long-term positioning within the NFT market
- Use it to get a feeling for violent crashes off very high tops
- What not to use the listing structure for:
- Do not blindly use this indicator alone to make investment decisions, as in the case studies it could take a few days to reach the top
- Do not use it quantitatively, the indicator did not have specific thresholds but serves best as a purely qualitative means of gauging sentiment
- It is not great at predicting gradual price changes or slow trends
If you see very low numbers (low single digits) of NFTs listed close to floor price for various social bluechip collections, this has historically been a sign of an impending crash of the NFT market.
You can track this metric in the Nansen NFT God Mode in the “Listings” tab.
The NFT market can move independently from the overall crypto market (i.e. ETH and BTC). So it is indeed possible to make a lot of money with NFTs even in a crypto bear market - or to lose a lot of money in a crypto bull market.
Because of that, it is important to look for independent NFT indicators to determine which part of the NFT market cycle you are in. As for crypto with ETH and BTC, for NFTs just looking at a couple of social Bluechip collections can reveal much of that information.
The case studies of these collections have revealed, that of the most used on-chain NFT metrics, volume is not forward-looking enough, and owner structure is pretty stable for established collections. However, the listing structure can reveal some information about the state of the market, especially the sentiment and greed of holders.
If social Bluechip collections (with the exception of Crypto Punks which have been an outlier in most of the examples) reach a point where there are extremely few (single digits) listings near floor price (within 15%), this has historically been a sign of a very heated market.
This low number of listings near floor price can be seen as speculation on continuously rising prices and is usually followed by a steep crash shortly after. This works less reliably for slow price changes.
If you are the NFT market is feeling “toppy”, a look at Nansen’s Listing dashboard can give the additional nudge in the right direction to make the correct investment decision.