TLDR
- Significant profits for the Top 15 collections in the last 3 months were typically made in the first 7 days.
- From February to May, the results trend towards it being profitable to mint as a higher percentage of projects have floor prices above mint cost. Similarly, a lesser percentage of projects are being marked as ‘dead’, which may signal greater interest in the overall NFT markets.
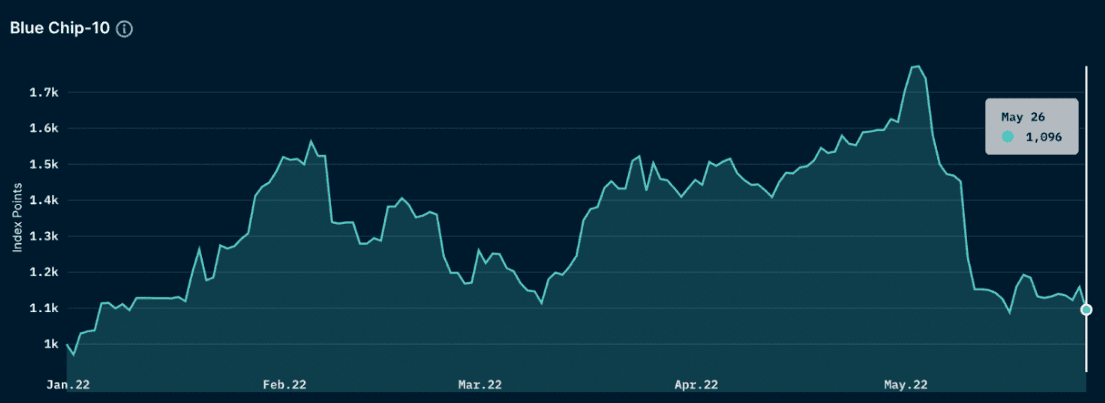
- According to the NFT-500 Index from Nansen, the Blue-Chip-10 Index is showing signs of significant decline and sell-off, compared to early April to May this year. On a YTD basis, there is a current +9.56% increase in ETH value, and a -49% decrease in USD value.
- By querying on-chain data from smart money activities related to NFTs, we were able to sort the Top 20 collections by unique smart money wallets. ENS domains, MAYC, Meebits, and BAYC, registered the most amount of smart money holders in the NFT space. Despite that, ENS has one of the lowest smart money dominance in the list at 0.53%, with Parallel being the only collection with a lower dominance percentage of 0.27%.
Introduction
Case study
This report aims to analyze whether there are specific strategies for profiting off NFT collections. The NFT market is still at a nascent stage which can explain the volatility in market cap and floor prices.
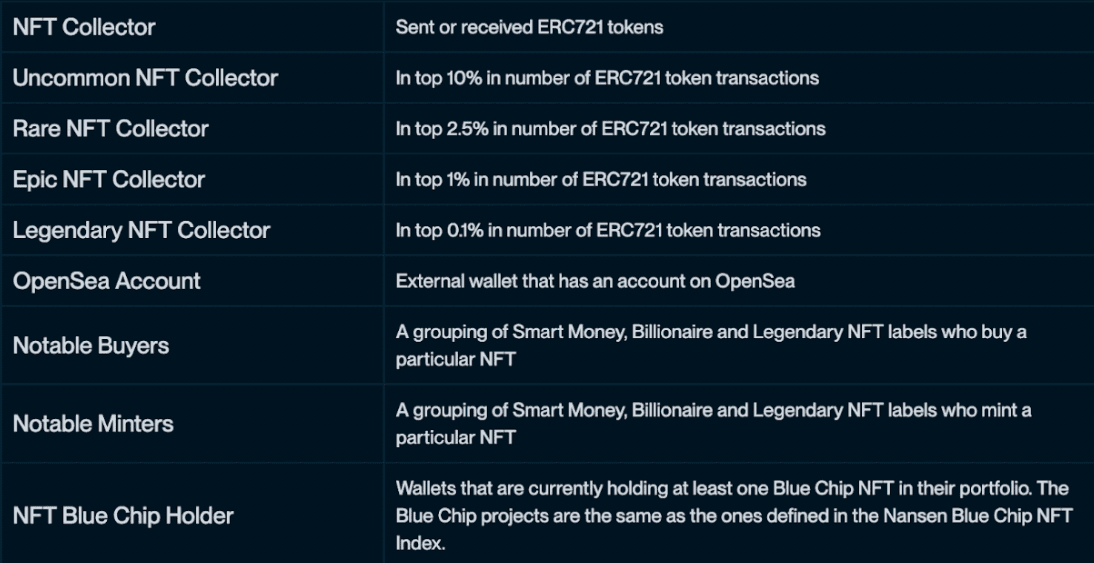
We analyzed collections that were deployed in the last 3 months to prevent data from being skewed by older, more established, blue-chip collections - shifting our focus on current metas and future narratives. Throughout the report, we will be addressing specific wallet addresses, which is key in Nansen’s product suite:
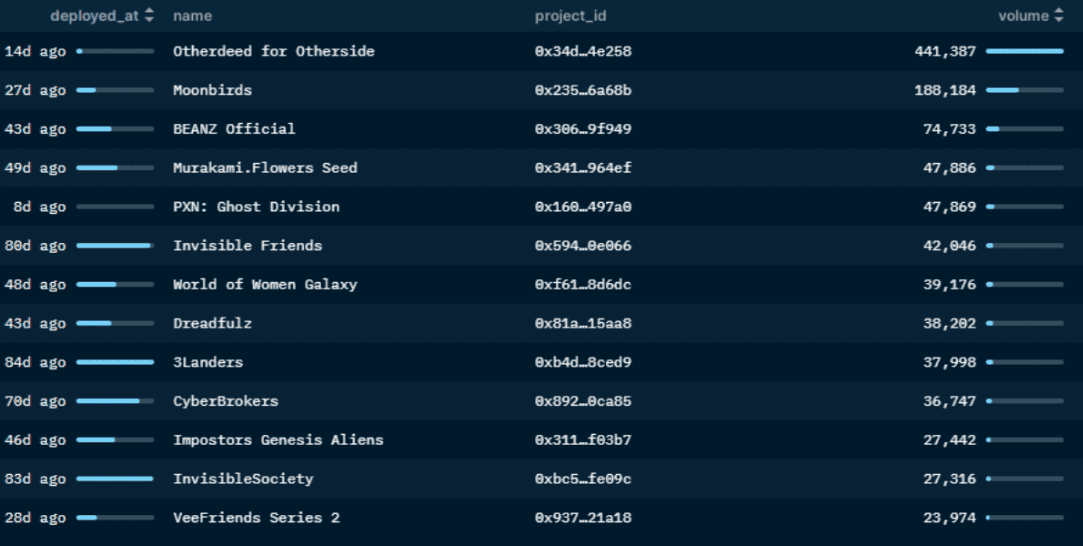
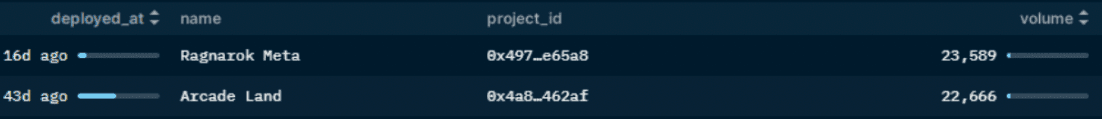
Top 15 collections by volume that were launched in the last 90 days
Categories
| Name of Collection | Category |
|---|---|
| Otherdeed for Otherside | Metaverse Land |
| Moonbirds | Membership/Social PFP |
| BEANZ Official | Social PFP |
| Murakami.Flowers Seed | Social PFP |
| PXN: Ghost Division | Membership/Social PFP |
| Invisible Friends | Animated Character PFP |
| World of Women Galaxy | Social PFP |
| Dreadfulz | Social PFP |
| 3Landers | Social PFP |
| CyberBrokers | Social PFP |
| Imposters Genesis Aliens | Metaverse PFP |
| Invisible Society | Social PFP |
| VeeFriends Series 2 | Social PFP/Metaverse |
| Ragnarok Meta | Social PFP/Metaverse |
| Arcade Land | Metaverse Land |
Table 1: NFT collection categories
Changes in Floor Price and ROI
Special note:
- Data on current floor prices were extracted on May 25th, 2022
- YTD ROI refers to the percentage change in ROI of current floor price - the mint price/ mint price * 100
- We did not manage to extract data from 3 collections out of the Top 15 collections
- We have counted BEANZ Official out of the analysis as it was airdropped to Azuki holders
- We refer to the floor prices in ETH value

Table 2: NFT floor price post-mint + ROI
Main Findings
- Significant profits for most collections were made in the first ~7 days
Assuming that most NFT collections are revealed within the first week, we found that it was generally more profitable for users to flip their NFTs within the first 7 day range. Our dataset focused primarily on collections that were deployed in the last 3 months to ensure relevancy in the current NFT market condition, and a major proportion of the NFT collections faced a drawdown in floor prices, especially after the ~7 days, with floor prices dwindling 20-30% within the ~21 day range.
- Analysis on ROI (in conjunction with mint prices)
For the Top 15 collections in our dataset for collections that were deployed in the last 3 months, most collections above had a positive ROI, with a significantly higher proportion in the first 7 days. In simple terms, for holders who managed to mint the above NFT collections and flipped during the first 7-day interval, it was generally the most profitable time period.
- Collections with higher market-cap valuation tend to have stable floor prices (within the 7, 14, and 21-day range) with no significant volatility and drawdown

PROOF Collective Current ETH Value of Set (ETH)
| Collection | Floor | Floor (ATH) |
|---|---|---|
| Proof Collective | 82.5 | 139 |
| Emotes by Heart You | 0.75 | 0.8 |
| Proof Collective Grails | 1.483 | 1.5 |
| Proof Moonbirds | 23.5 | 38 |
| Moonbirds Oddities | 3.03 | 4.1 |
| Total | 111.263 | 183.24 |
Table 3: Proof Collective current floor price & ATH floor price (as of May 29, 2022)
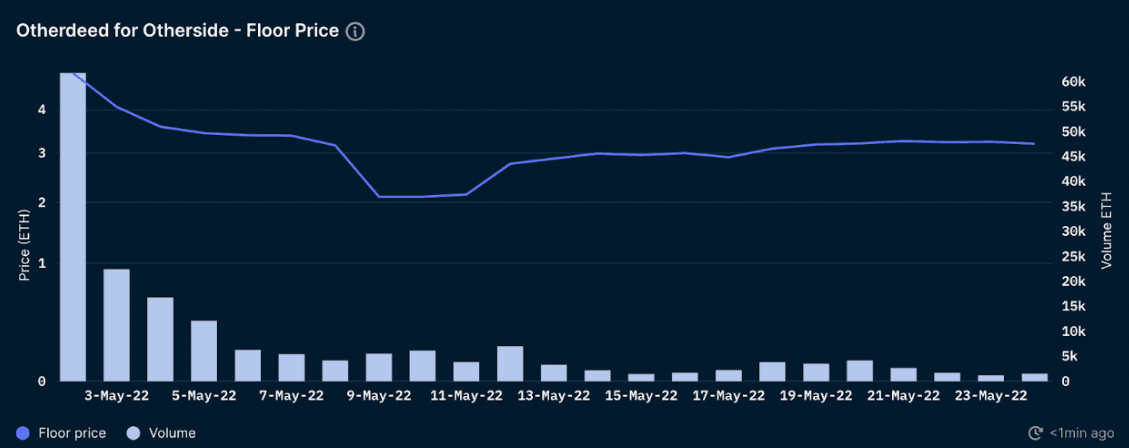
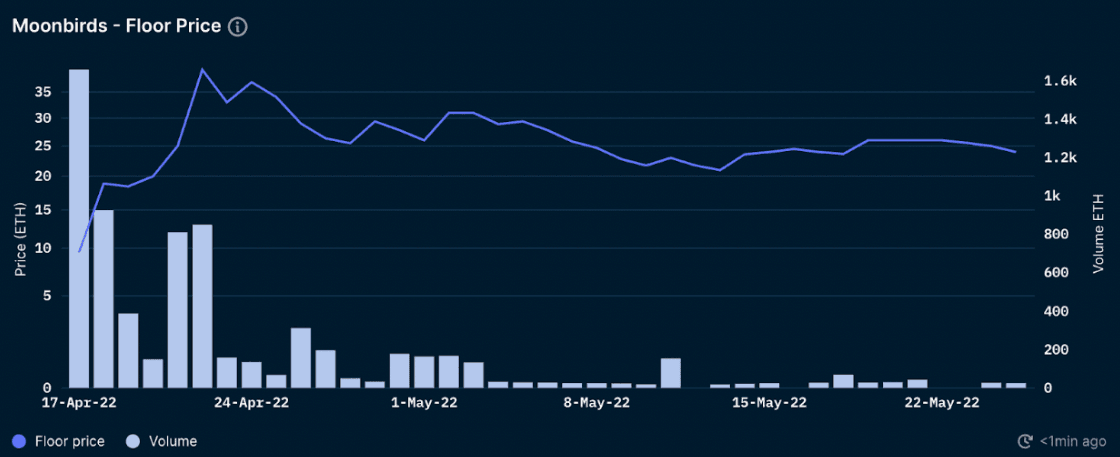
There were some outliers in the data, specifically Otherdeed for Otherside and Moonbirds
These collections generally defied the “flip-before-reveal” strategy. One main observation from these collections is that holders have strong conviction in the team and these projects are secondary collections in conjunction with the genesis collections (PROOF for Moonbirds and Bored Ape Yacht Club for Otherdeed for Otherside).
Argument #1: Although WoW Galaxy is a notable collection in itself, as it was deployed by the World of Women team, the floor price experienced a massive decline after the first ~7 days, with low daily volume traded and liquidity drying up in the collection.
Possible reasoning: WoW Galaxy is World of Women (WoW)’s second collection. Although PROOF and Otherdeed for Otherside are also secondary collections in conjunction with their genesis collections, they provided free airdrops for holders. WoW Galaxy, however, had additional minting fees for WoW holders.

Minting vs. Buying on Secondary
In this section, we will be comparing the profitability of minting vs. buying on secondary markets post-launch.
Note: This dataset is spread across all NFT collections minted since February.
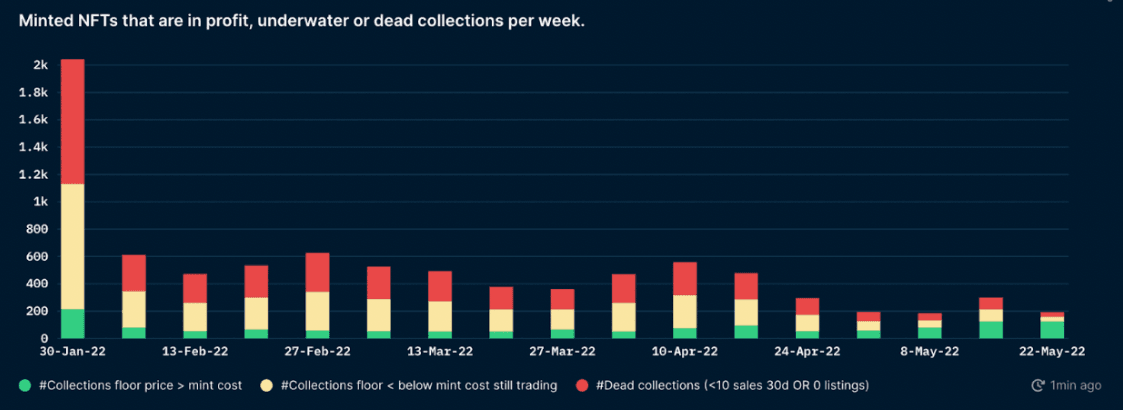
For minting, we carried out an analysis on all NFT collections minted in the past few months. ‘Dead’ collections were defined as collections with less than 10 sales in the last 30 days or 0 listings on the secondary market. Collections that do not fulfill these criteria will be defined as collections that are ‘still trading’, presumably active collections with some level of liquidity.
Overall, we see that an estimated 50% of all collections are categorized as ‘dead’ while among those categorized as ‘still trading’, 70% of them have floor prices below mint cost. From February to May, the results trend towards it being profitable to mint as a higher percentage of projects have floor prices above mint cost. At the same time, a lesser percentage of projects are being marked as ‘dead’, which may signal greater interest in the overall NFT markets.
For secondary markets, an analysis was carried out on the Top 15 collections as mentioned above. The buying price on secondary markets is calculated as the average of the first 500 sales for each collection on marketplaces.
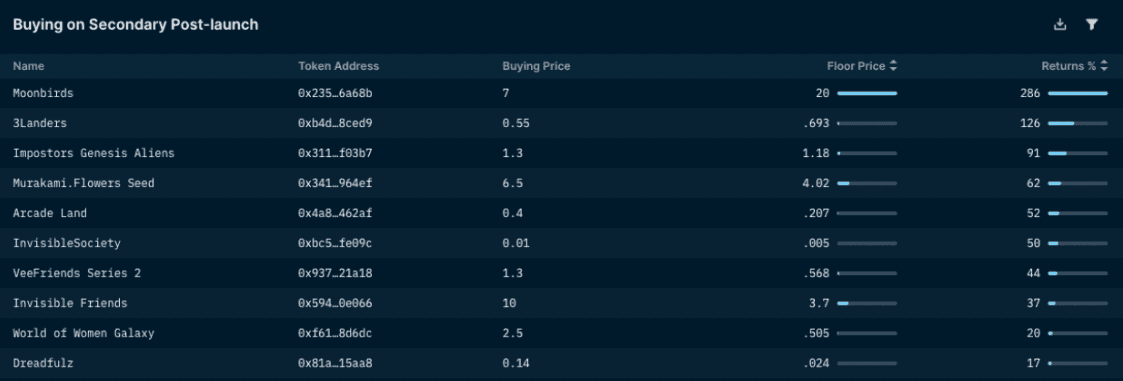
From the data shown, we can gather that it is not very profitable to buy on secondary, especially when the project has just launched. The floor prices of 8 out of 10 projects have fallen below their “buying price”, indicating that the average buyer would have made a loss if they bought on secondary after launch.
Interestingly, projects that have held up well have similar attributes in terms of free airdrops for their holders - such as Moonbirds and 3Landers. In contrast, projects that require additional fees for minting a second collection could decrease the value of both collections. An example of this would be World of Women (WoW) and its second collection WoW Galaxy - whereby both collections have faced more than a 50% drawdown in prices from their peak in April.
Another insight is that projects with a reveal event after mint will most likely not be profitable to buy on secondary. Projects like Veefriends Series 2 and Invisible Friends faced a similar trajectory following the reveal event and never truly recovered from it despite initial hype for the projects.
Overall, it would be hard to have a clear answer as to whether minting or buying secondary is more profitable. There are many aspects that affect NFT prices - such as macro environment and social activity, which are hard to quantify to analyze correlation. Despite this, we can look at past trends and use them to help in deciphering risks when deciding whether to invest in any NFT collections.
How are blue-chip collections holding up?
According to the NFT-500 Index from Nansen, the Blue-Chip-10 Index is showing signs of significant decline and sell-off, compared to early April to May this year. On a YTD basis, there is a current +9.56% increase in ETH value, and a -49% decrease in USD value.
Note: The indexes are weighted according to the NFT collection’s market capitalization, which we have calculated using an adjusted 7-day mode price method. Read more on the NFT Index methodology here.
Drilling further into the Top 10 collections in our Blue Chip-10 index, all collections are experiencing a decline in floor prices, especially seen in the 30D time interval. Some of the main collections experiencing more than a 50% decline in the last 30D are Mutant Ape Yacht Club, Azuki, and NFT Worlds. BAYC is still leading in terms of market cap. However, Sandbox LAND is the only collection on the Blue Chip-10 index activity with a positive floor price movement of +0.86% in the last 30D.

In terms of genesis blue-chip collections with airdrop opportunities for holders, we found that BAYC’s collection performed comparatively better than other collections with similar airdrop opportunities. Airdrops are tricky - in a way that it benefits holders instead of bringing in new users into a collection’s existing ecosystem. Arguably, BAYC defied the usual standard of airdrops diluting the entire collections’ long-term value. Based on the chart below, the value of OG token and airdrop is increasing over time.

Strategies on Selling Pre-Reveal
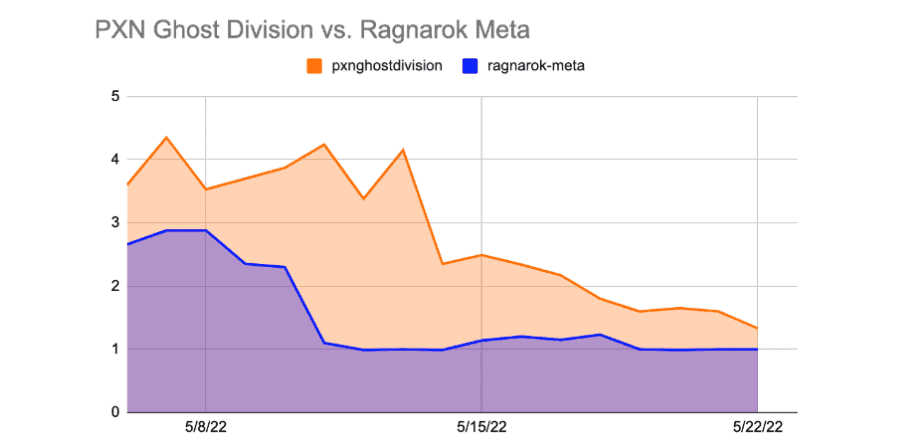
Case Study #1: Ragnarok Meta and PXN Ghost Division
Given the recent example of some collections that generated plenty of hype in the last month, Ragnarok Meta and PXN Ghost Division are two key collections where the data showed a similar pump-and-dump tactic.
Let’s observe the price movements on-chain and how users can use Nansen’s tools to front-run the drawdown in prices. We can see that smart money listings were rampant from May 11-14, 2022. We can observe that during the days leading up to the reveal date, there were little-to-no smart money listings below 2 ETH, however, right as the reveal was initiated, smart money addresses were listing at the prices of .6 to 5 ETH. If you click on the smart money listings, you can note down the exact addresses and set up smart alerts for those addresses.

Using the 'New Listings and Sales' feature on Nansen, we also noticed a sudden spike of listings on May 10, 2022.

Comparatively, we can draw connections between the increase in new listings and sales on May 10, 2022 and the sudden drawdown in floor prices from ~2.5+ ETH to ~1.1 ETH on May 11, 2022.
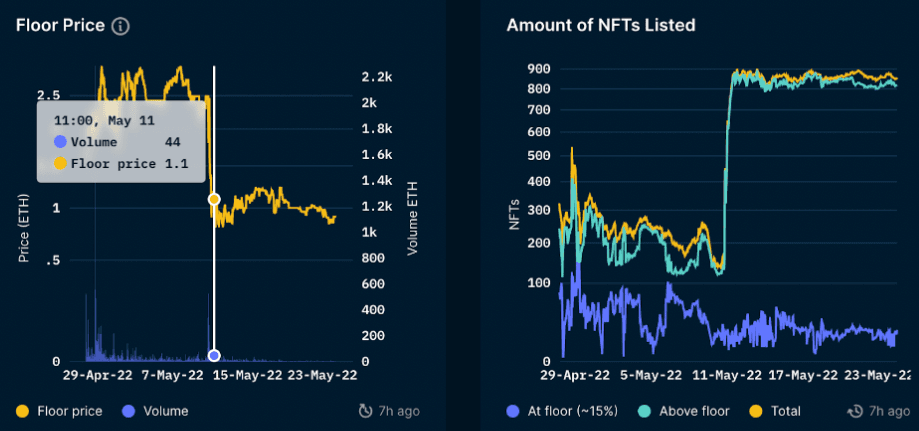
Drawing connections from PXN Ghost Division and Ragnarok Meta’s NFT collection, we see a similar floor price movement.
Top Projects Held by Smart Money

Table 4: Top projects held by smart money & related data
By querying on-chain data from smart money activities related to NFTs, we were able to sort the Top 20 collections by unique smart money wallets. ENS domains, MAYC, Meebits, and BAYC, registered the most amount of smart money holders in the NFT space. Despite that, ENS has one of the lowest smart money dominance in the list at 0.53%, with Parallel being the only collection with a lower dominance percentage of 0.27%.
Next, we can assess the significance of the smart money dominance percentage within a collection and the average value per smart money in ETH. Generally, collections with more smart money presence also correspond to a higher average ETH holding in their wallets. For example, Meebits and Punks smart money holders are estimated to have 1024.44 and 502.61 ETH in their wallets, respectively. On the other hand, at 0.53% dominance, ENS also has, by far, the lowest average ETH per smart money wallet at 0.067 ETH each.
| Collection | Jan 1 Floor Price/Inception Floor Price | Current Floor Price | YTD ROI Performance |
|---|---|---|---|
| Ethereum Name Service (ENS) | 0.0148 | 0.0029 | -80.41% |
| Mutant Ape Yacht Club | 14.90 | 19.69 | 32.15% |
| Meebits | 3.97 | 4.40 | 10.83% |
| Bored Ape Yacht Club | 69.99 | 91 | 30.02% |
| Adidas: Metaverse | 0.9 | 1.2 | 33.33% |
| Bored Ape Kennel Club | 5.95 | 7.3 | 22.69% |
| CryptoPunks | 63.86 | 47.6 | -25.46% |
| Cool Cats | 10.75 | 3.18 | -70.42% |
| Cool Pets | 2.8 (Feb 1 Airdrop) | 0.385 | -86.25% |
| Bored Ape Chemistry Club | 16.20 | 40.3 | 148.77% |
| Parallel | 0.011 | 0.002 | -81.82% |
| CryptoJankyz | 0.1 | 0.1 | 0.00% |
| Sandbox's ASSETS | 0.0104 | 0.0032 | -69.23% |
| Cryptoadz | 4.2 | 2.20 | -47.62% |
| Azuki | 1.6 | 12.49 | 680.63% |
| Doodles | 8.59 | 11.85 | 37.95% |
| Tubby Cats | 0.1 (Feb 24 mint) | 0.15 | 50% |
| Chromie Squiggle | 5.97 | 5.9 | -1.17% |
| MetaHero Universe: Planet Tokens | 0.29 | 0.098 | -66.21% |
| Moonbirds | 2.5 (April 17 mint) | 24 | 860% |
Table 5: Top projects held by smart money YTD ROI
Smart money dominance, evaluated in isolation, does not affect the ROI performance of a particular collection, even though it somewhat correlates to average ETH holdings. The collections with some of the highest smart money dominance, such as Sandbox’s ASSETs, Chromie Squiggle, and CryptoPunks, are all down since the start of the year. We measured smart money dominance rather than the number of unique smart money wallets because each collection is of different sizes. The smart money dominance ratio gives us the smart money presence in relative terms rather than absolute terms, making it a better indicator for comparison.
In contrast, there is a correlation between the average ETH per smart money wallet and the YTD returns. The best-performing projects this year usually have the most average ETH per smart holder on the list. In addition, most of the positive-ROI collections YTD are social PFP/Avatar projects. Specifically, MAYC, BAYC, BAKC, Meebits, Azuki, Doodles, Azuki, and Moonbirds all recorded an increase in floor price since January 1.
There are numerous mid-cap NFTs with significant unique smart money addresses and low ETH count in their wallets. However, referring to Table 5, most of these collections remain underwater since the start of the year, with Adidas: Metaverse and Tubby Cats being the only exceptions. This observation indicates some degree of importance to the average ETH per smart money wallet for a particular collection.
Upon analyzing the connections between various data points and factors, average ETH value per wallet and the type of NFT are the most significant determinants for positive returns, followed by smart money dominance. The fundamental value proposition is also crucial to the price action, but it cannot be measured quantitatively. Although Moonbirds and Azuki have a low smart money presence, their average ETH holdings and identification as PFP collections contribute heavily to the positive price action. While smart money presence correlates to the average ETH in each smart money wallet, only those also categorized as PFP/Avatar projects recorded gains YTD, signifying that the current meta still lies within this category of NFTs. The only outlier from this theory is CryptoPunks, which is currently sitting at a 25.46% loss YTD.
Main Takeaways
- The NFT market is still at a nascent stage. This can help explain the volatility in floor prices and market cap at this stage in the market.
- Blue Chip-10 Index is showing signs of significant decline and sell-off, compared to early April to May this year. A philosophical question/ takeaway from this report would be understanding the term blue-chip and what constitutes a blue-chip collection. After all, BAYC was officially launched only a year ago and is now considered one of the most renowned NFT collections in the space. The Nansen team will continue to explore this philosophical debate and identify new trends and phenomena in the NFT space.
- The average lifecycle of an NFT collection is typically subjected to volatility. A few factors that can affect the lifecycle of an NFT collection are such: how much conviction does the average holders of the collections have in the team? Is the team 100% transparent on their background and past (e.g: recent Azuki debacle)? Is this collection merely a pump-and-dump tactic?
- Overall, we see that an estimated 50% of all collections are categorized as ‘dead’ while among those categorized as ‘still trading’, 70% of them have floor prices below mint cost. From February to May, the results trend towards it being profitable to mint as a higher percentage of projects have floor prices above mint cost. At the same time, a lesser percentage of projects are being marked as ‘dead’, which may signal greater interest in the overall NFT markets.
- Assuming that most NFT collections are revealed within the first week, we found that it was generally more profitable for users to flip their NFTs within the first 7 day range. Our dataset focused primarily on collections that were deployed in the last 3 months to ensure relevancy in the current NFT market condition, and a major proportion of the NFT collections faced a drawdown in floor prices, especially after the ~7 days, with floor prices dwindling 20-30% within the ~21 day range.