Introduction
NFT projects can be assessed using both fundamental analysis and technical or data analysis. Fundamental analysis for NFT projects primarily includes:
- The team, advisors, and community
- Utility of the NFTs/value accrual for token holders
- Project's vision
- Aesthetics (highly subjective)
- And more
However, belief and conviction in these qualitative metrics alone are insufficient to ensure profitability as NFTs are highly risky and subject to volatile price swings. Evaluating on-chain data and various quantitative metrics can serve as support for the fundamentals.
On a high level, some of these quantitative metrics, which are available on Nansen's NFT God Mode, are:
- Volume
- Floor price
- Unique holder and distribution
- Listing percentage and distribution
- Recent sales
- Average holding time
- And more
While these numbers provide insight into the underlying data, we can utilize Nansen's database of Smart Money addresses as a metric to dive even deeper when conducting research. This report aims to provide a structured workflow for analyzing Smart Money data and activity for any NFT project. We will be using Pudgy Penguins as an example for this guideline.
Workflow
Smart Money Activity
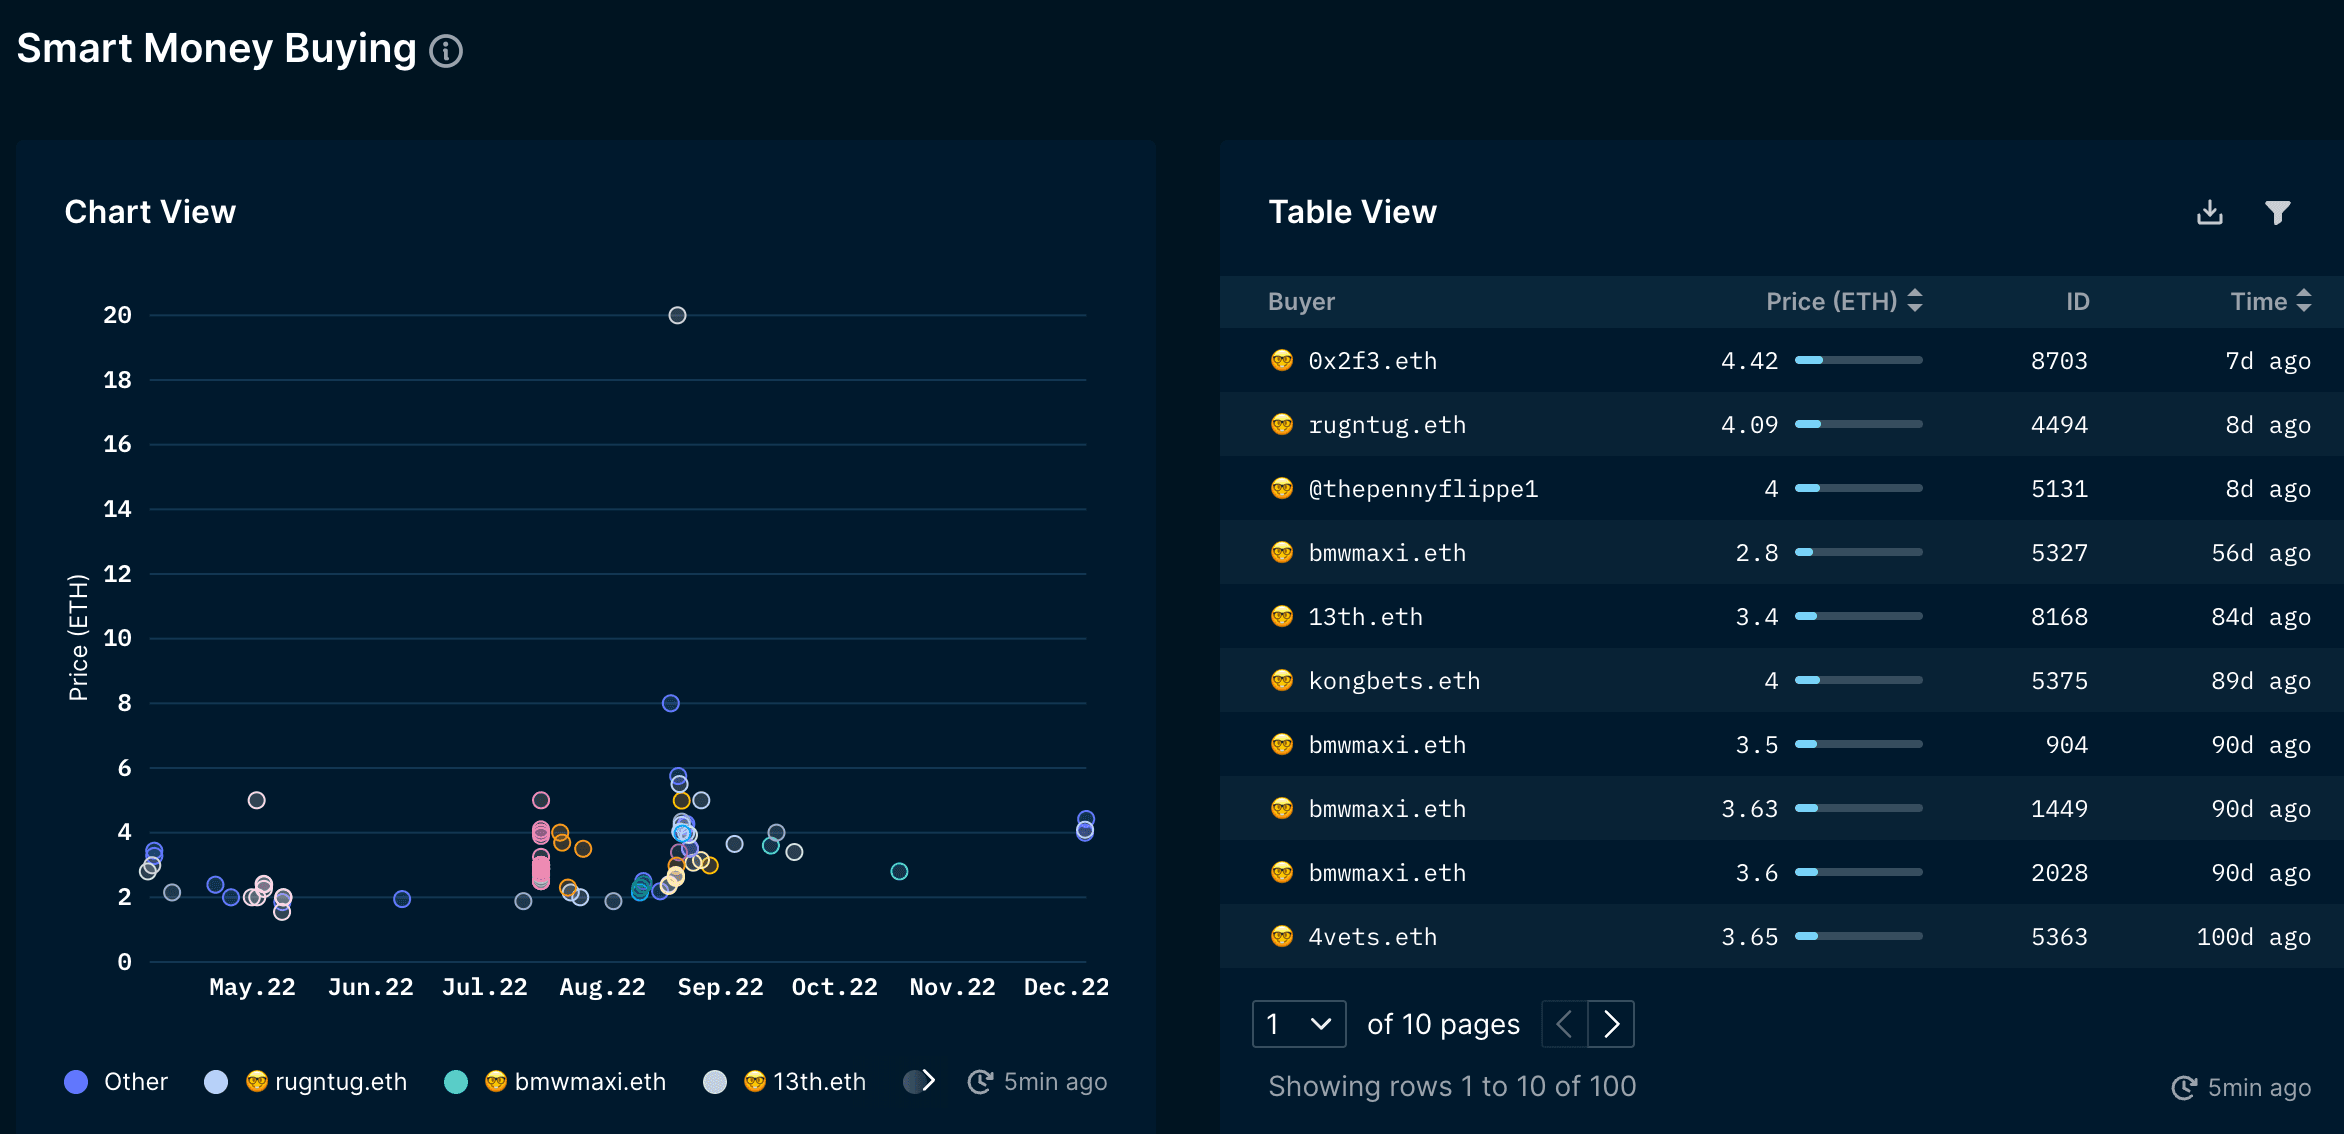
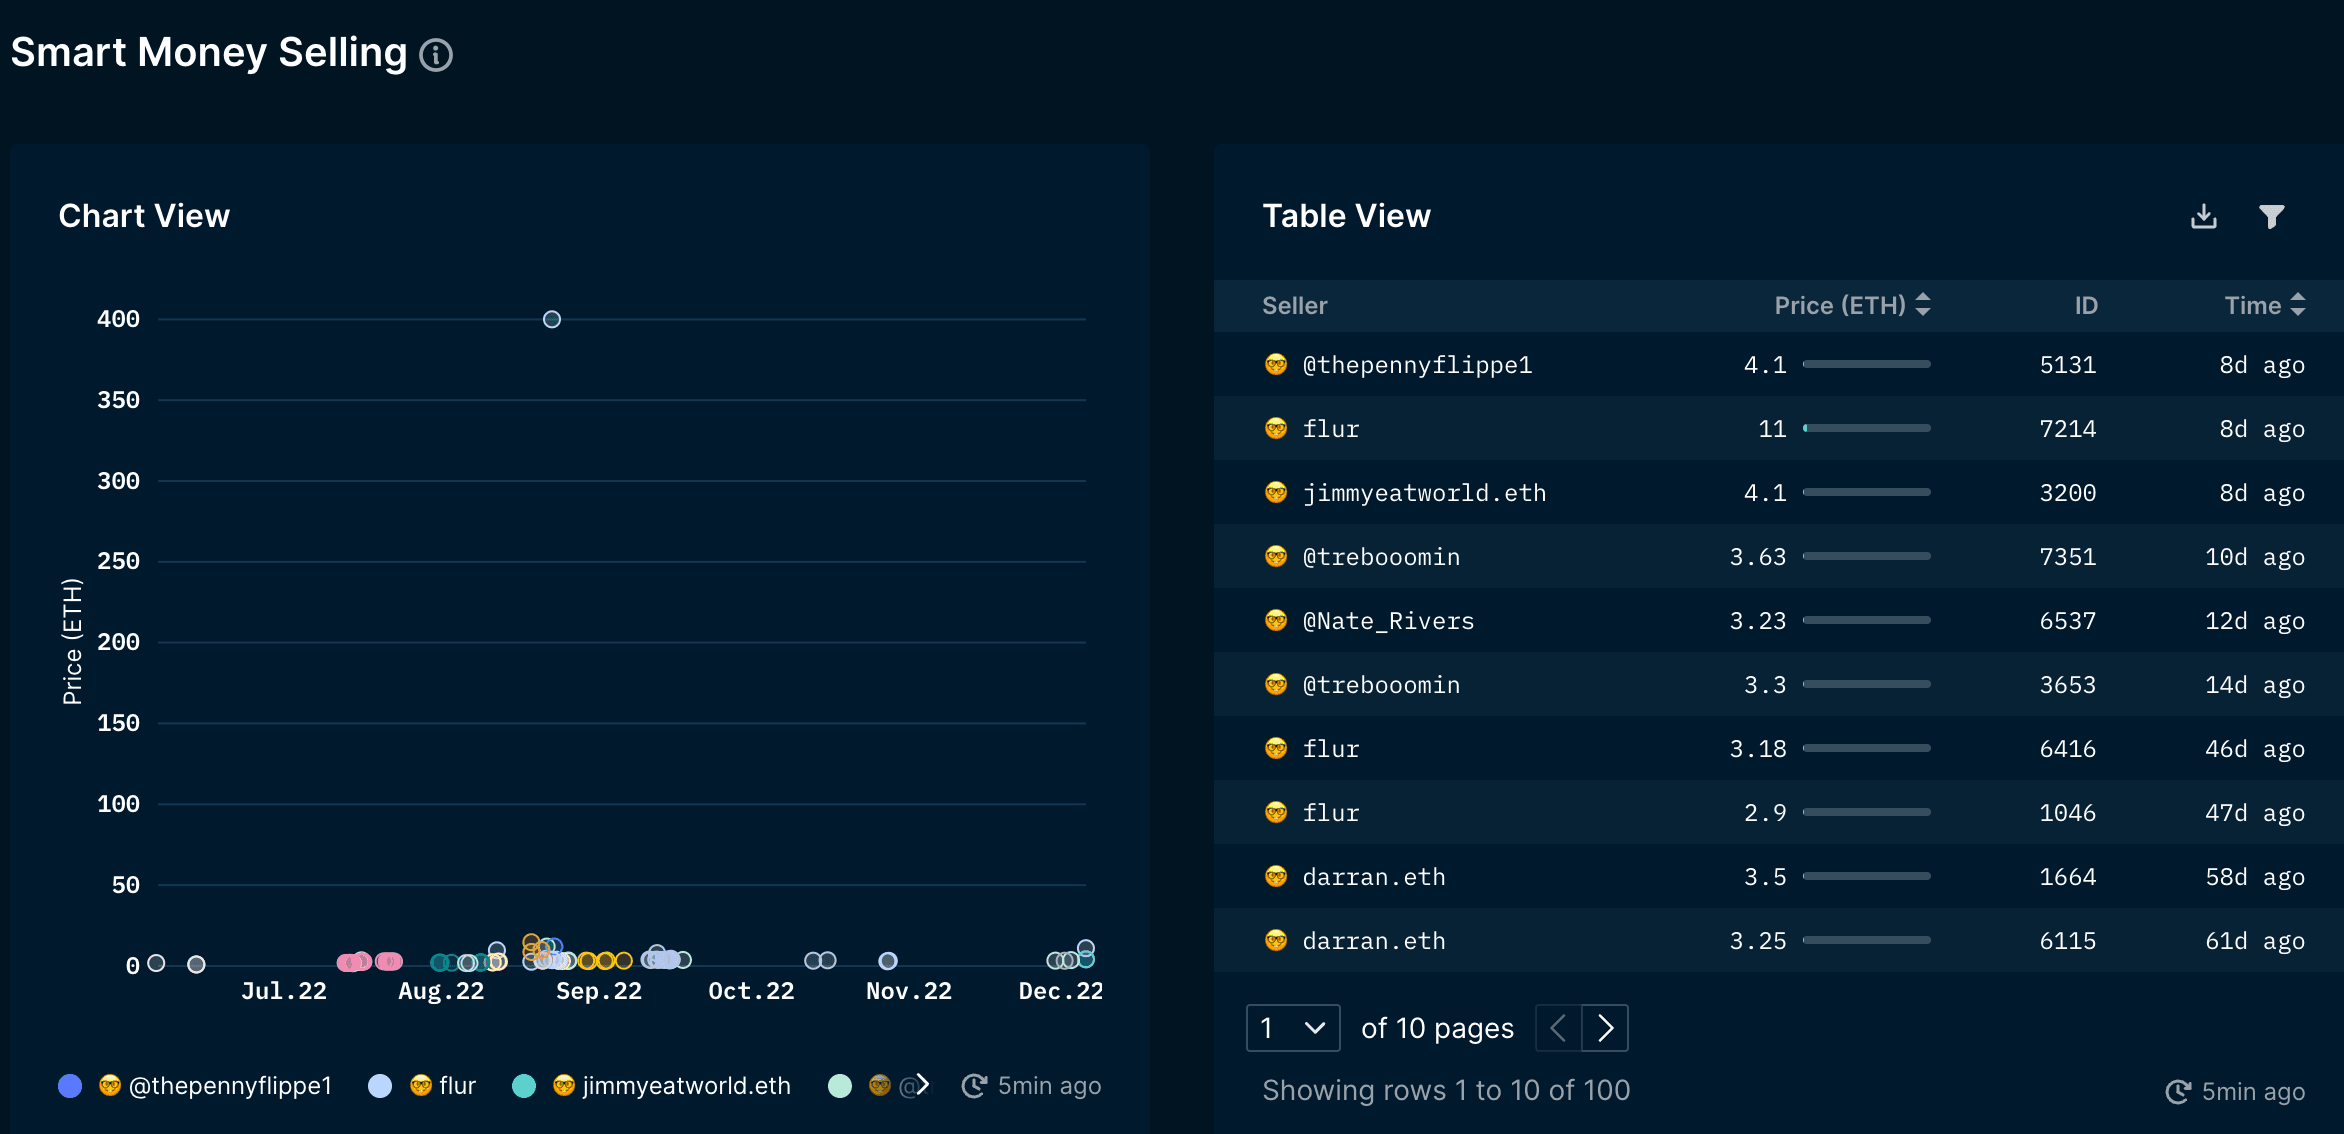
Firstly, we can observe the surface-level Smart money activity through the Smart Money Buying and Selling dashboards. These dashboards are a good starting point since it provides an overview of Smart Money activity in recent months. Note that these dashboards only account for NFT-specific Smart Money segments. Check out our Smart Money labels guide here.
On the buyers' side, three distinct NFT-specific Smart Money addresses picked up the NFTs in the past 30D, totaling 12.51 ETH in volume following a drought of buyers from NFT-Smart Money segments. On the other hand, 6 NFT-specific Smart Money sellers have offloaded their assets with a cumulative value of 29.36 ETH, including trebooomin, who sold his two remaining Penguins, and Nate Rivers, who sold his last Penguin. Meanwhile, flur still has 4 NFTs left in their wallet. The outweigh of sellers compared to buyers indicates that some NFT-Smart Money holders were looking to take profits from the recent run-up in floor price over the past few months.
Smart Money Owners
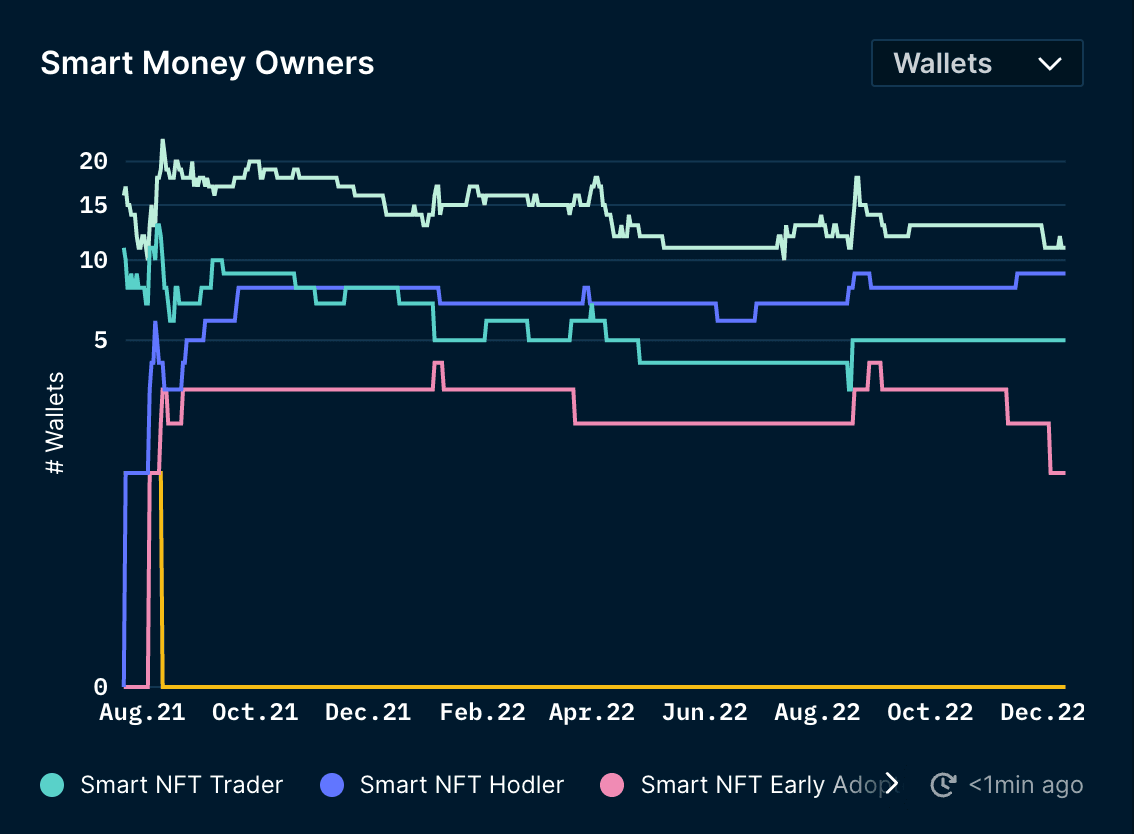
Once we have an overview of the recent trading activity from NFT-related Smart Money segments, we can evaluate each cohort individually. Smart NFT Sweeper (light green) is the largest cohort with 11 Smart Money wallets and has been relatively stable since April. Similarly, Smart NFT Hodlers (blue) is the second-largest segment with 9 addresses and has been slightly trending up over time, followed by Smart NFT Trader and Smart NFT Early Adopter at 5 and 1 wallets, respectively. The general lack of reduction in unique NFT-specific Smart Money wallets for the existing segments, apart from Smart NFT Early Adopters, is a positive sign for the collection. In other words, we are looking for a consistent trend of holders from each cohort.
Smart Money Balance Changes
To assess the activity for all Smart Money segments, we need to use the Balance & Changes table under the Balances tab of the NFT God Mode. Although there has not been any NFT-related Smart Money segment activity in the past few days, the general Smart Money overview also shows that there have been more selling from other Smart Money segments in the past week. Specifically, 6 Pudgies sold compared to 2 buys. "0xyz_" on OpenSea sold off their entire Pudgy Penguins position but was not shown on the Smart Money Selling dashboard as this individual is a Smarter LP. On the other hand, aibi.eth, an Airdrop Pro, was the only Smart Money buyer in the past 7D.
The Smart Money Balances & Changes table does not imply buying or selling, as these individuals may just be transferring the NFTs to another wallet. Therefore, it is imperative to view their NFT transaction history on the Wallet Profiler or Nansen Portfolio while conducting due diligence to avoid data misinterpretation.
Smart Money Balances
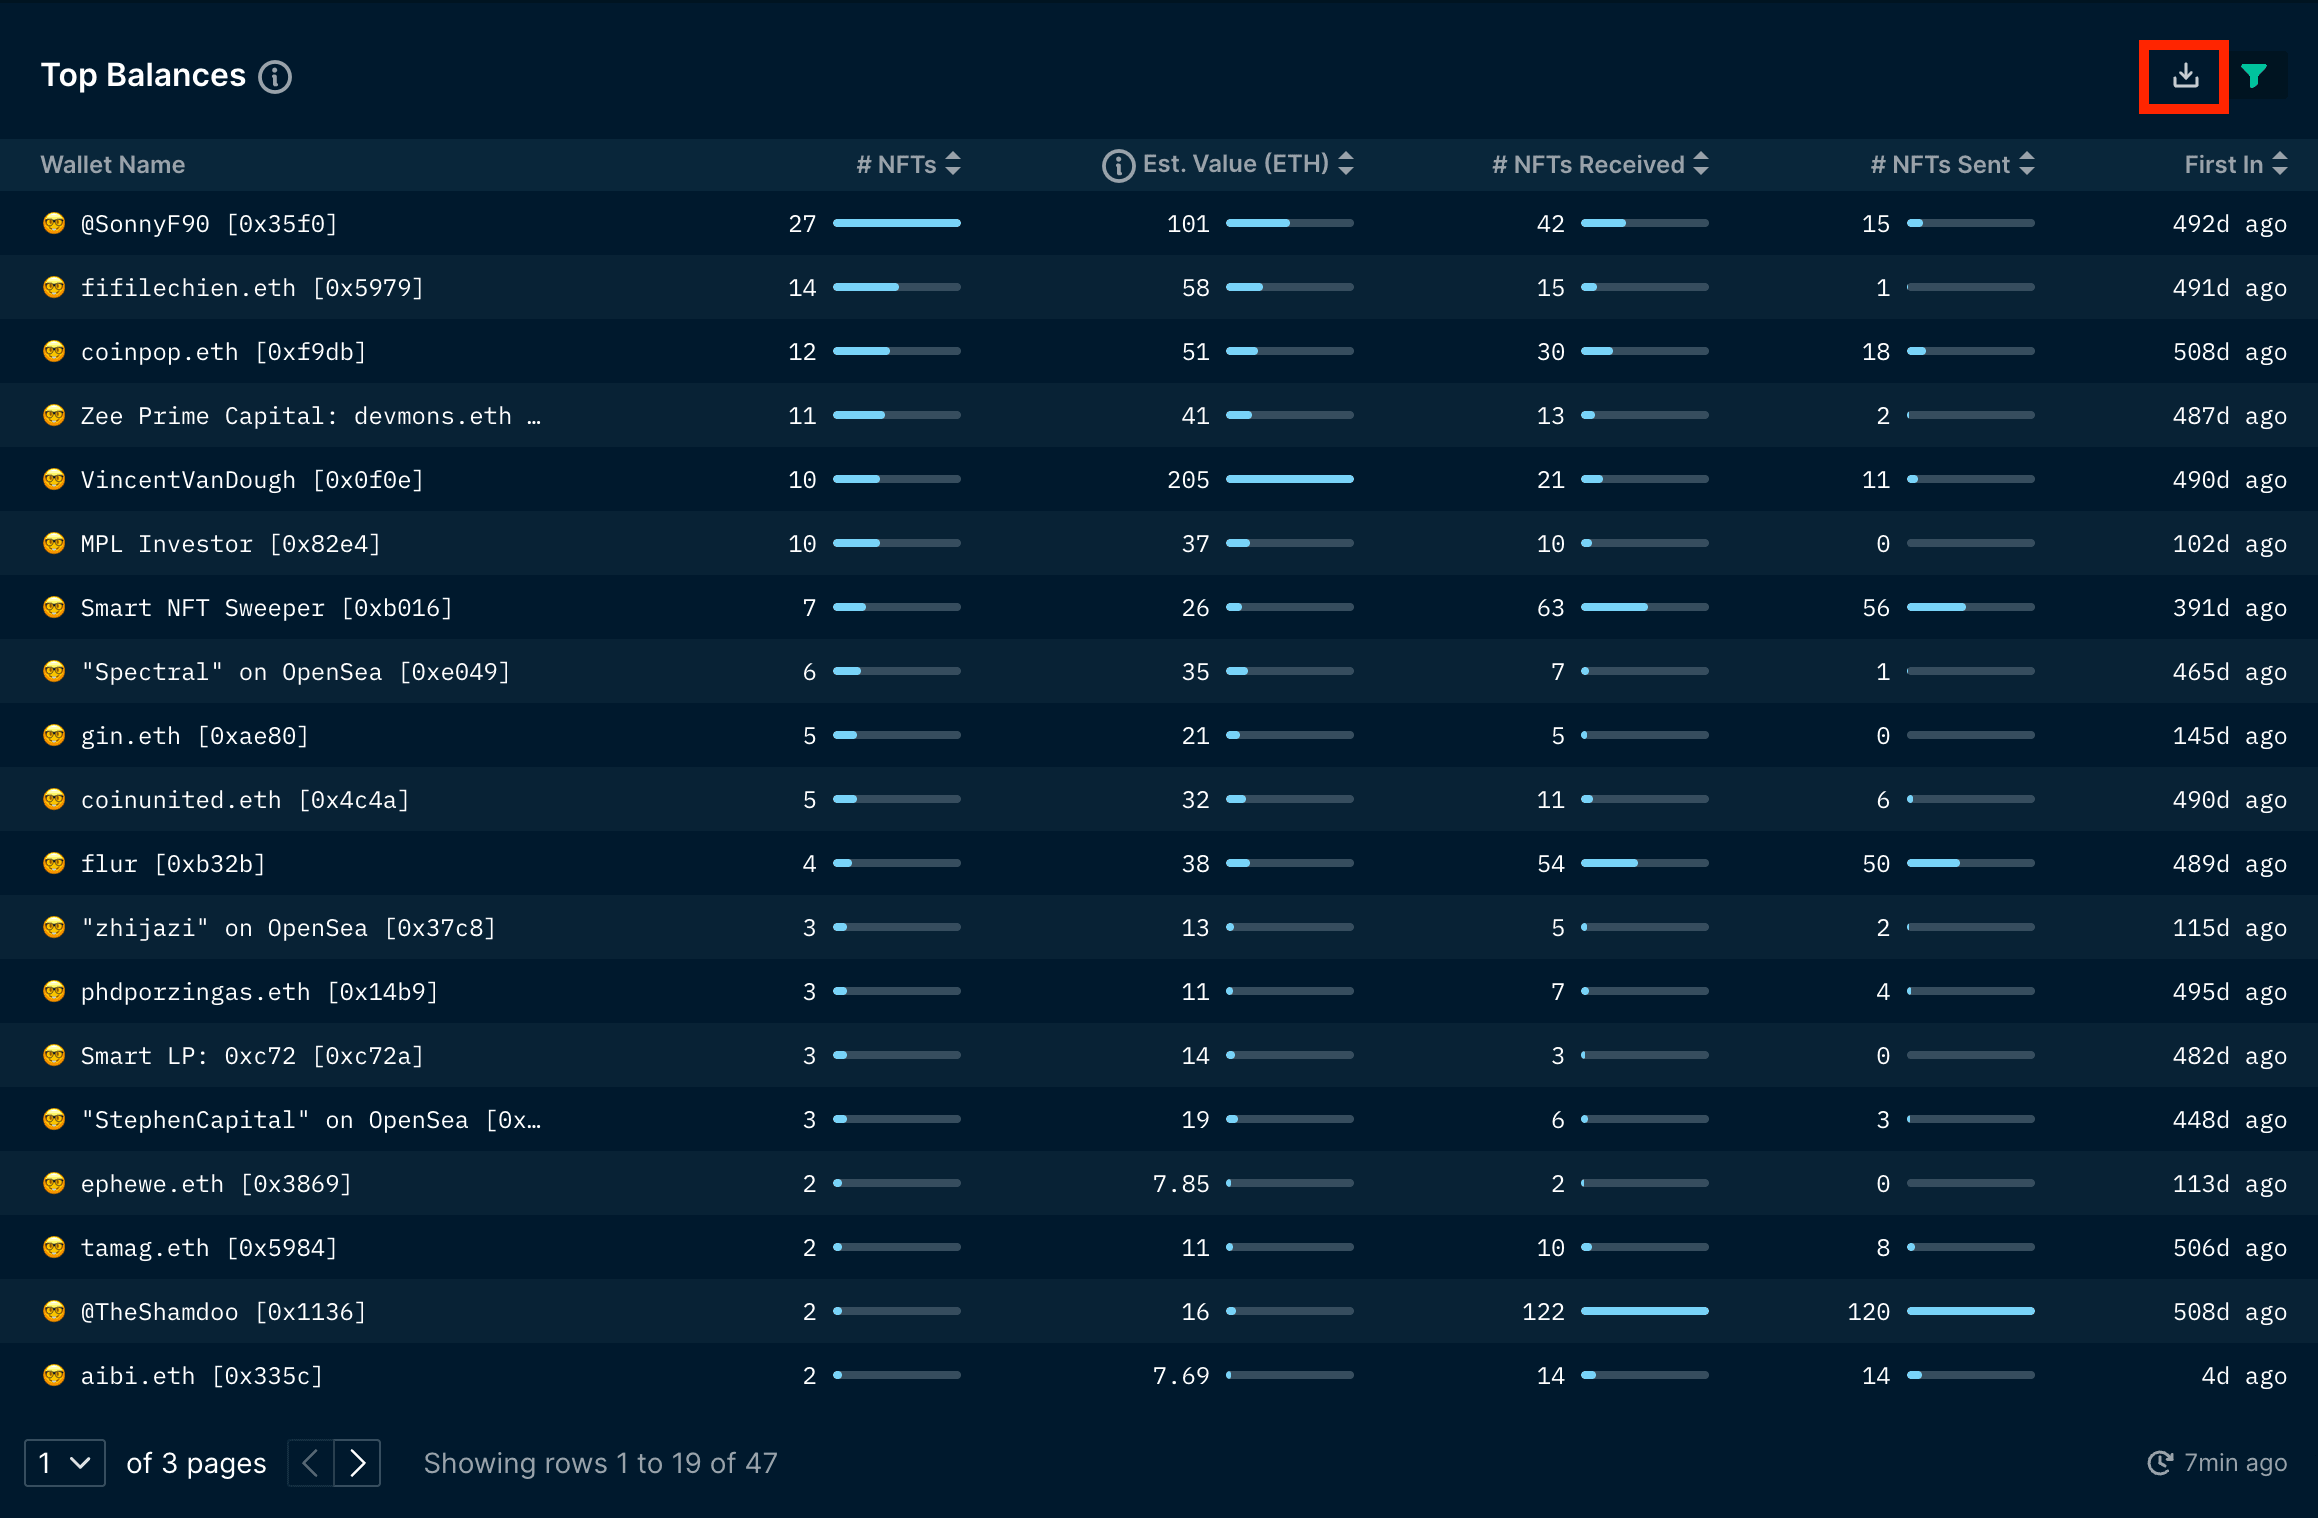
Once we have identified the individual Smart Money wallets that have traded the NFTs, we can cross-check with the Top Balances by filtering for Smart Money to study whether they are a notable or sizable collector of the collection. The Top Balances table should serve as the central source of information to gauge the size of impact from a specific Smart Money wallet based on their trading activity. For example, if a top 5 Smart Money holder has drastically decreased their position in a short period of time, then it could suggest that we should also consider taking some profits.
In addition, we can analyze the Smart Money holder representation by clicking on the download button on the top-right of the dashboard, as seen above. This feature allows us to download the dashboard as a CSV or XLS file. Once we've filtered for Smart Money holders and downloaded the file, we can measure two data points; Unique Smart Money holders and the total number of NFTs held by all Smart Money.
| Unique Holders | NFTs Held | Avg. NFTs Held | |
|---|---|---|---|
| Smart Money | 47 | 173 | 3.68 |
| All Holders | 4511 | 8888 | 1.97 |
| % of SM Dominance | 1.04% | 1.95% | N/A |
Data as of 13 Dec 2022
In this example, there are 47 unique Smart Money owners of Pudgy Penguins, collectively possessing 173 Penguins at the time of writing. From this, we can calculate the percentage of Smart Money holder representation compared to all unique owners, as well as the percentage of NFTs owned by Smart Money relative to the collection's size. There are 4,511 unique holders (obtained from the distribution dashboard) and 8,888 NFTs. Hence, Smart Money represents 1.04% of the holder distribution while controlling 1.95% of all Pudgies. Although, the average Smart Money wallet owns more NFTs than regular holders.
To get a better perspective of Smart Money representation, the table below displays the Smart Money dominance for other notable NFT collections:
| Collection | % of SM Holders | % of NFTs Held by SM | Avg. # of NFTs Owned by SM |
|---|---|---|---|
| Pudgy Penguins | 1.04% | 1.95% | 4 |
| CryptoPunks | 3.44% | 15.15% | 12 |
| Bored Ape Yacht Club | 1.29% | 6.58% | 8 |
| Mutant Ape Yacht Club | 0.58% | 3.71% | 10 |
| CloneX | 0.95% | 4.77% | 10 |
| Azuki | 1.22% | 8.11% | 13 |
| Doodles | 0.92% | 5.97% | 12 |
Data as of 16 Dec 2022
Pudgy Penguins have a Smart Money ownership percentage higher than several of the other collections on the list but lower in terms of NFTs held by Smart Money relative to the collection size. This could mean that Smart Money is less inclined to sell their Penguins relative to other collections, as Smart Money owns 4 Penguins on average, whereas the average number of NFTs owned by Smart Money for other collections are much higher.
These metrics are often helpful for examining and estimating Smart Money's dominance over a project. A small number of Smart Money addresses owning a significant portion of the collection could hint at a lack of distribution, whereas more Smart Money holders relative to all holders could signal that this collection may be worth investing in or looking into. Moreover, Smart Money sentiment can also be derived from tracking these data points over time, depending on how their dominance ratio has fluctuated.
Smart Money Diamond Hands
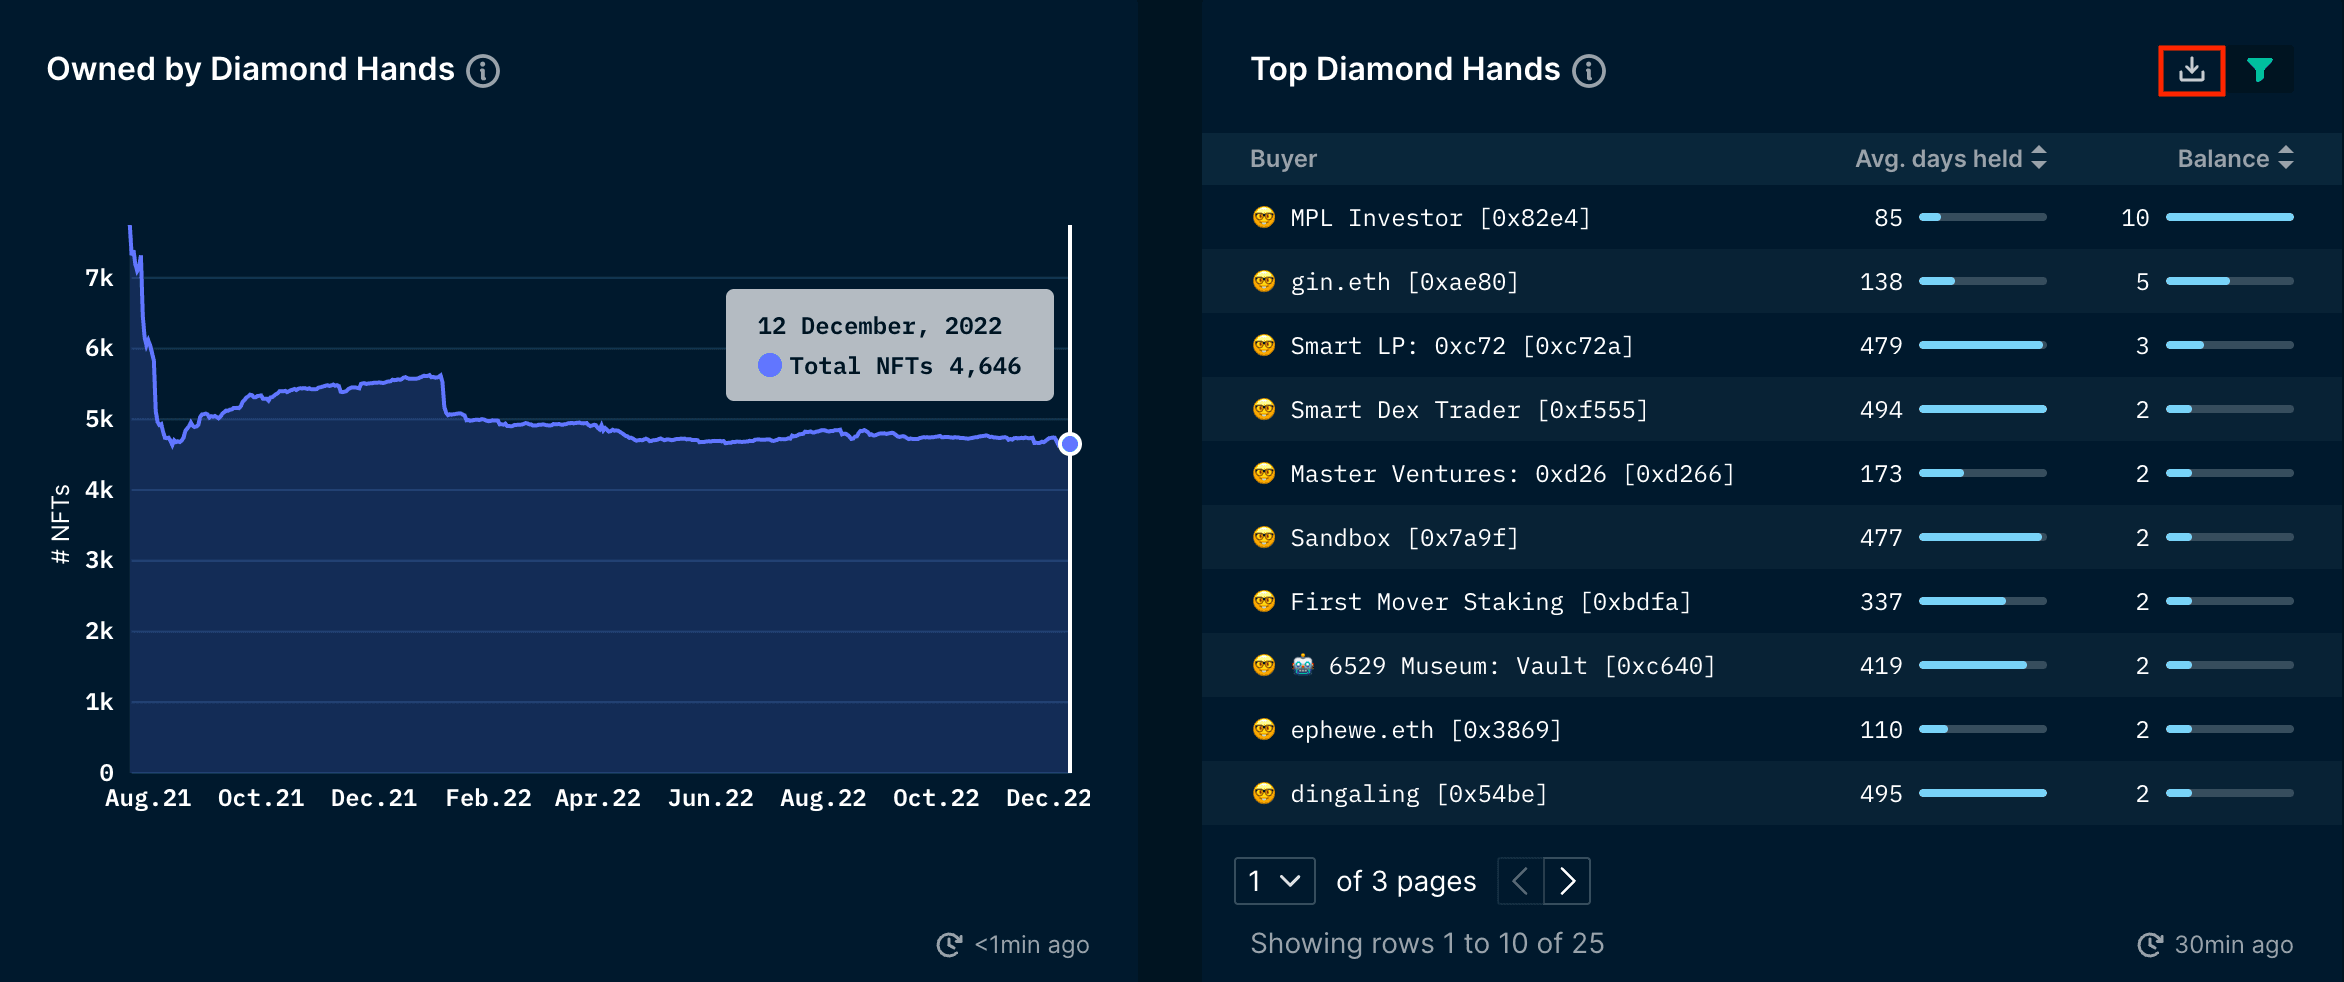
Another strategy to measure the holder sentiment over time is the Diamond Hands dashboards, which consist of the proportion of NFTs held by addresses that have never sold an NFT from the collection. A consistently large percentage of Diamond Handed NFTs and a set of unique Diamond Hand addresses over time suggest that many holders have a long-term conviction in the project. For example, the chart on the left shows that approximately 4,646 NFTs (over 50% of the supply) are held by Diamond Handed wallets and have remained stable since April, indicative of good holder sentiment.
From this, we can filter the Top Diamond Hands by Smart Money addresses, similar to previous sections. We can see that MPL Investor and gin.eth are the top Smart Money Diamond Hands and are the 6th and 9th largest Smart Money holders of the collection, respectively. Thus, it could be beneficial to set up Smart Alerts for these two wallets. If these Smart Money Diamond Hands start selling their assets, it is probable that they have lost some conviction or potentially have an overall bearish outlook on the NFT market.
Furthermore, we can also calculate the percentage of Smart Money holders who are Diamond Hands, the ratio of NFTs held by Smart Money Diamond Hands relative to all NFTs held by Smart Money, and their average days held.
| Unique Addresses | # of NFTs Held | |
|---|---|---|
| Smart Money Diamond Hands | 25 | 48 |
| All Smart Money | 47 | 173 |
| % of SM Diamond Hands/SM | 53.2% | 27.8% |
Data as of 13 Dec 2022
~53.2% of Smart Money addresses have never sold a Pudgy Penguin from the same wallet. These Diamond Handed Smart Money individuals own 48 of 173 Penguins held by all Smart Money addresses, translating to 27.8%. The average holding time for these Diamond Handed addresses is 368 days. These numbers show that Smart Money does have a longer-term conviction in the project and is still reluctant to take profits after a year.
Similar to the Smart Money dominance table, we can calculate the percentage of Smart Money Diamond Hands relative to all Smart Money holders for other notable NFT collections to get a better perspective of the data for Pudgy Penguins:
| Collection | % of SM Diamond Hands | % of SM NFTs Held by SM Diamond Hands | Avg. SM Diamond Hands Holding Time (days) |
|---|---|---|---|
| Pudgy Penguins | 53.2% | 27.8% | 368 |
| CryptoPunks | 45.23% | 33% | 646 |
| Bored Ape Yacht Club | 36.25% | 9.57% | 392 |
| Mutant Ape Yacht Club | 30.14% | 12.36% | 341 |
| CloneX | 39.13% | 20.82% | 293 |
| Azuki | 32.79% | 9.86% | 245 |
| Doodles | 32% | 8.72% | 288 |
Data as of 16 Dec 2022
Pudgy Penguins has the highest percentage of Smart Money Diamond Hands and ranks second in terms of the ratio of NFTs held by Smart Money Diamond Hands relative to the total number of Smart Money owners. This suggests that there is an accord of long-term holding among Smart Money owners of the collection compared to other notable PFPs.
Smart Money Listings
Lastly, the Smart Money listings is an insightful data point to consider and monitor because it could provide an opportunity to front-run these Smart Money holders looking to sell or help you estimate an exit price. An influx of recent listings by Smart Money could signal that a holder should also consider taking some profits.
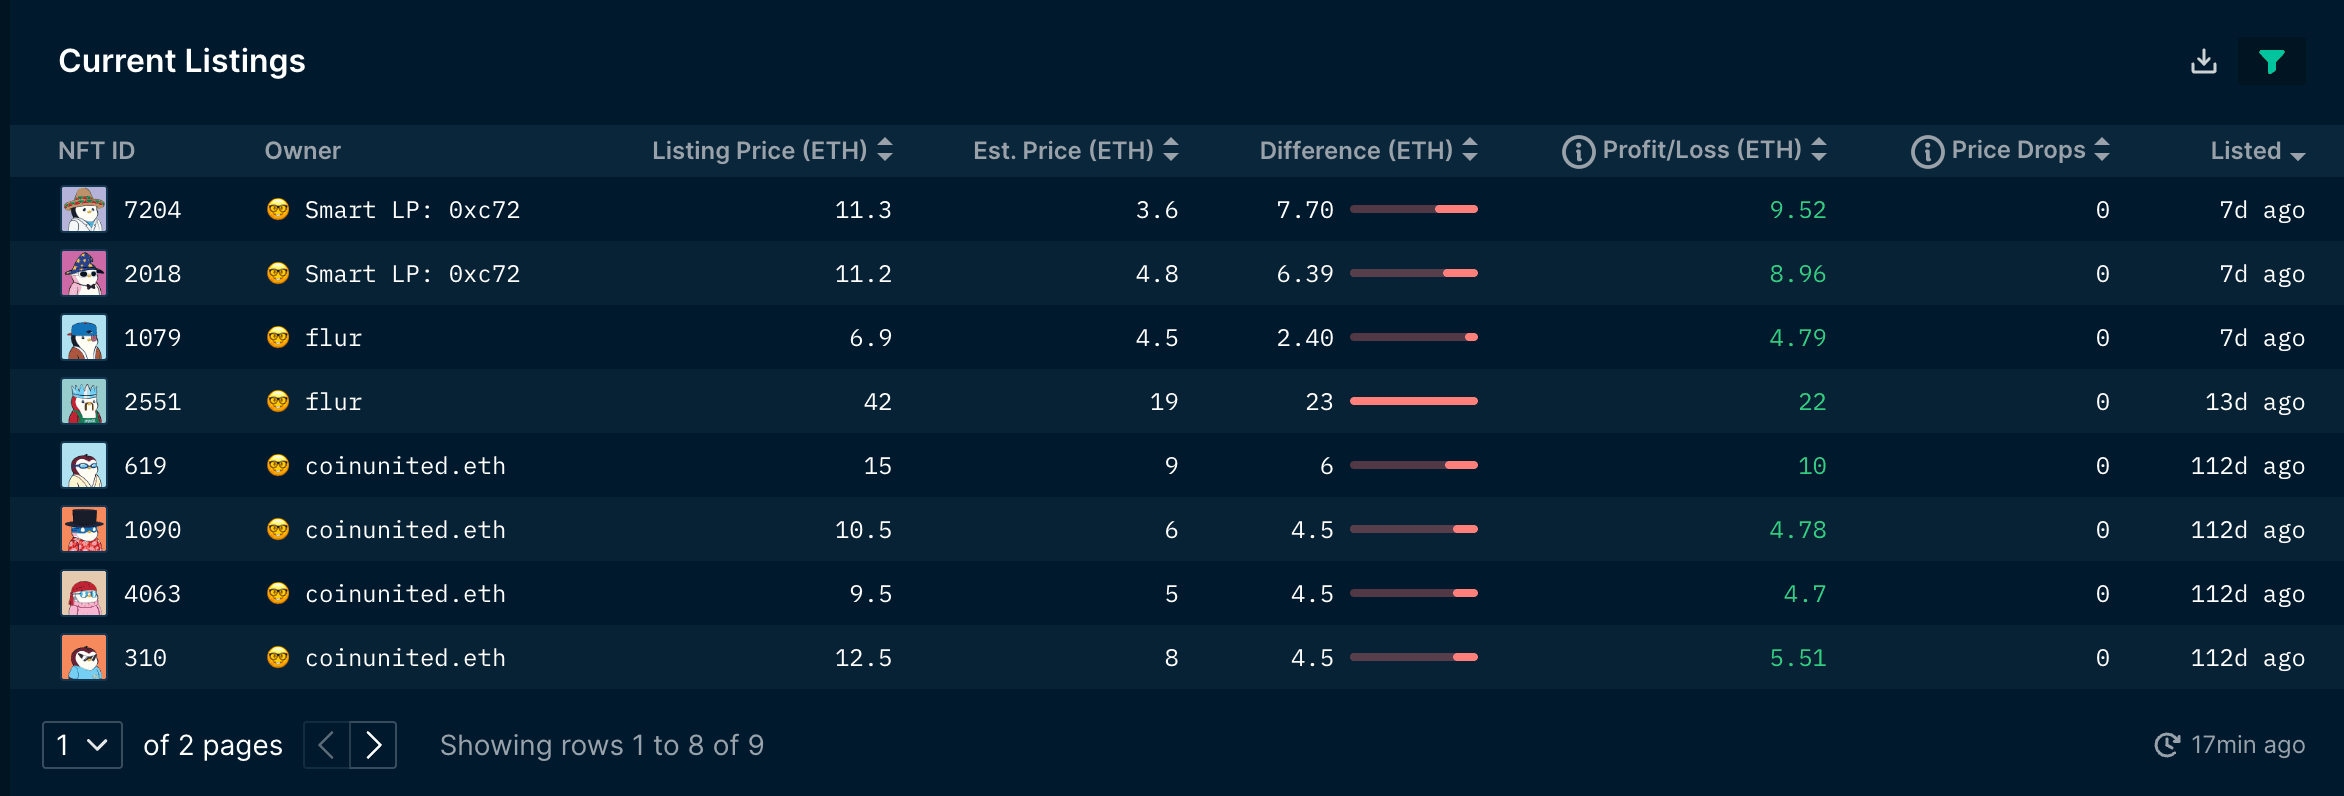
There are currently 9 NFTs owned by three Smart Money individuals listed on the secondary market for sale, equivalent to 5.2% of all Pudgy Penguin NFTs held by Smart Money wallets. coinunited.eth listed 5 Pudgies (but have been listed for over 113 days), while flur and Smart LP: 0xc72 have each listed two (within the past two weeks), respectively.
Conclusion
The goal of this workflow was to provide a simple guideline that can be followed to evaluate Smart Money sentiment and representation for a collection.
Although there has been some selling activity from Smart Money holders in the past few weeks, the data points still suggest a positive outlook for Pudgy Penguins. On a longer-term basis, most of the NFT-Smart Money segments have remained stable, more than half of all Smart Money owners are Diamond Hands with an average holding time of over a year, Smart Money is present but does not control a significant portion of the collection, and the number of NFTs sold/listed by Smart Money is a small proportion compared to all NFTs held by these wallets.


