What to Expect
Section 1: Major Events
Volatility, insolvency, and contagion: what were the key events?
- On-Chain Forensics: Demystifying TerraUSD De-peg
- On-Chain Forensics: Demystifying stETH's "De-peg"
- The Merge - A Deep Dive With Nansen
- Blockchain Analysis: The Collapse of Alameda and FTX
Section 2: DeFi
Analyzing on-chain behavior
Diving into the future of blockchain scaling
App-chain thesis: who is bringing it to market?
Re-assessing the blue-chip DeFi dApps
Section 3: NFTs
How to play the volatility of crypto and where do NFTs come in?
Who are the most profitable gaming traders and what projects are they bullish on?
How to benchmark profitability on NFT mints using Nansen?
Section 4: Using Nansen for Blockchain Analysis
Incorporating Smart Money into trading strategies
- Trading Crypto With Nansen Smart Money
- Following the Nerds: Understanding Smart Money Labels and How to Use Them
The Expert Guide on Using Nansen for NFT and DeFi Strategies
Section 1: Major Events
On-Chain Forensics: Demystifying TerraUSD De-peg

Report Overview
- Discover the origins of the widespread contagion by analysing the seven wallets that caused the original de-peg of UST.
Key Findings
- Through the examination of on-chain activities, we found that a small number of wallets and a likely even smaller number of entities behind these wallets led to imbalances in the Curve liquidity protocols that were regulating the parity between UST and other stablecoins.
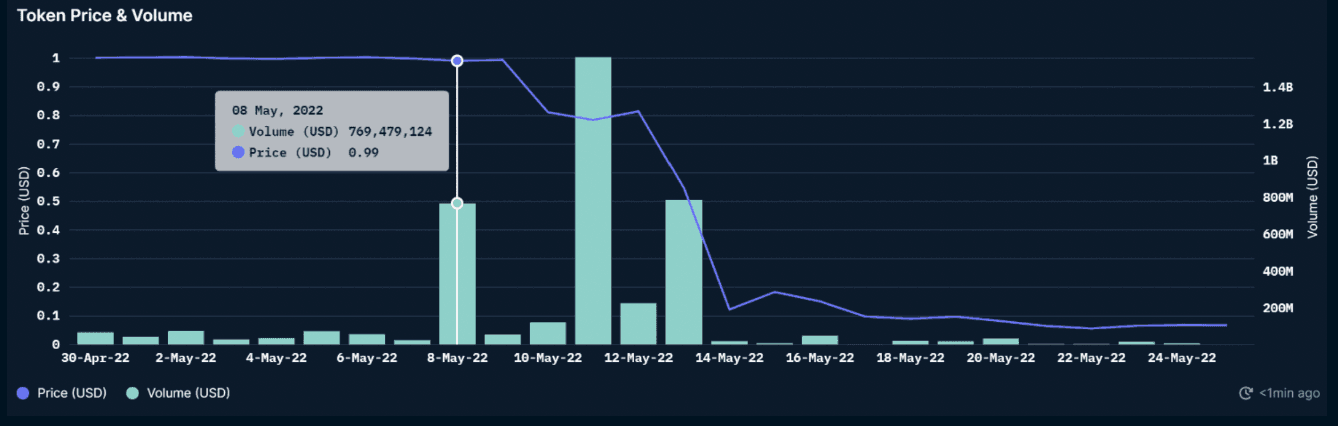
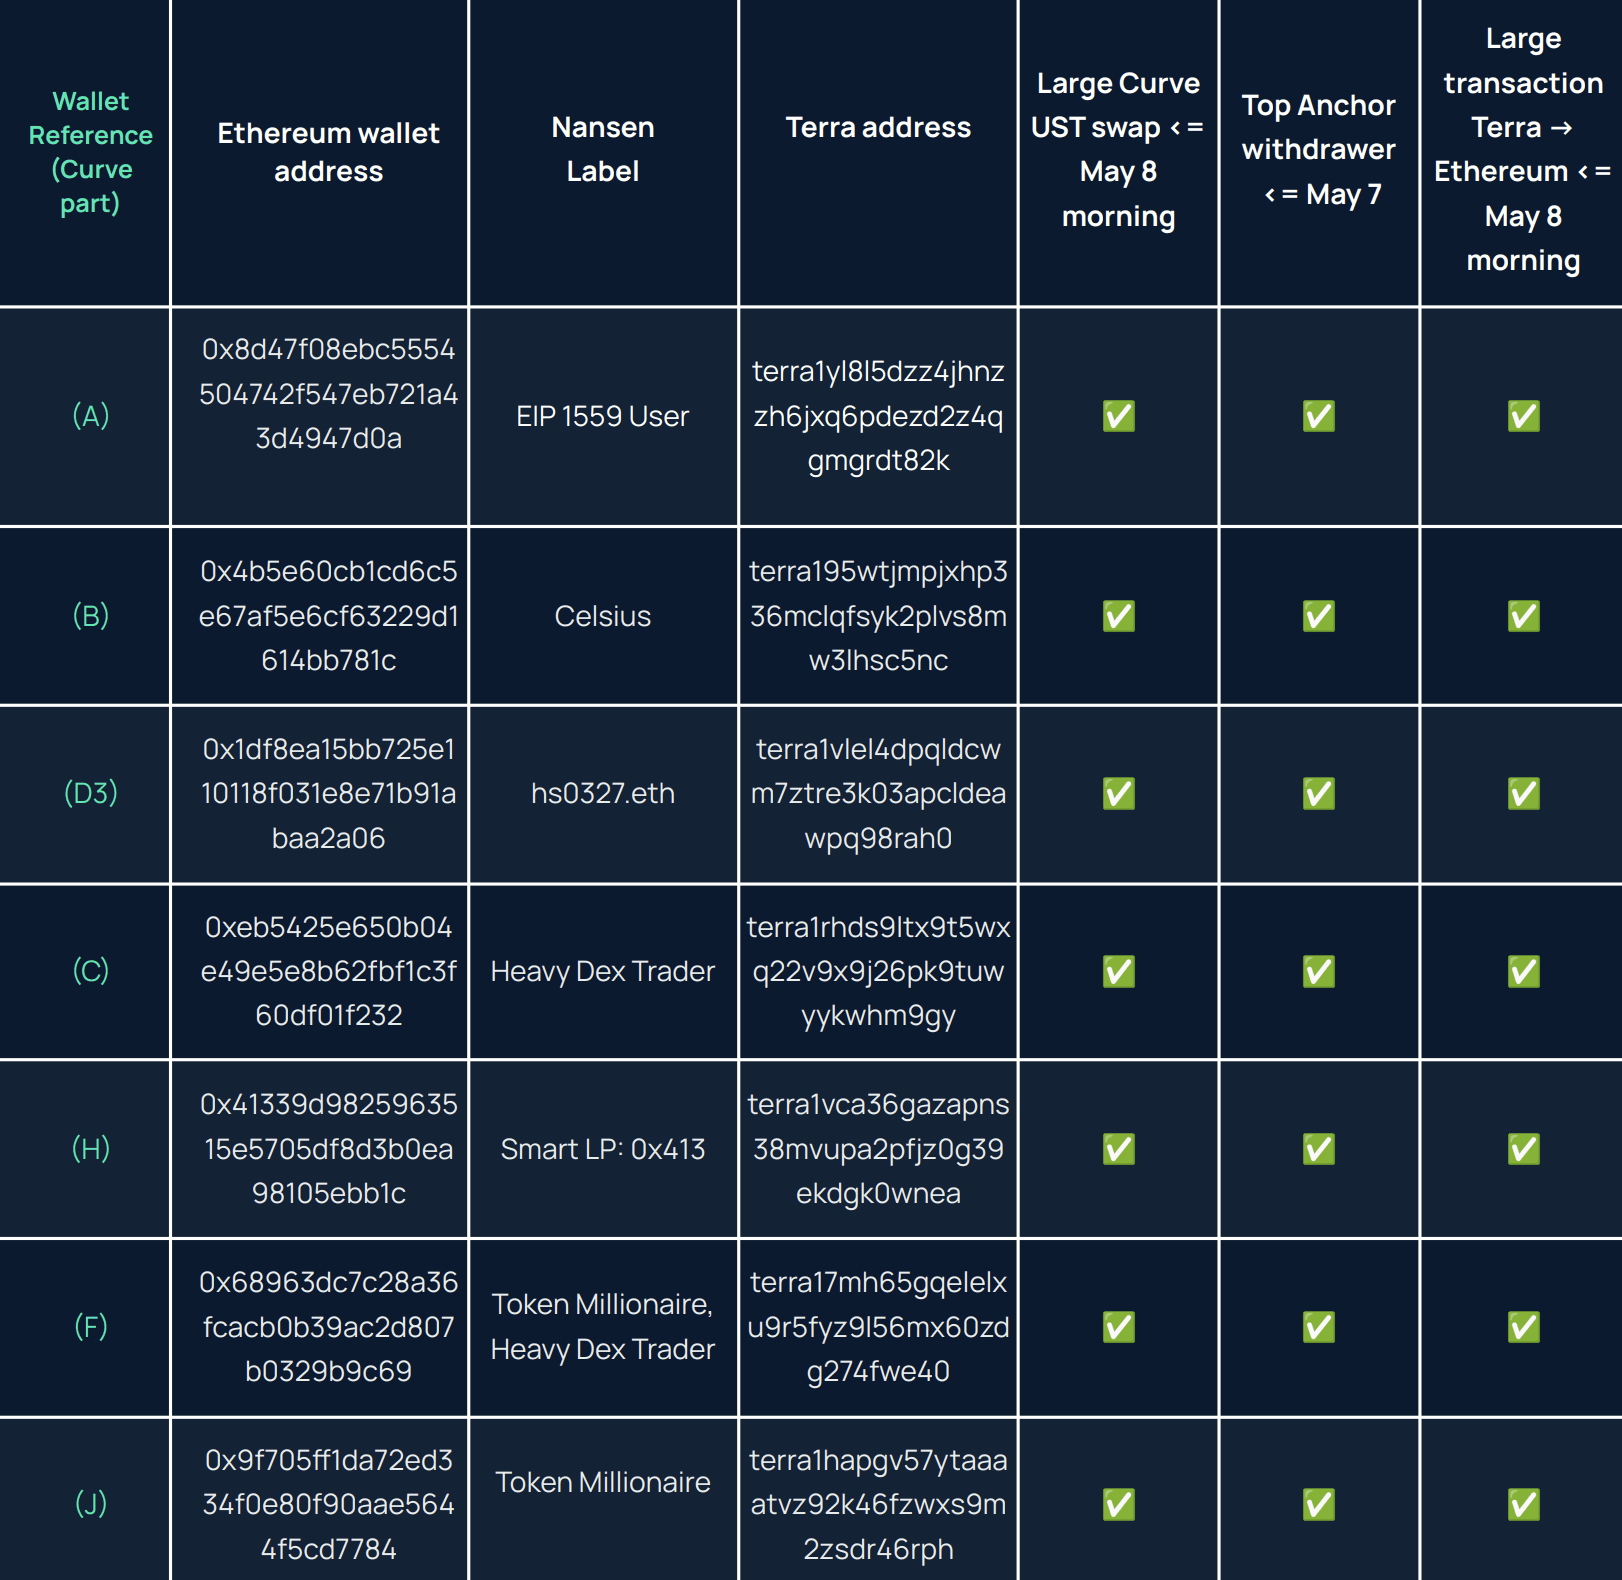
- Seven “initiating” wallets swapped significant amounts of UST vs other stablecoins on Curve as early as the night of May 7 (UTC). These seven wallets had withdrawn sizable amounts of UST from the Anchor Protocol on May 7 and before (as early as April) and bridged UST to the Ethereum blockchain via Wormhole. Out of these seven wallets, six interacted with centralized exchanges to send more UST (supposedly for selling) or, for a subset of these, to send USDC that had been swapped from Curve’s liquidity pools.
- This on-chain study disproves the narrative of one “attacker” or “hacker” working to destabilize UST. Instead, we found that a small number of wallets identified and arbitraged vulnerabilities - specifically in relation to the shallow liquidity of the Curve pools securing the UST’s peg to the other stablecoins. This led to the following events:
Withdrawing of UST funds from the Anchor protocol on Terra.
Bridging of these funds from Terra to Ethereum via the Wormhole infrastructure.
Swapping of significant amounts of UST to other stablecoins in Curve’s liquidity pools.
During the “de-pegging” process, some of these wallets likely exploited inefficiencies between various pricing sources (Curve, other decentralised exchanges, and centralised exchanges) by taking buying and selling positions in the transactions between CEX and DEX.
Key Data and Charts
UST price and volume through the Wormhole bridge before and during the de-peg
The 7 key wallets that significantly influenced the UST depeg.
Read the full report here!
On-Chain Forensics: Demystifying stETH's "De-peg"

Report Overview
- Lido’s stETH price significantly deviated from the price of ETH in June, putting many big players that were using leveraged stETH/ETH strategies in a tight spot - some of whom never recovered. This report digs into on-chain data to answer the questions of what exactly caused this and who were affected & the extent of it - some entities like 3AC fell shortly after and others may have only recovered on the surface.
Key Findings
- Our on-chain investigation revealed that contagion stemming from the de-peg of UST and subsequent collapse of the Terra ecosystem was likely the main factor for stETH deviating away from this 1:1 ratio.
- As stETH cannot be redeemed for ETH until after the Merge, the primary way to obtain liquidity on large stETH positions is through Curve.
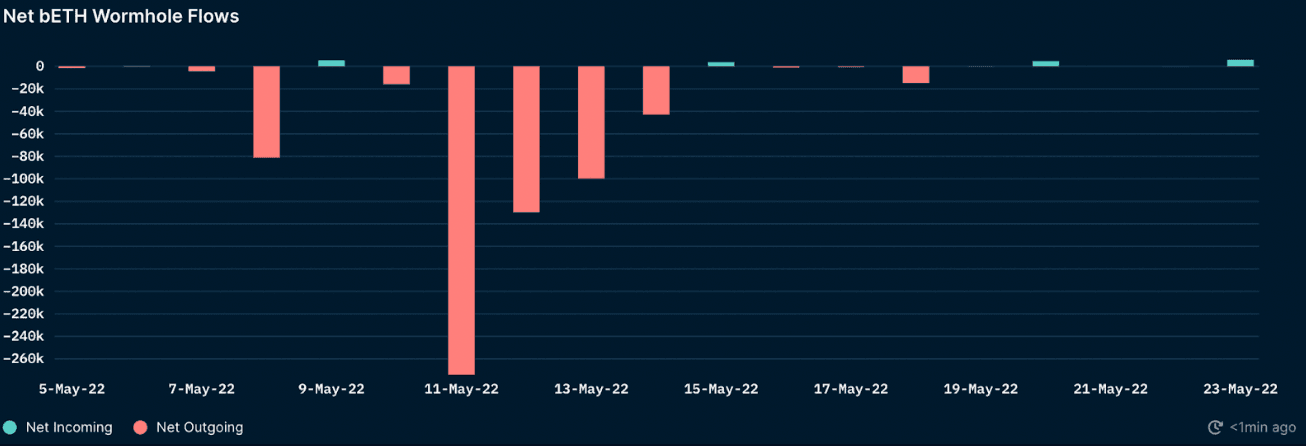
- Large quantities of stETH (in the form of bETH) which were deposited in Anchor were almost entirely bridged back to Ethereum mainnet in a matter of days, increasing the selling pressure and causing uncertainty among participants.
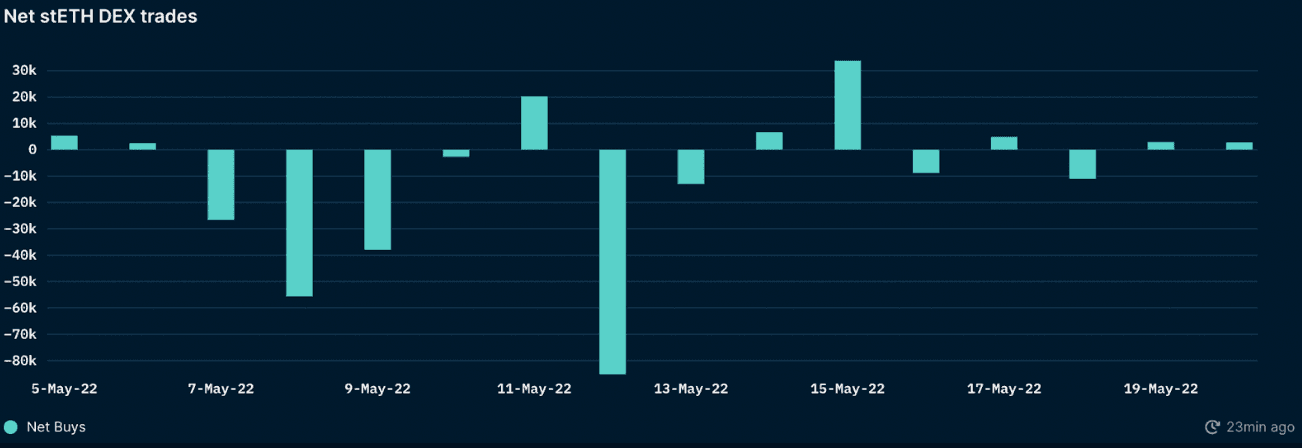
- During the Terra collapse (May 7-16), the main liquidity pool on Curve lost more than half its TVL (3AC and Celsius alone withdrew almost $800m combined), resulting in a classic “liquidity crunch” as reflected in the pool’s imbalance which left the stETH price “vulnerable”.
- Given the weak market backdrop post-Terra’s collapse, both pool imbalance and liquidity on Curve for stETH failed to recover; the drying up of liquidity meant that there was no other avenue for significant stETH holders such as Celsius to cover their positions, culminating in the widely publicized events that occurred on June 11-13.
Key Data and Charts
Timing of bETH Wormhole outflows and stETH buys / sells
stETH Price vs Lido Deposits
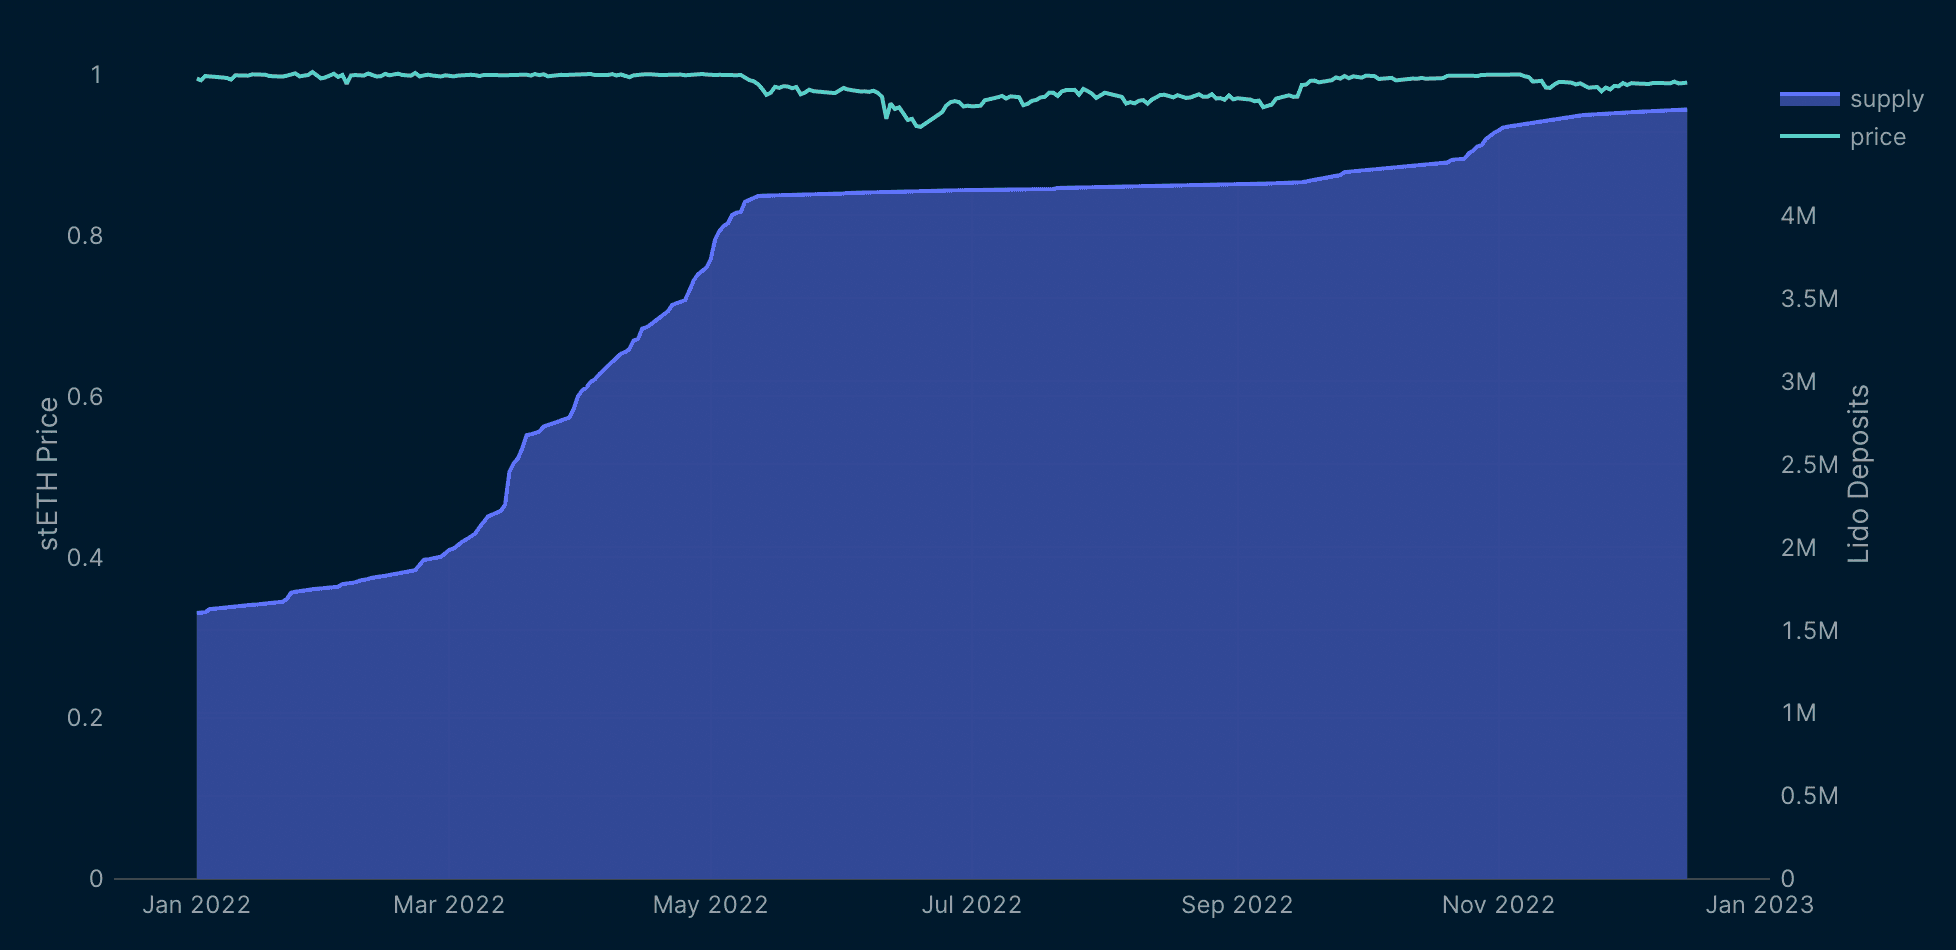
Read the full report here!
The Merge - A Deep Dive With Nansen

Report Overview
This report looks into Ethereum's shift towards Proof-of-Stake. It examines the distribution of staked ETH and finds that it is relatively centralized among several entities. It looks at the unrealized profit and loss of ETH stakers and advocates for a push towards more decentralized liquid staking providers.
Key Findings
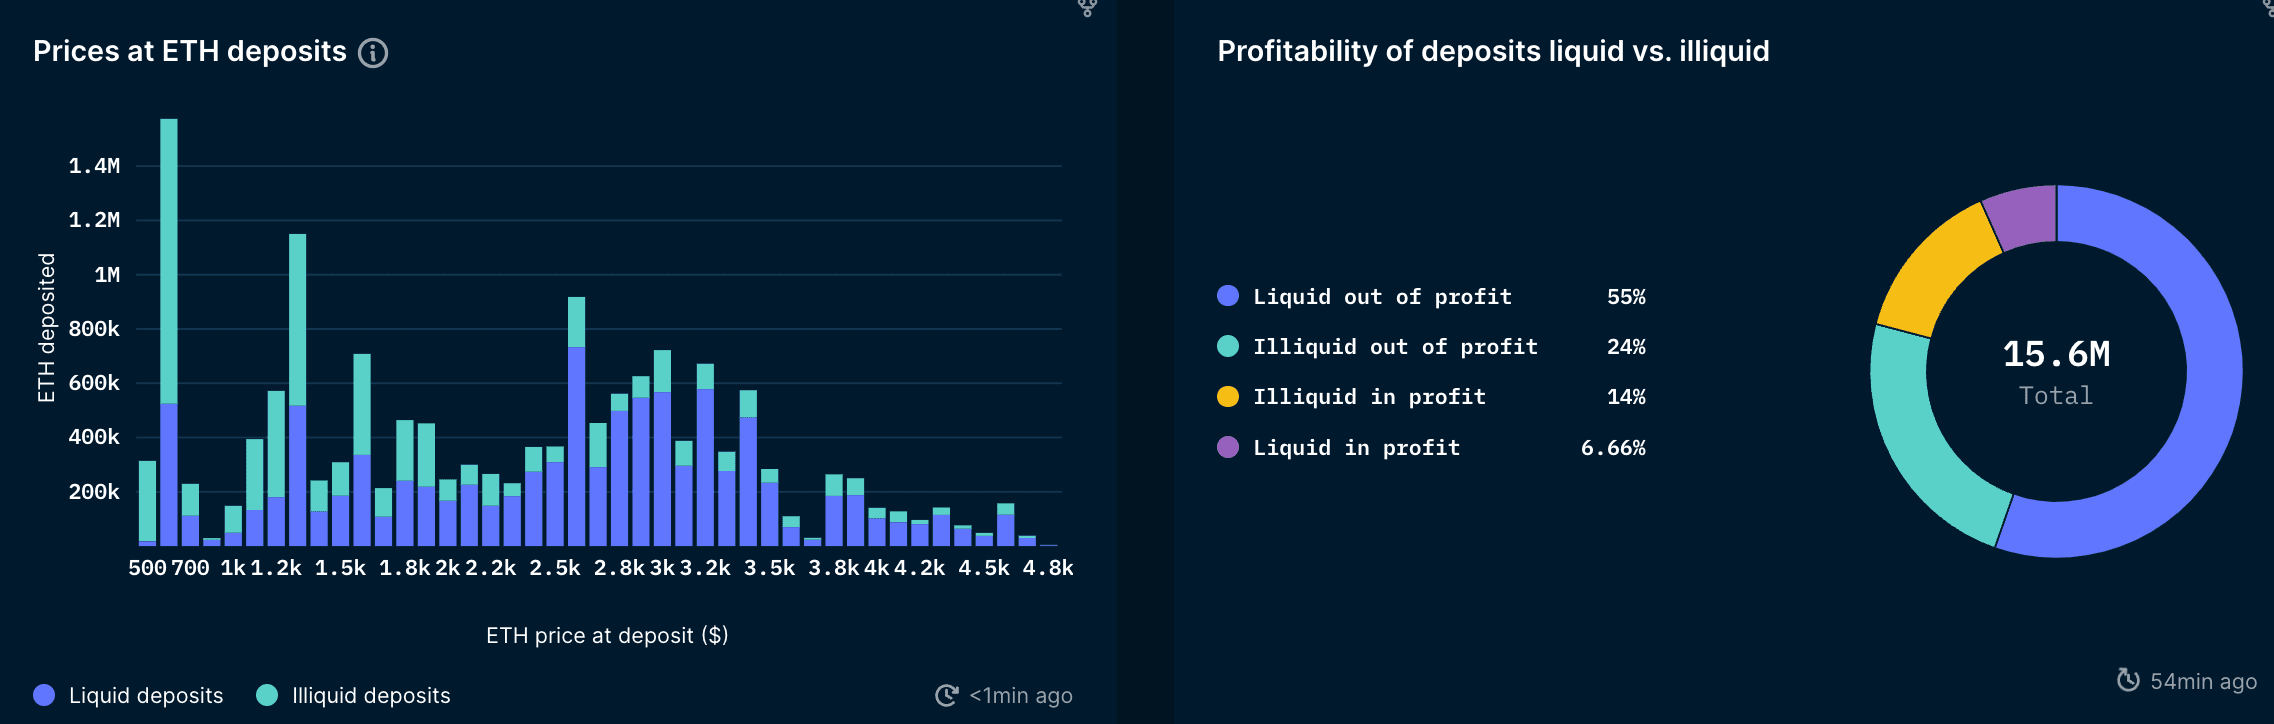
- A relatively small proportion of ETH is currently staked (~13%) of which 62% is liquid staking and 38% is illiquid. Despite there being a very high number of validators (~490k) and unique depositors (~90.5k), approximately 60% of staked ETH is with 5 entities.
- Lido held the greatest amount of staked ETH (29%), followed by Coinbase, Kraken, and Binance with a combined ~27%. Liquid staking services like Lido were set up to avoid the potential for centralized entities like exchanges gaining a majority of staked ETH. It is extremely important that liquid staking providers like Lido become sufficiently decentralized to be censorship resistant.
- Ownership of Lido’s governance token, LDO, is relatively concentrated, with the largest token holders being identifiable funds and team members which arguably carries censorship risk. For example, the top 9 addresses (excl. treasury) held ~49% of governance power, and a small number of addresses typically dominated proposals. The stakes for proper decentralization are very high for an entity with a potential majority share of staked ETH.
- The vast majority of staked ETH was out-of-profit (~79%). 24% of all staked ETH belonged to illiquid stakers that were in profit - these are arguably the category most likely to sell when withdrawals are enabled at the Shanghai upgrade. ETH whales have been accumulating ETH all year.
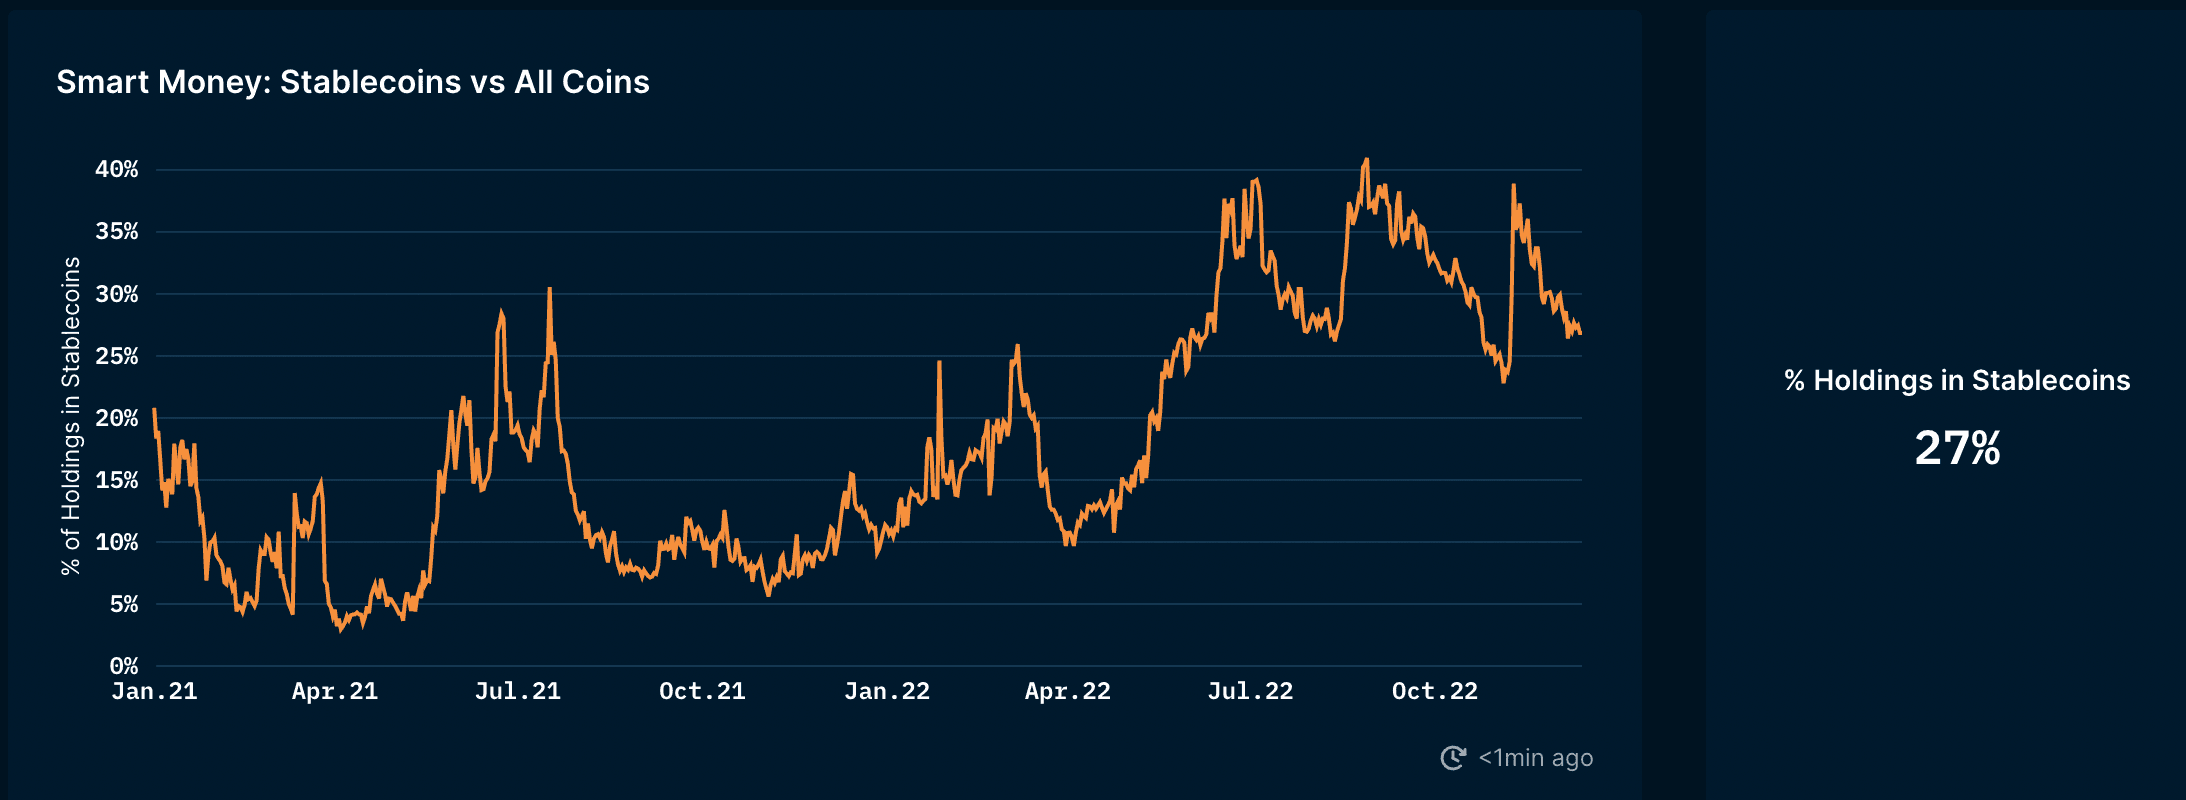
- Smart Money ETH holdings have been rising following a low in mid-June.
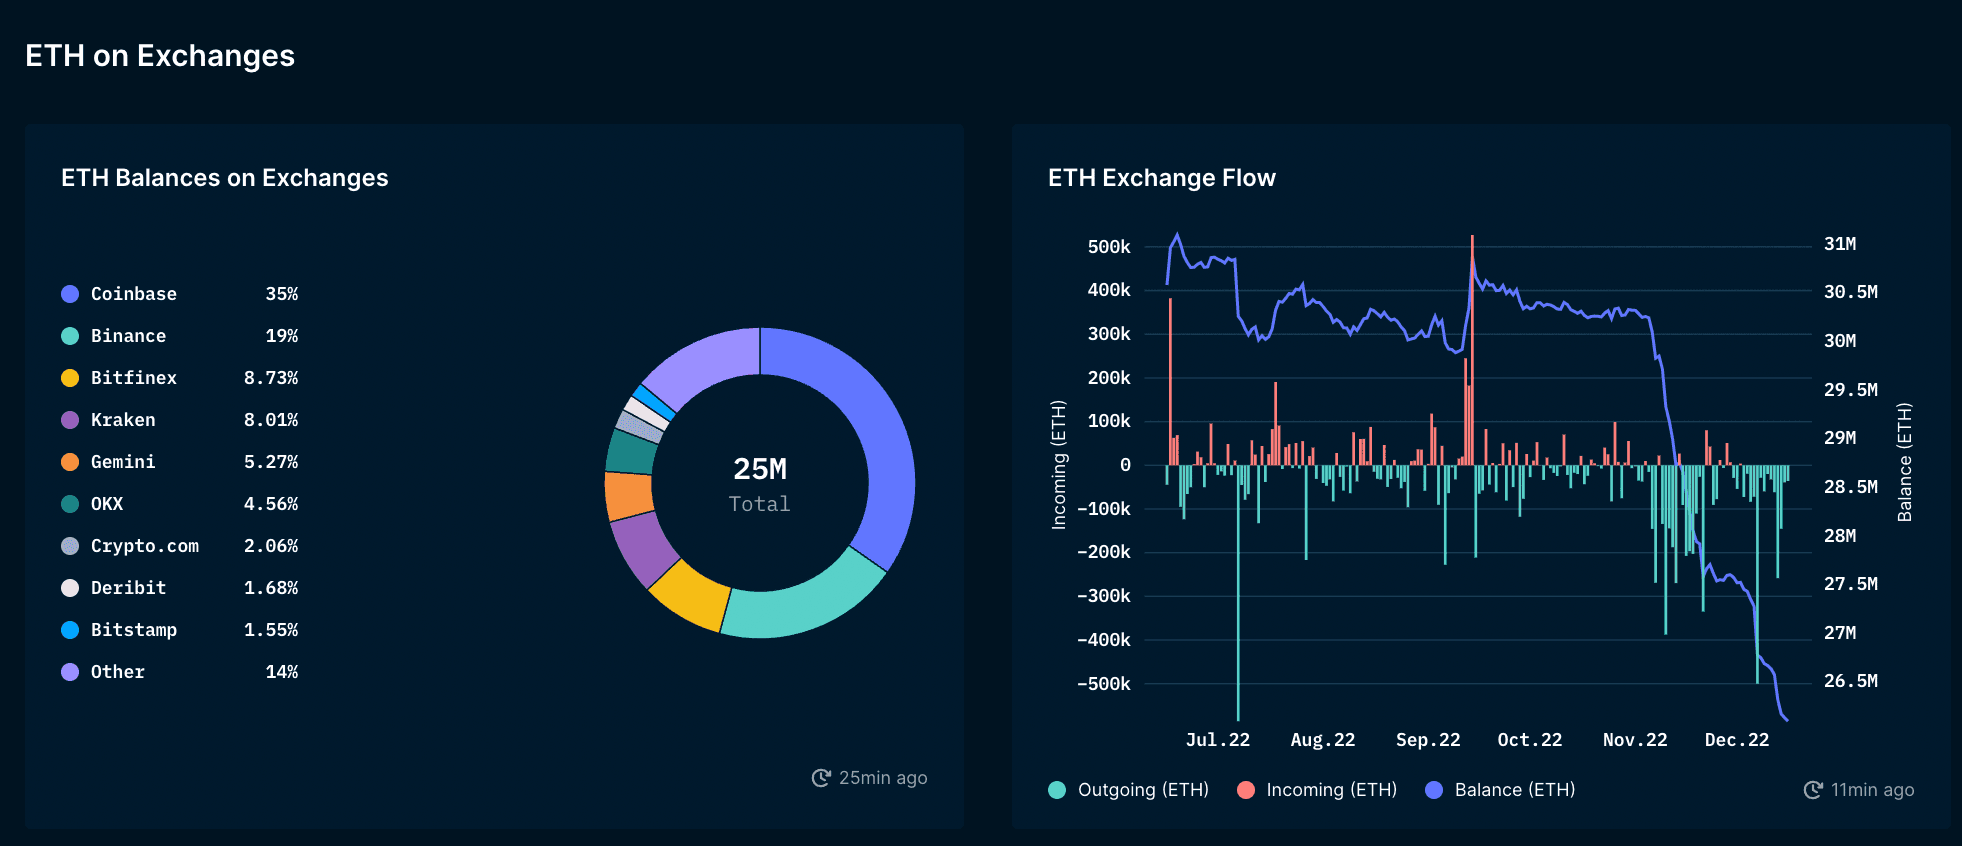
Key Data and Charts
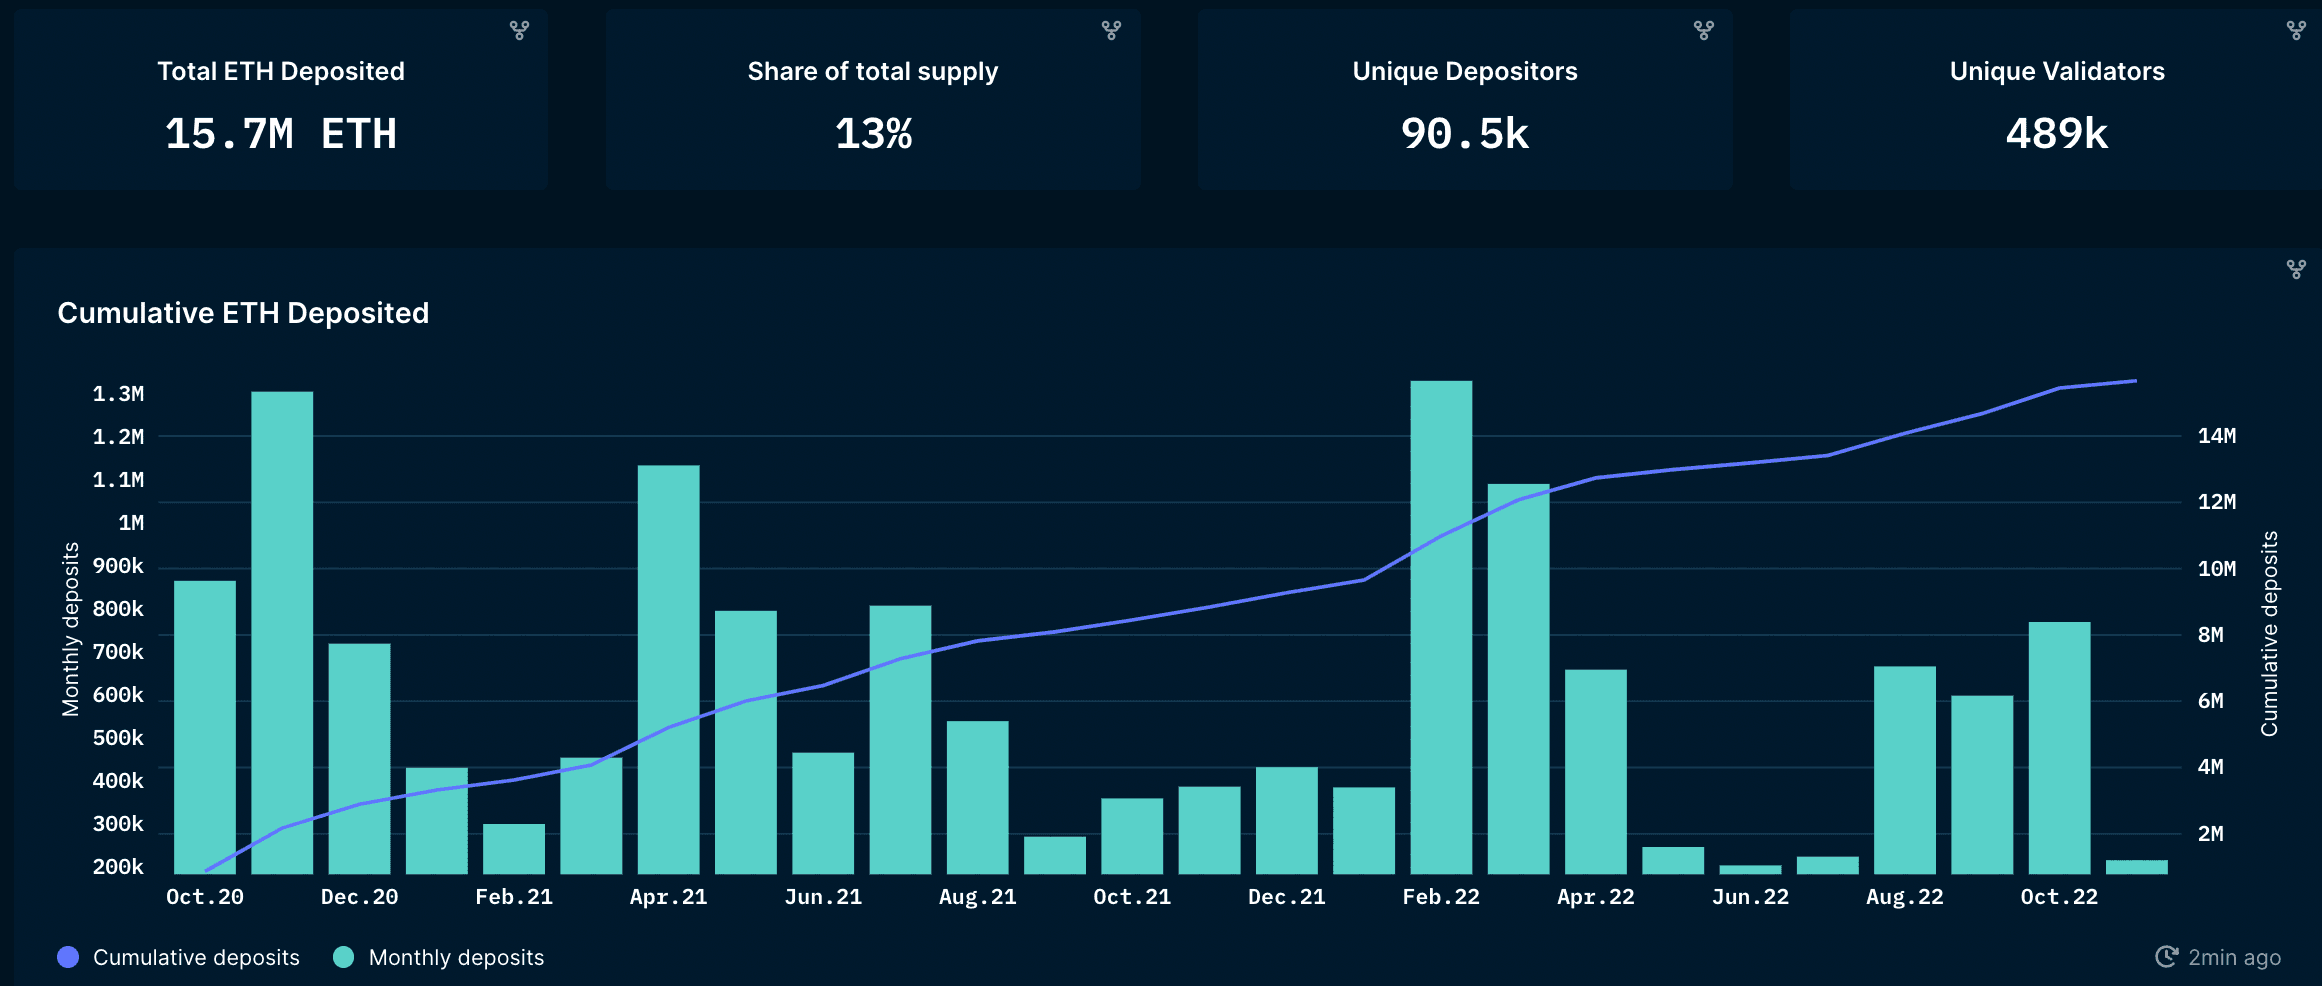
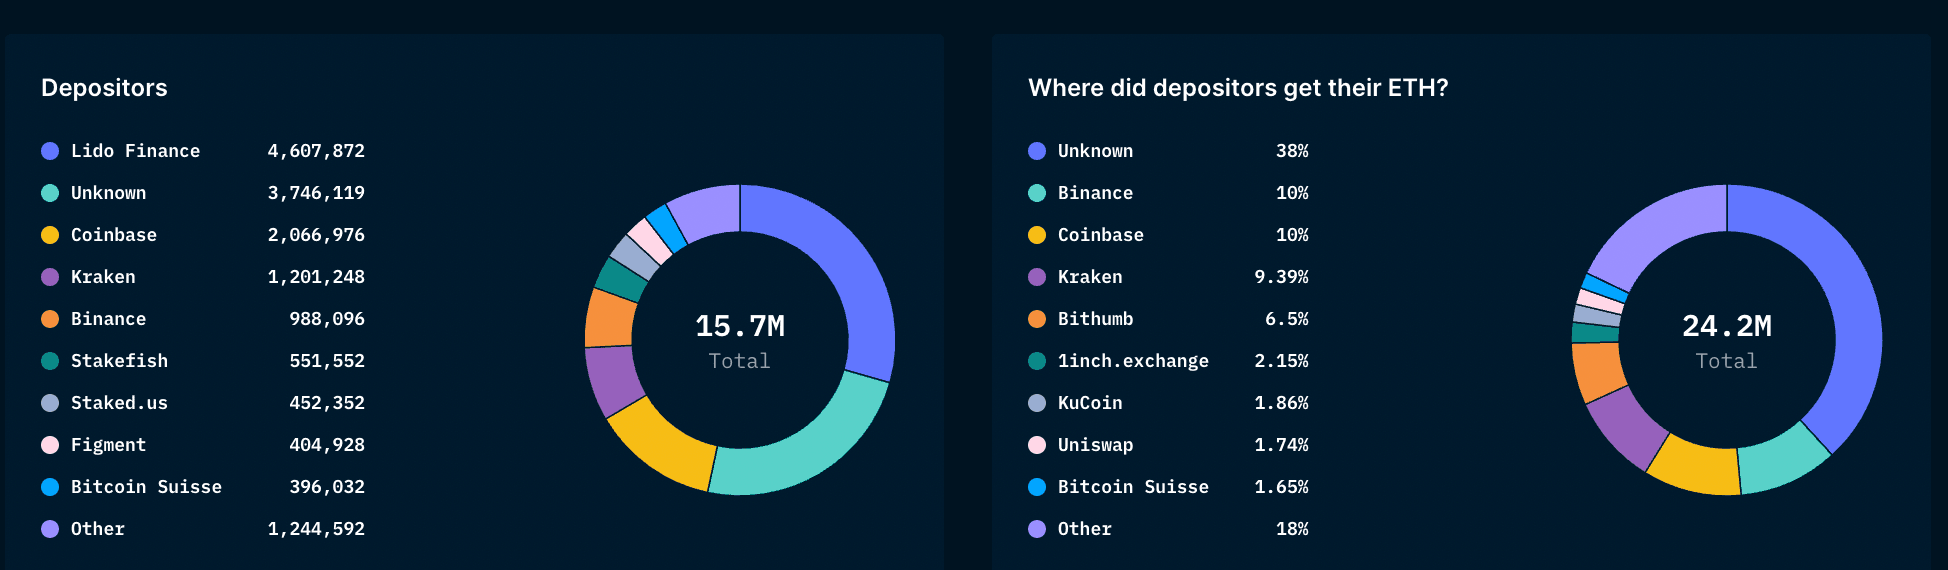
Source: Nansen ETH2 Dashboard
Read the full report here!
Blockchain Analysis: The Collapse of Alameda and FTX

Report Overview
Evidence vs. speculation on the collapse of FTX/Alameda: we dig through and interpret the immutable data on the blockchain to make sense of one of the largest events in crypto history.
Key Findings
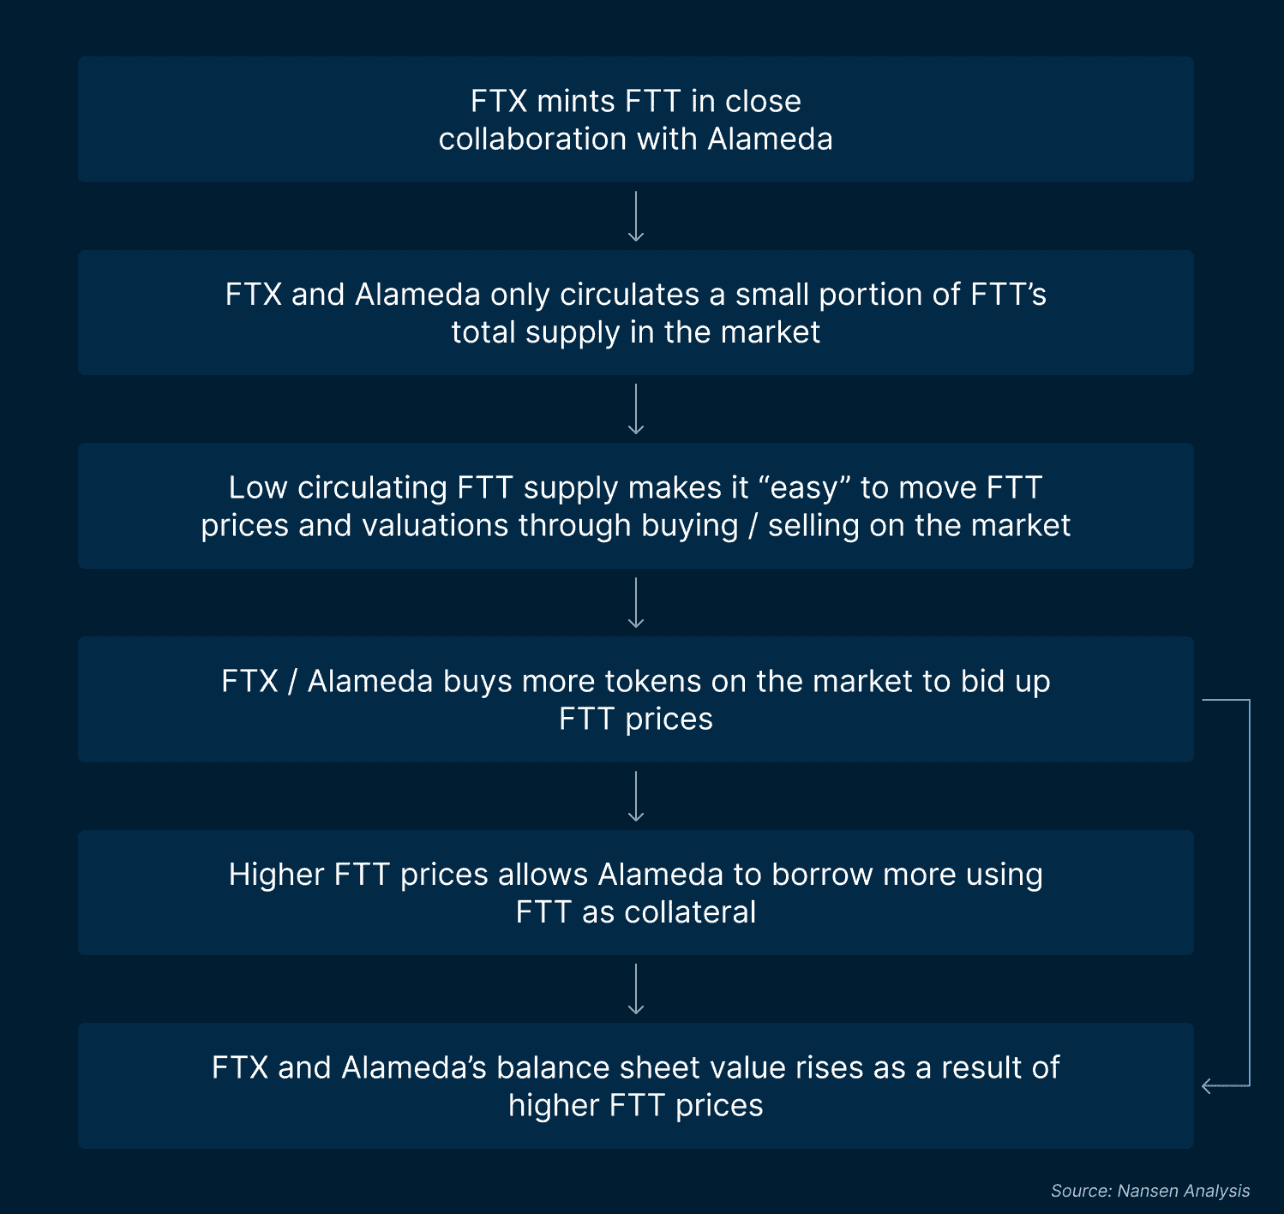
- On 2 Nov, CoinDesk published a piece revealing that ~40% of Alameda's $14.6bn assets on their balance sheet were held in FTT. Taking that as starting point and digging through on-chain data dating all the way back to the beginnings of FTX and FTT we discovered.
- Alameda and FTX may not have been clearly separated entities from the start.
- The majority of the token supply, consisting of company tokens and some unsold non-company tokens, had also been locked in a 3-year vesting contract whose sole beneficiary was an Alameda-controlled wallet.
- ~280m of the 350m FTT supply (~80%) was found to be held by FTX alone, with a considerable proportion of FTT volume (FTT transactions amounting to billions) flowing between various FTX and Alameda wallets.
- Both Alameda and FTX had controlled the majority of the FTT tokens (~90%).
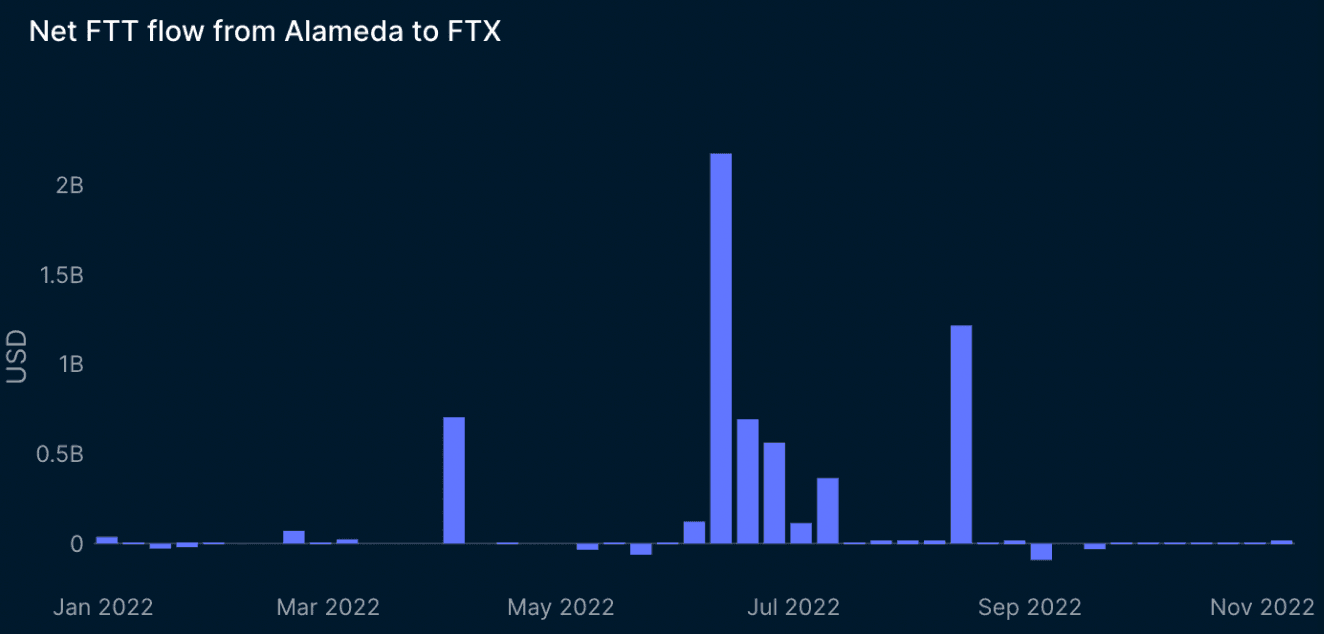
- Alameda likely used FTT as collateral to borrow funds from several third parties. With the fallout of Terra and 3AC in May/June, they would have experienced liquidity issues. Our on-chain data indicates that they might have then used the FTT to secure a loan directly from FTX instead.
- Amidst the collapse of 3AC in mid-June 2022, Alameda sent ~163m of FTT to FTX wallets, worth ~$4b at that time.
- The $4b transaction volume interestingly coincides with the $4b loan figure from FTX to Alameda that was revealed in the Reuters interview.
- However, we cannot confirm a flow from of funds from FTX to Alameda on-chain.
- Lastly, our on-chain data also revealed that Alameda was unlikely to have the necessary firepower (based on known wallets on-chain) to purchase the entirety of Binance’s FTT holdings ($584m worth at that time) as claimed by a tweet from their CEO.
Key Data and Charts
Read the full report here!
Section 2: DeFi
What are Early GMX Stakers Doing?

Report Overview
- GMX is one of the most profitable protocols today, generating over $400k in weekly average fees; even surpassing Bitcoin, Aave, Curve. Given most of the fees accrue back to stakers, the earliest GMX stakers have done extremely well. This analysis dives deeper into their portfolio allocation, finds potential new opportunities and shows their GMX trading behaviors - are they selling, staking, etc.
Key Findings
- As of 15 Oct 2022, 25 out of the 100 addresses had completely exited their staked GMX position. Compared to the previous snapshot of 40 addresses staking >9,000 GMX, the pool has been reduced to 22 addresses.
- Wallet 0xf73 (🤓 Smart Dex Trader) has been an active GMX staker since 11 September 2021. Despite the volatility in GMX prices, this address continues to hold its GMX position with extreme conviction.
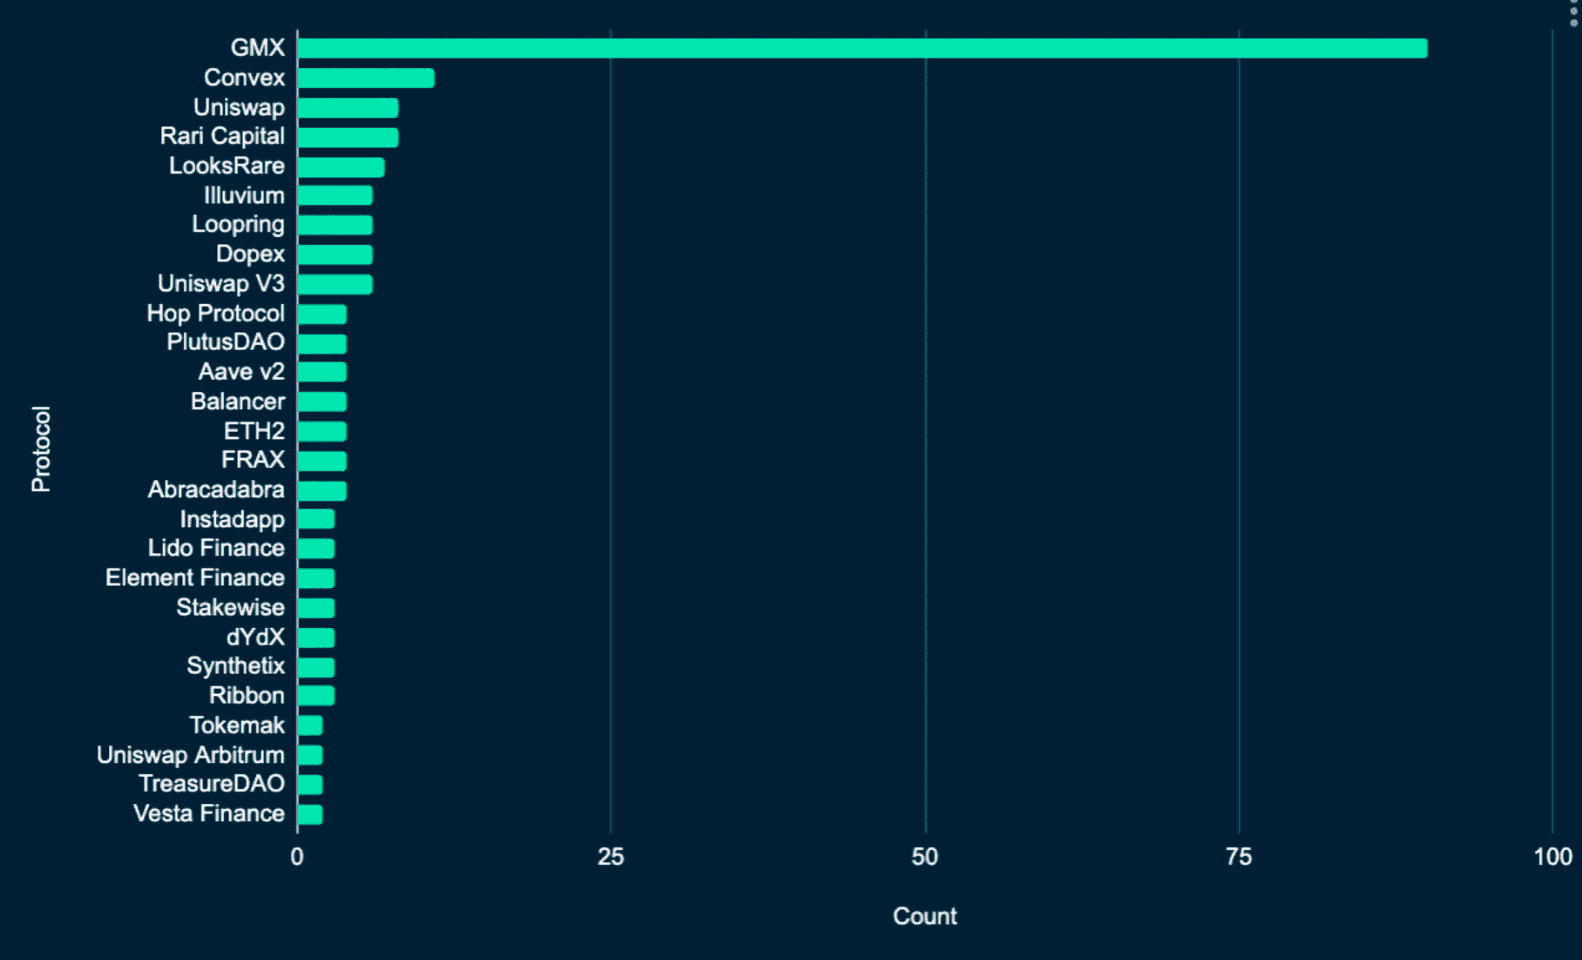
- Besides GMX, a large portion of these addresses are diversified across blue-chip farms. Some of the top protocols are Convex, Uniswap, Rari Capital, LooksRare, Illuvium, Loopring, Dopex, Hop Protocol, PlutusDAO, etc.
Key Data and Charts
Top Used Protocols by Early GMX Stakers
Read the full report here!
Airdrop Report: Utilizing Nansen On-chain Data

Report Overview
- In the current sideways market, positioning oneself for an airdrop is a rather low-risk way to gain capital. We track the best airdrop hunters on-chain and breakdown all of the potential airdrops based on on-chain activity.
Key Findings
- Based on our findings from the top interacting contracts across Ethereum, Arbitrum, and Optimism, it shows that there are around 15 contracts with a significant number of ‘Airdrop Pro’ wallets that have yet to release a token. The prominent ones that have confirmed the existence of a token include Blur, Orbiter Finance and Shell Protocol.
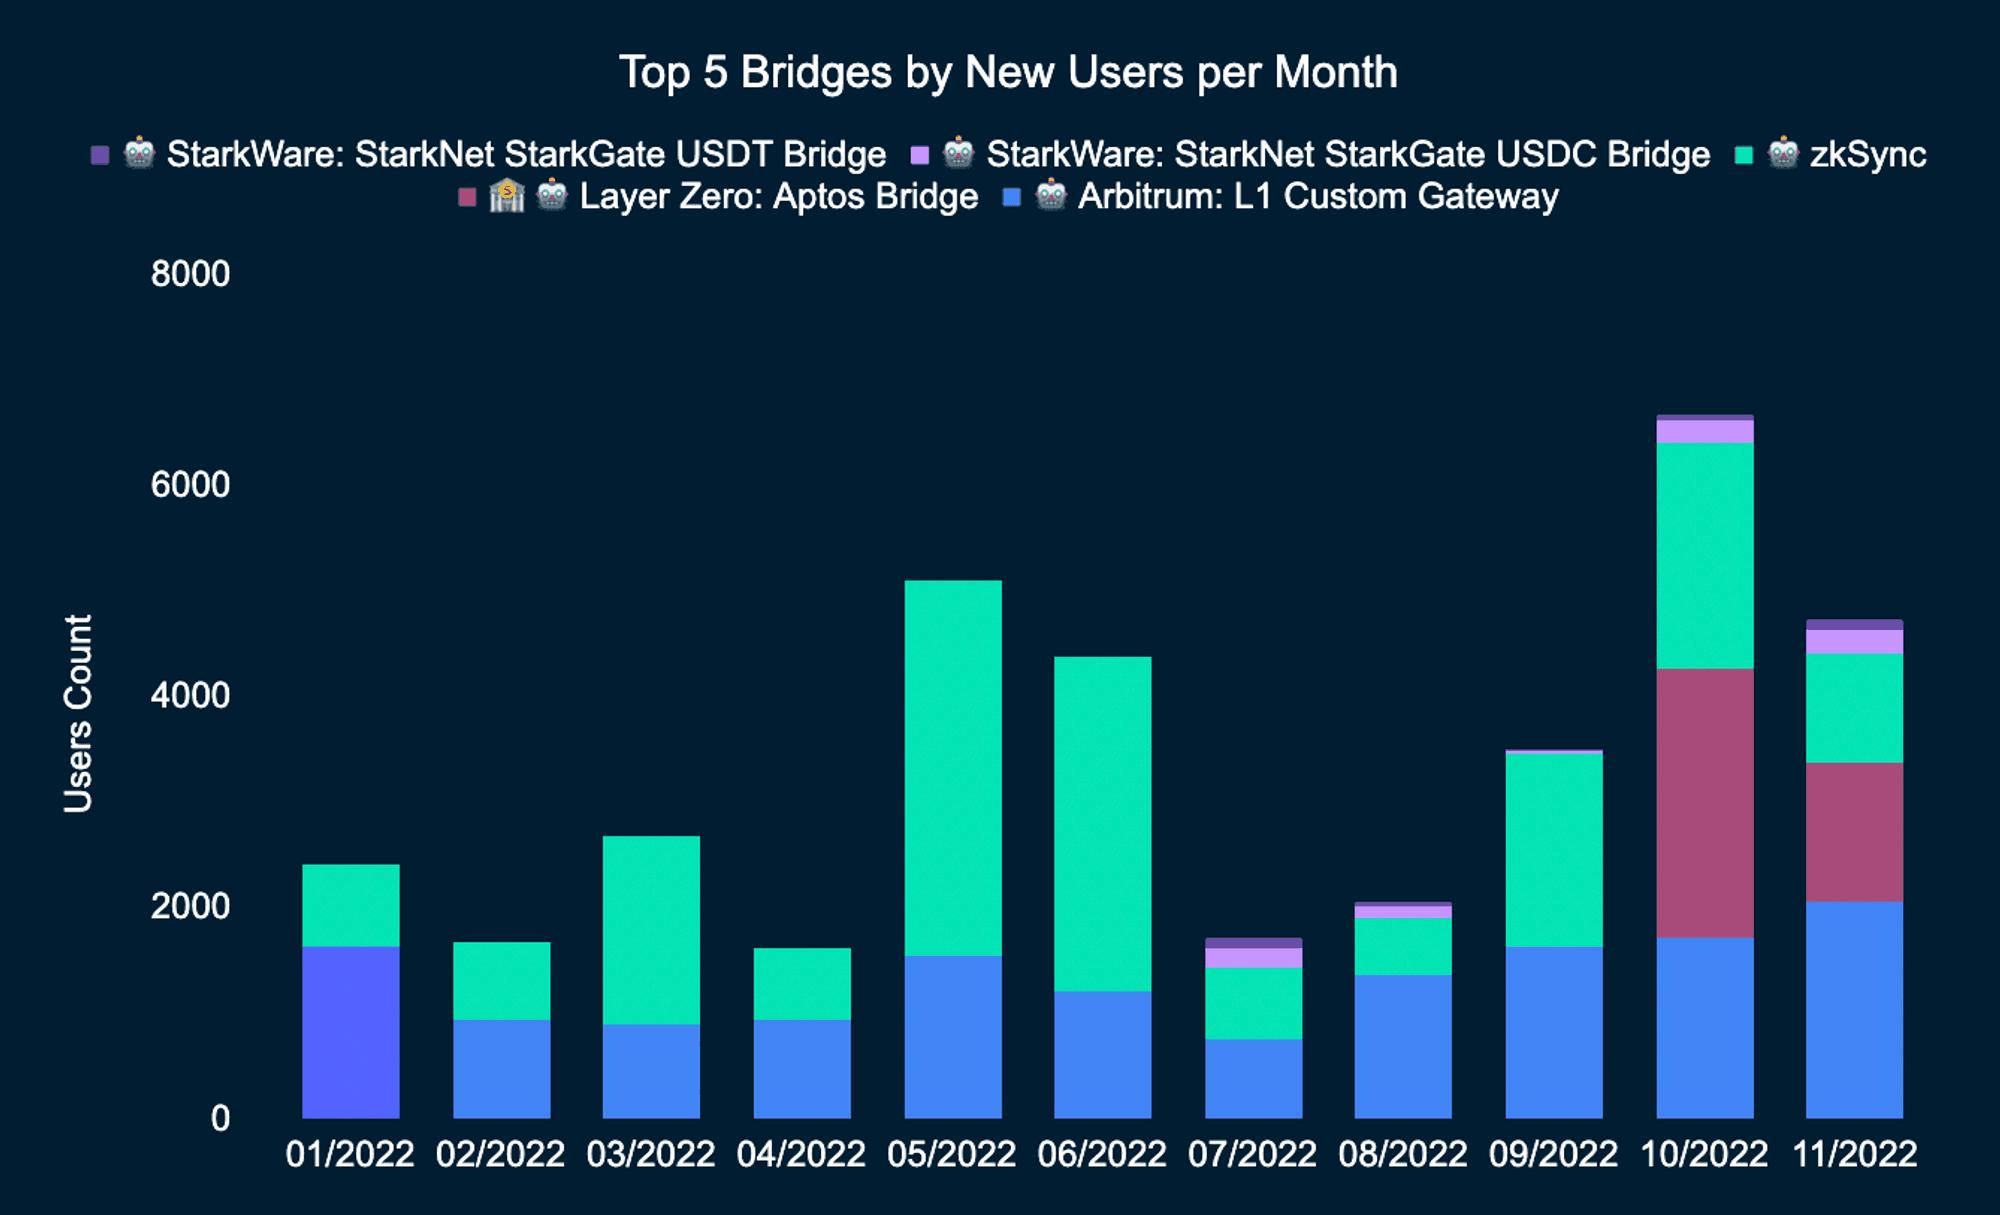
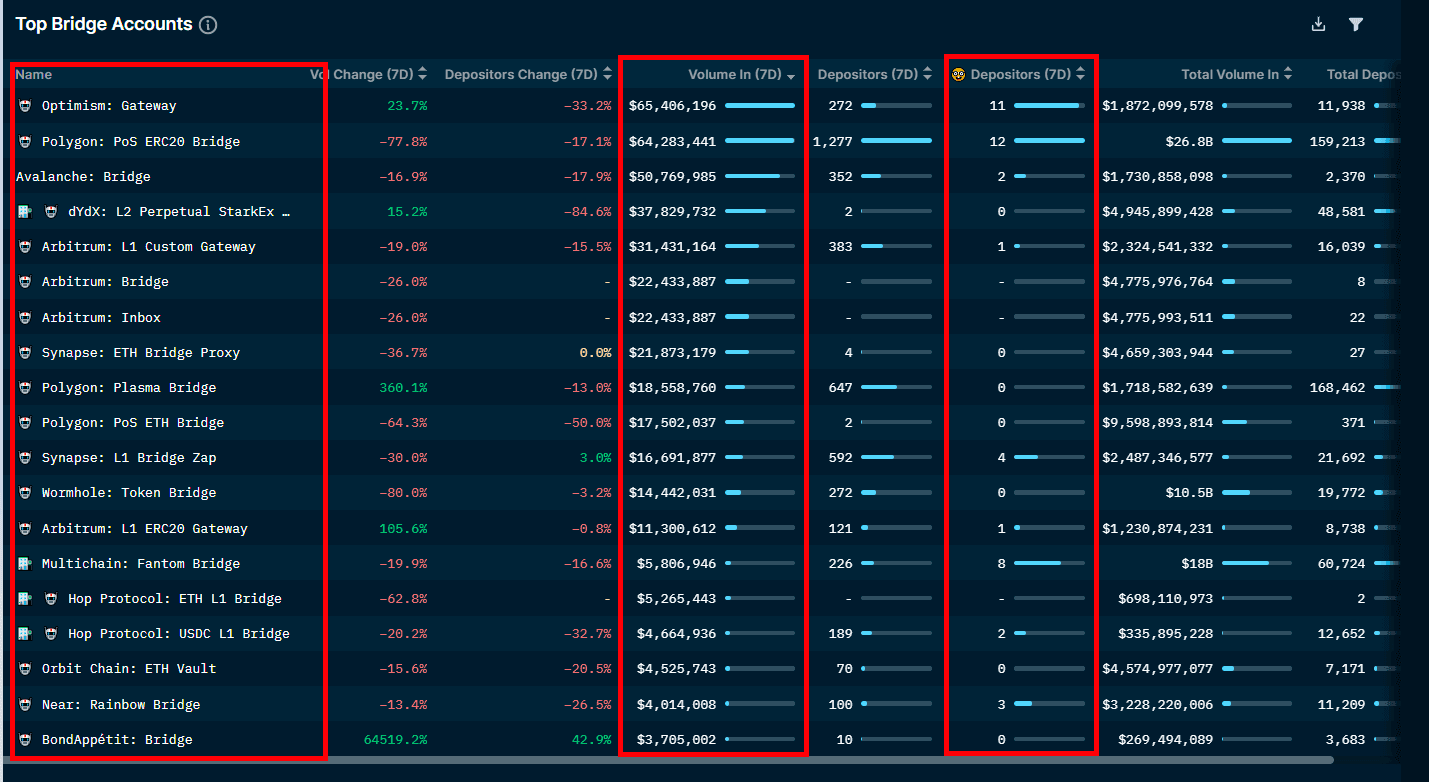
- Bridges have also seen an increase in volumes in the past year - attributed to numerous new chains appearing, with speculations for an airdrop. The top bridges to chains that currently do not have a token include Arbitrum, Layer Zero, zkSync and StarkWare.
- Most people are transferring anywhere between $10 and $1000 when using the bridges. Arbitrum and Layer Zero bridge users are two exceptions. The majority of Arbitrum users are transferring more than $1000, and the majority of Layer Zero users are transferring less than $10.
Key Data and Charts
Ethereum
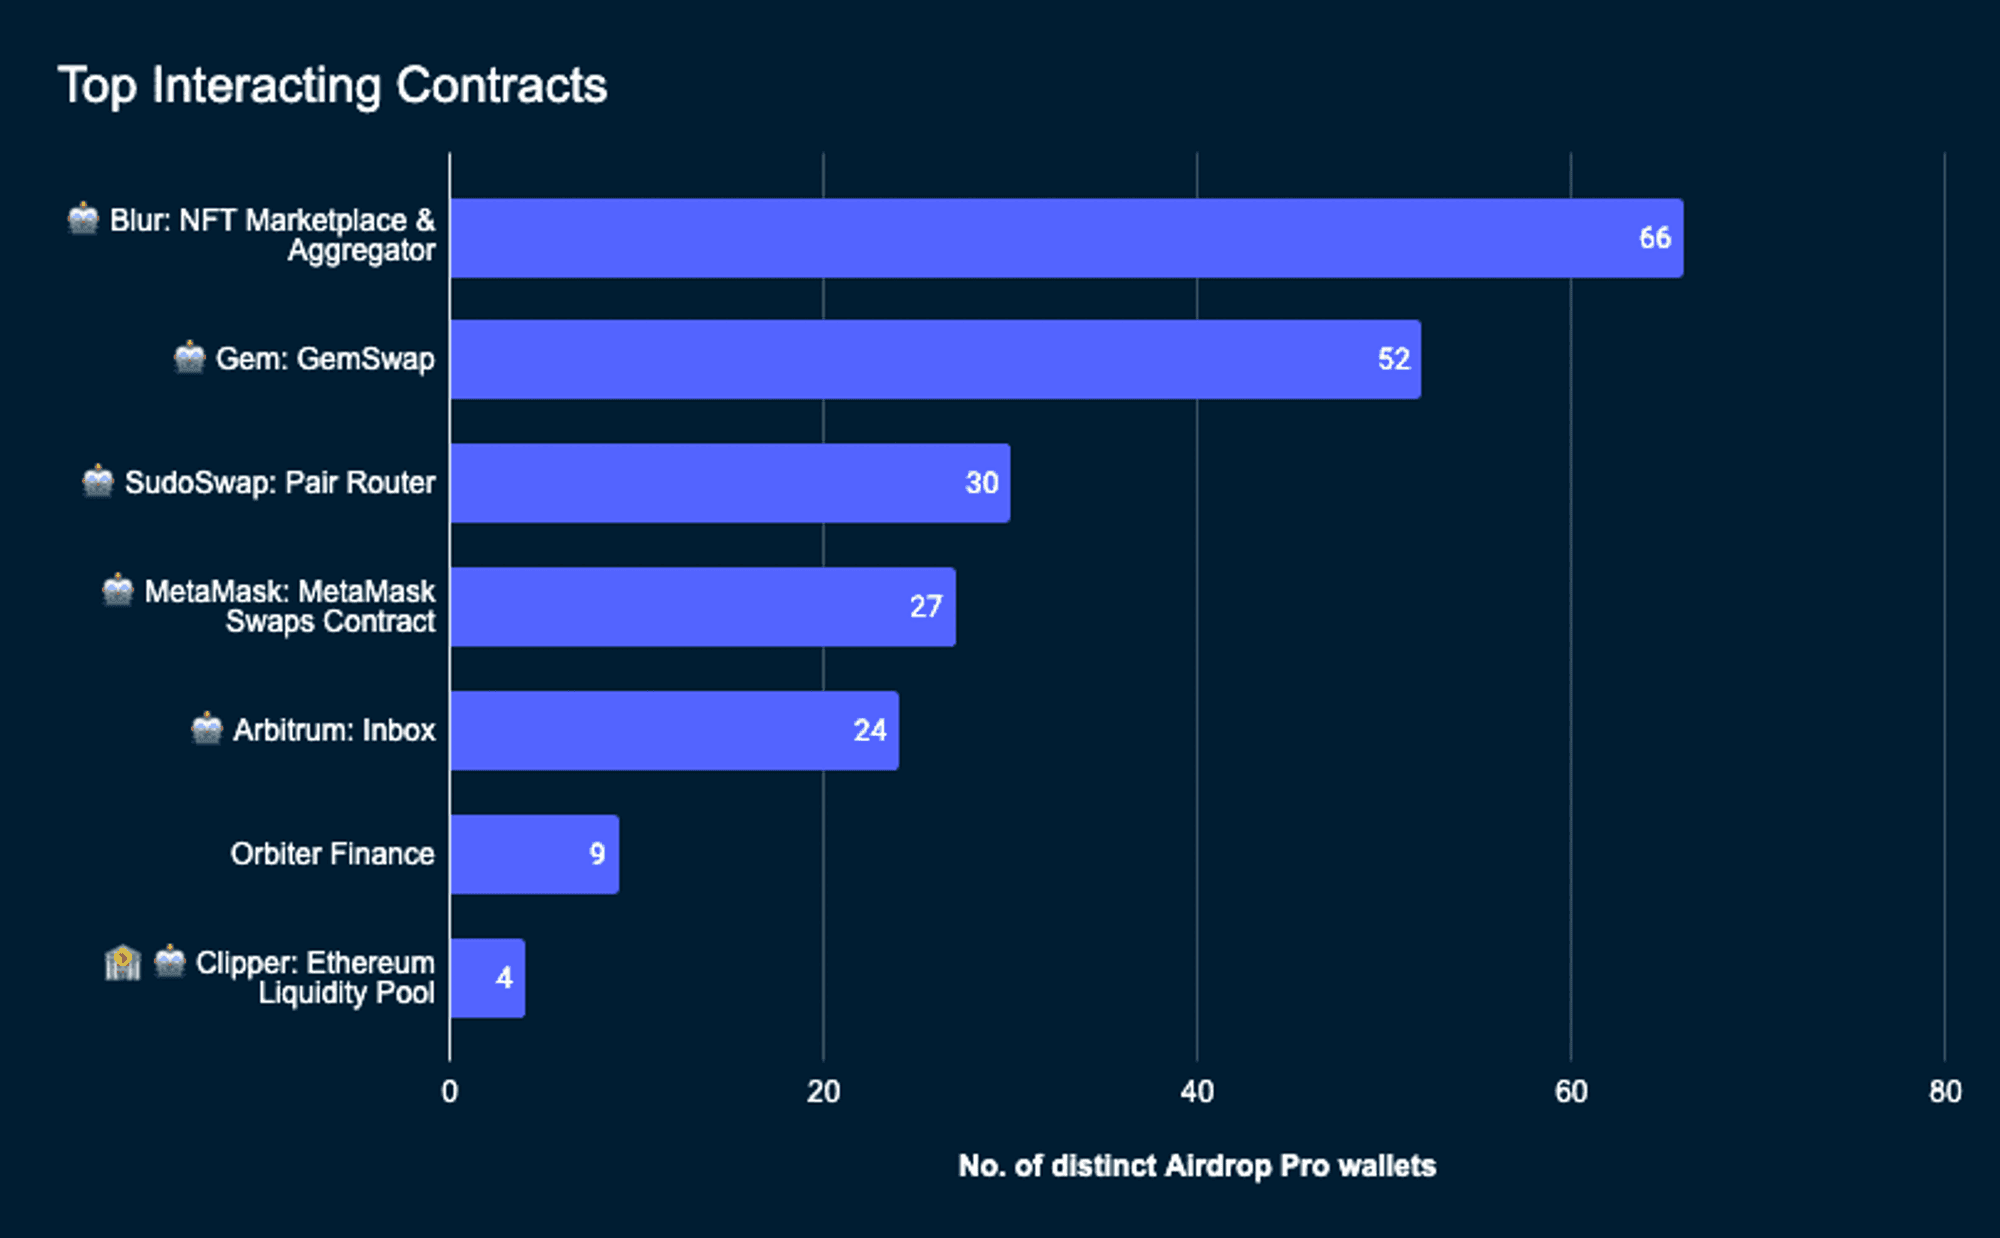 Source: Nansen Query
Arbitrum
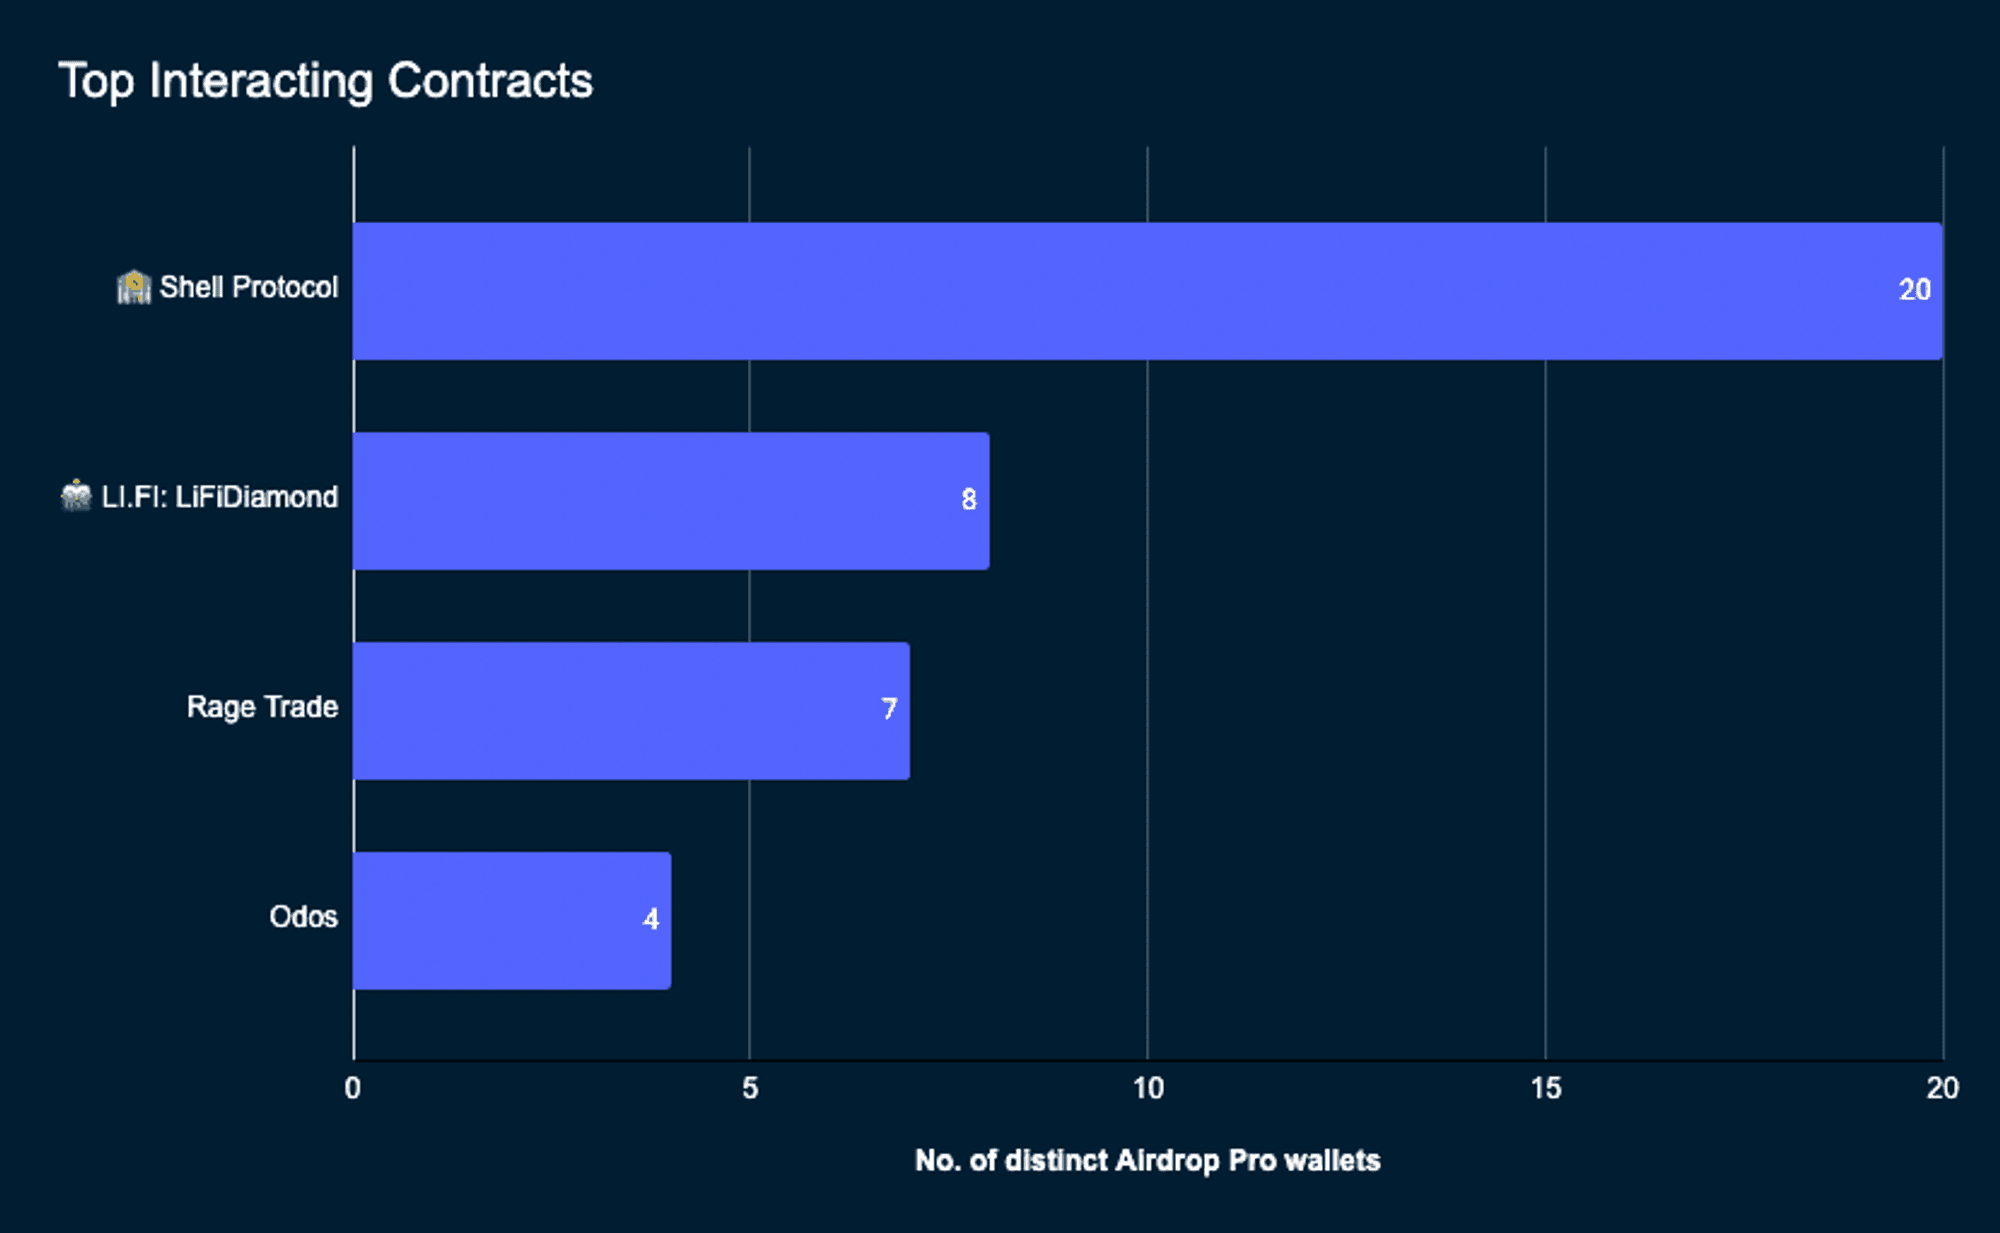 Source: Nansen Query
Optimism
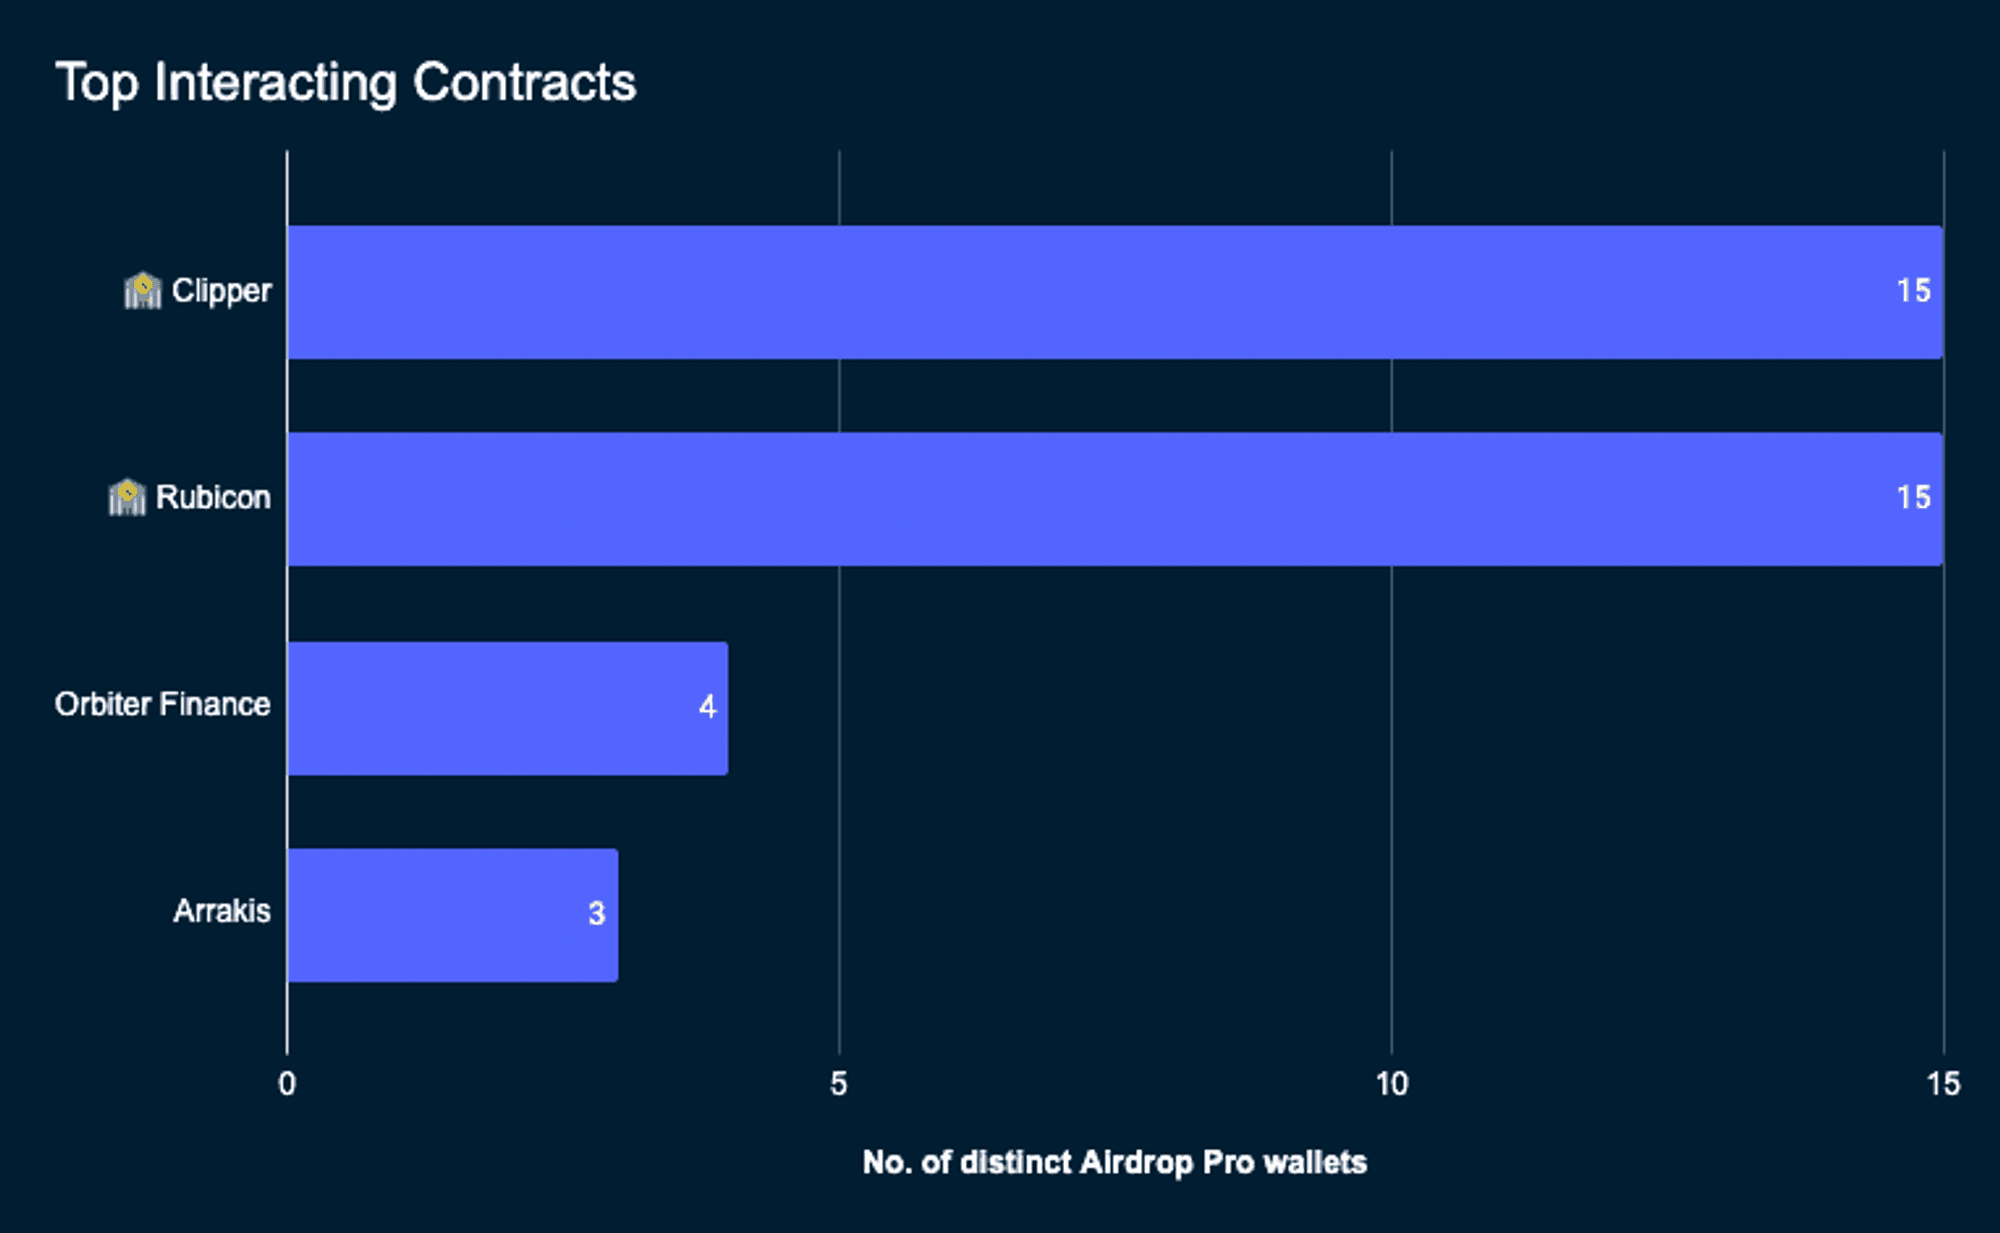 Source: Nansen Query
Bridge User Activity
 Source: Nansen Query
Read the full report here!
Fuel: A Fresh Approach To Scaling Blockchains

Report Overview
- The execution layer has become increasingly competitive over the past year, with the growth of Optimistic Rollups and the advances being seen in ZK-Rollups and validiums. Fuel is focusing on long-term scalability by modularizing the execution layer with the goal of minimizing state. Fuel has created its own virtual machine to achieve this end, opting to start afresh and avoid the constraints of building solely within the EVM.
Key Points
- Fuel announced an $80m investment round in September this year, which should give the project good resources to kickstart the ecosystem. They just also just launched their second public testnet and a public forum for those interested in Fuel and the Sway programming language.
- The team behind Fuel created the Sway programming language with the goal of optimizing the developer experience and enabling superior applications. It is a domain-specific language inspired by Rust but designed for smart contracts. Sway is designed to minimize costs and maximize contract-level safety.
- Fuel aims to have semi-stateless execution, account abstraction by default, and parallel transaction execution through a UTXO blockchain model to give a superior developer and user experience for the next generation of blockchain dApps.
Key Visualization
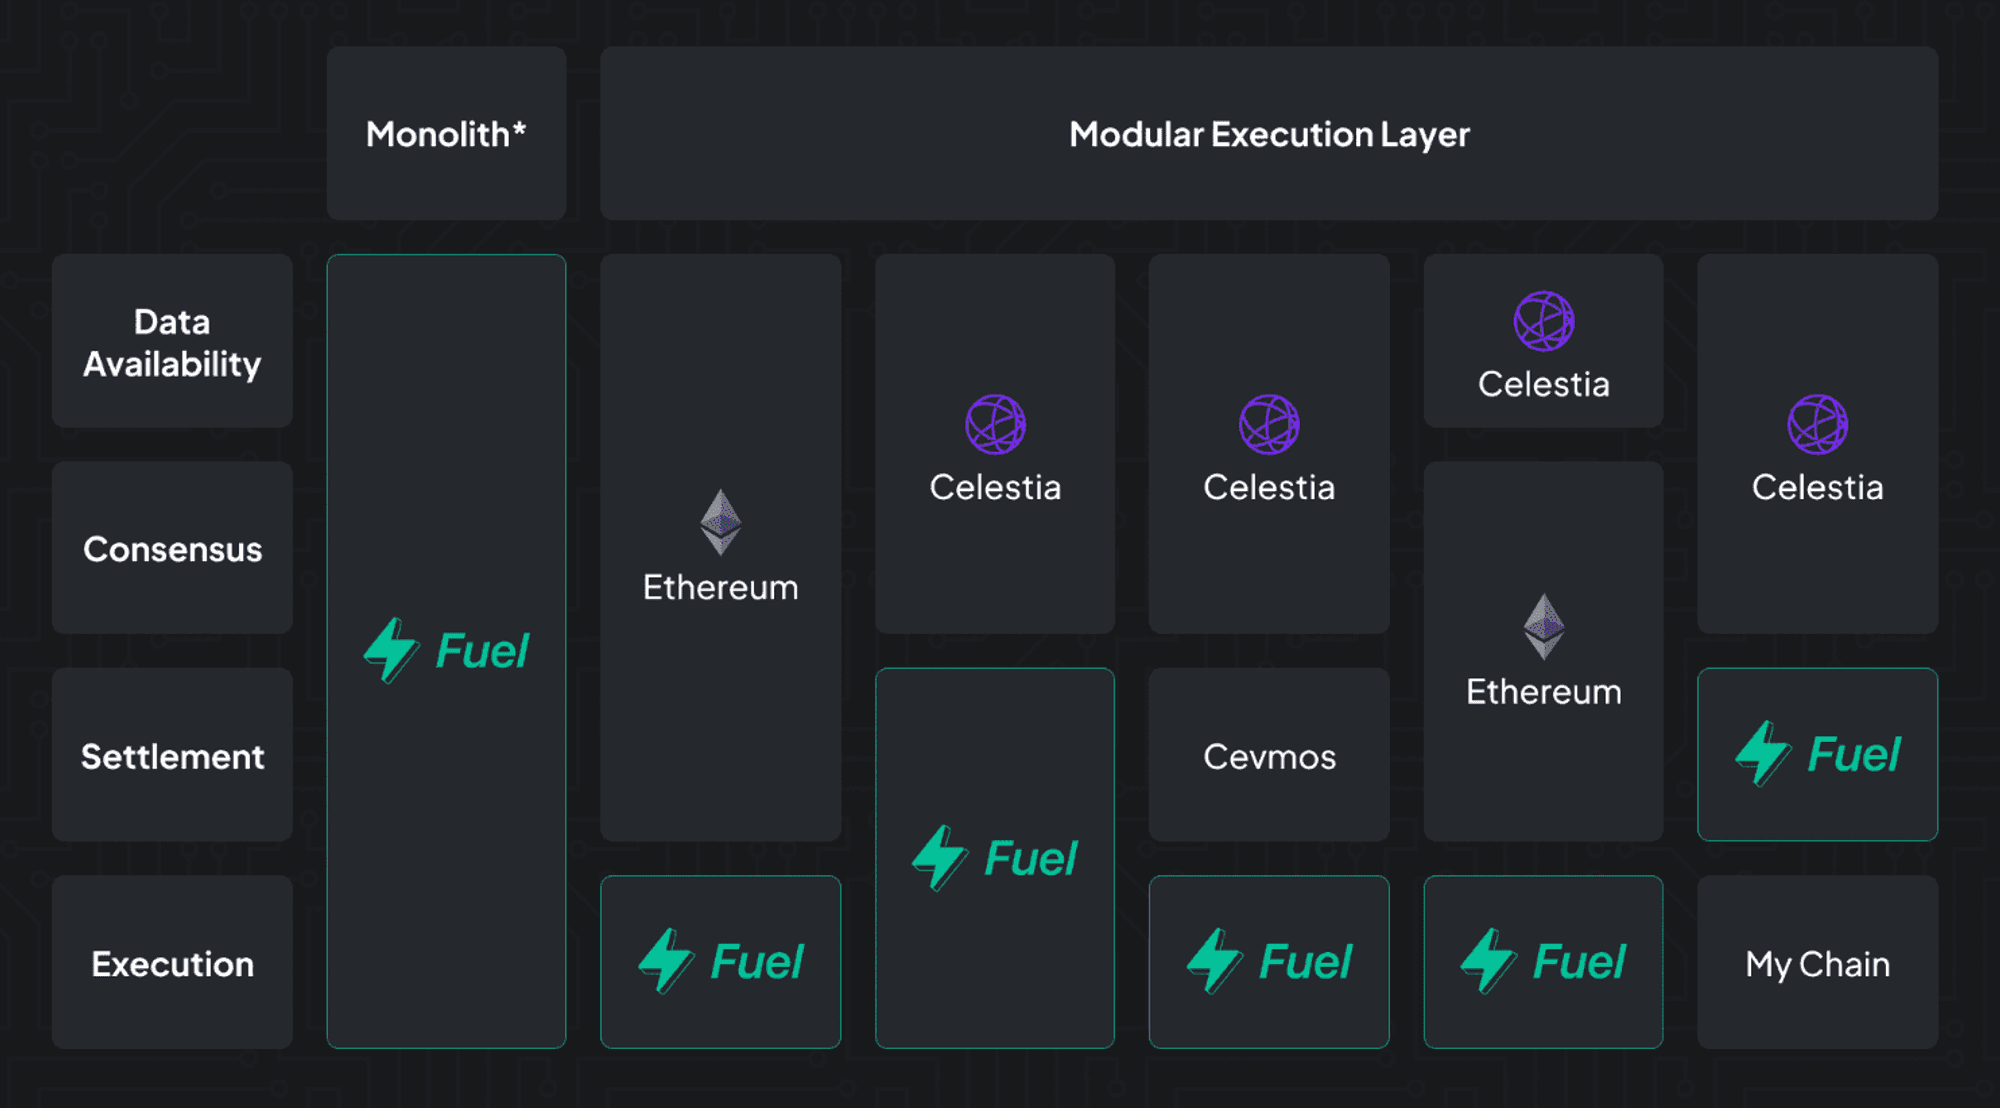 Source: Fuel
Read the full report here!
zkSync: The Answer to Ethereum Scaling?

Report Overview
- zkSync is arguably the most exciting L2 right now. It has deployed its mainnet ‘Baby Alpha’ and is expected to launch its full mainnet by the end of this year or early Q1 2023. It will be the first EVM-compatible Validity Rollup, and 150 projects have indicated they will deploy there, including most of the DeFi blue-chips.
Key Points
- zkSync’s latest funding round of $200m and total ecosystem funding of $485m make it one of the best-capitalized L1/L2s with an exciting scaling roadmap.
- Native account abstraction can help significantly improve the user experience, potentially opening up crypto to mainstream use. It will be interesting to see what account abstraction features will be added in the short-to-medium term and if they can live up to their promise.
- L3 will be a key battleground for ZK-Rollups, and zkSync is seeking to become the accepted standard for hosting L3s which can be securely interoperable with one another through cryptography. Their L3 Proof of Concept will be live in Q1 2023 which is something to pay close attention to. It will be interesting to see to what extent L3s can be built with arbitrarily different design mechanisms and how customizable L3 will be.
Read the full report here!
Osmosis: The DeFi App-chain

Report Overview
- Osmosis is a DeFi app-chain on Cosmos aiming to deliver a vertically integrated DeFi experience that bundles together many DeFi primitives into a single easy-to-use platform. It sits at the center of the Cosmos IBC ecosystem, with over 125,000 monthly active users, the highest TVL within the Cosmos ecosystem, and the most IBC connections, among many other metrics. It has many new integrations and features being built out. Read the report to find out about the app-chain thesis and how Osmosis is tackling a unified DEX experience that will aim to compete with the likes of Binance.
Key Findings
- Osmosis has many upgrades planned for enhancing the DEX and is supporting over 25 apps that plan to launch in Q1 of 2023. They just added stableswap to their core DEX and are actively working on supporting concentrated liquidity as well which is expected in Q1 of 2023.
- Osmosis continues to ship new features and highlights the benefits of being an app-chain with novel features such as Superfluid Staking. They are building other novel features to enhance the UX by combatting MEV through Threshold Encryption and are internalizing ‘good’ MEV by bringing a revenue-sharing protocol module from Skip Protocol. Skip’s model predicts Osmosis could capture $100m a year for the community if Osmosis rivals the volumes seen on Uniswap today. This allows the protocol itself to capture the MEV and distribute it across stakers/LPs which is a lot different given it's completely on-chain and does not rely on the trust of external validators to share these profits.
- Shared security is currently not existent in the Cosmos ecosystem but there are many solutions being worked on - Interchain Security v1, Celestia and now ‘Mesh Security’. Mesh security is similar to Eigenlayer’s Restake idea, but instead of having validators provide data availability, it will allow for many Cosmos chains to secure one another bilaterally.
- There is a working prototype being worked on here, and this will allow for increased levels of security for sovereign layer 1s and provide stakers with more value accrual via additional staking rewards. Power laws will surely take effect, so Mesh Security will help high market cap chains like Osmosis be a significant provider of shared security which would benefit stakers looking to earn more yield.
Read the full report here!
OG DeFi Protocols: An Update

Report Overview
- The total TVL of DeFi has dropped from its highs of ~$180b at the end of last year, to $41b, and slower activity has also resulted in a drop in most of the token prices - even for OG DeFi protocols that represent a significant share of today's DeFi activity. There are many exciting features in the roadmap for these protocols, which this report investigates.
Key Findings
- Aave and Compound are very similar lending protocols but Aave’s future roadmap seems more ambitious with the developments in the pipelines such as GHO and Lens Protocol. Compound pales in comparison given that there are no significant updates in the pipeline, and its latest changes of introducing markets with single borrowable asset will not be a significant catalyst for the protocol. However, these two protocols make key design tradeoffs that will be key to measure moving forward for investors of varying risk types.
- Uniswap has an average of 10x trading volume over Sushiswap despite the fact that UNI holders do not receive revenue share from the protocol, which would signify that it is not much of an incentive to most users. Uniswap is able to offer better trades with its concentrated liquidity model which would be the main reason why it triumphs over Sushiswap.
- Uniswap has introduced 1bps fees for stableswaps in the past few months, which makes it a significant competitor to Curve. Dominance over trading volume for stable pairs have shifted from mainly Curve to an equal share between Uniswap and Curve.
Key Data and Charts
% price changes of DeFi Blue chips over 2022
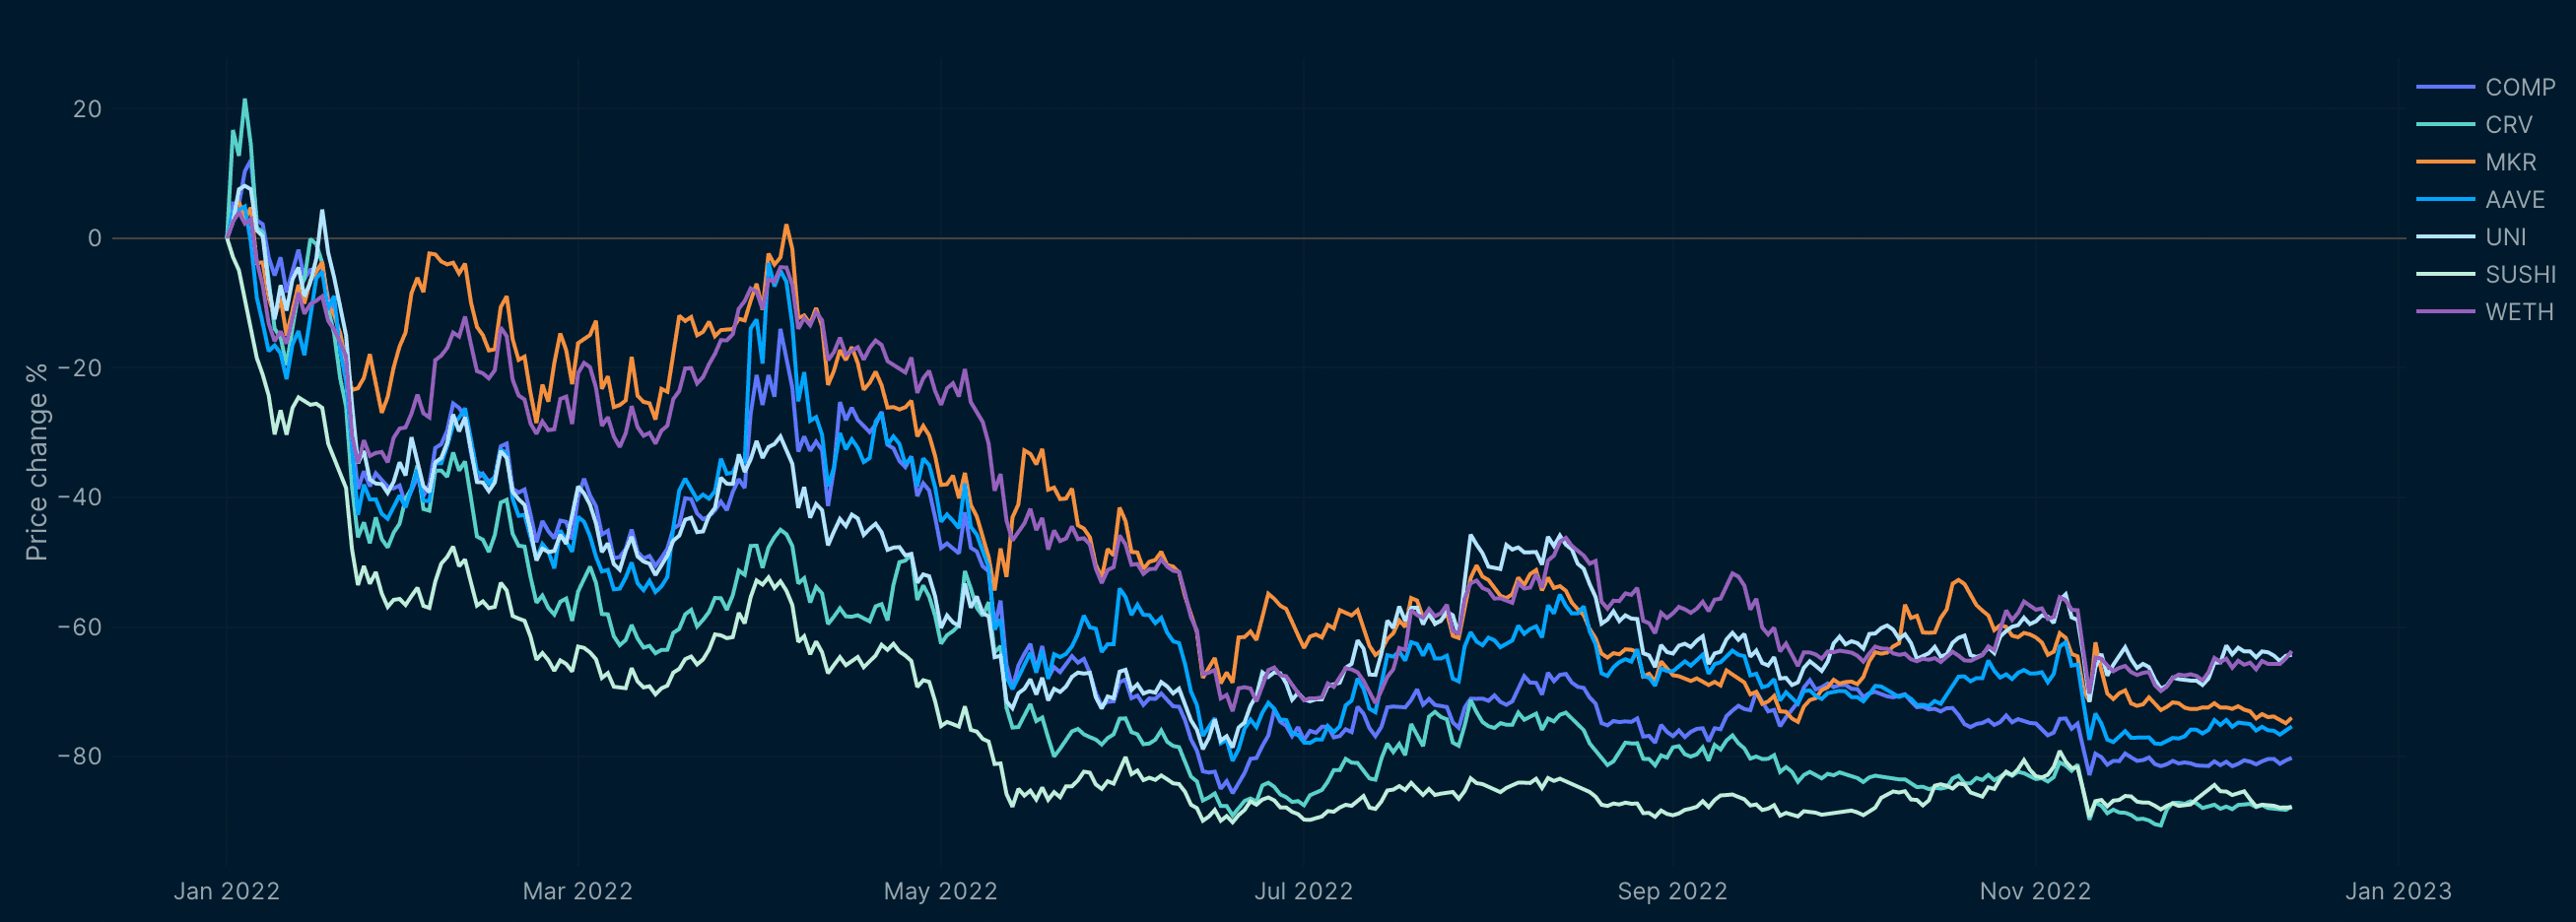 Source: Nansen Query
Read the full report here!
Section 3: NFTs
Navigating Crypto’s Peaks and Troughs: Can We Have A Sentiment Indicator for NFTs?
Report Overview
- While several micro and macro financial indicators are relied upon when pricing traditional financial assets, the nascent nature of NFTs and the broad crypto market means that there are few or limited reliable market indicators that help to determine the asset’s valuation and market sentiment. Alongside the absence of reliable metrics, the NFT market sentiment is also driven by investor speculation (see Gunay & Muhammed, 2022).
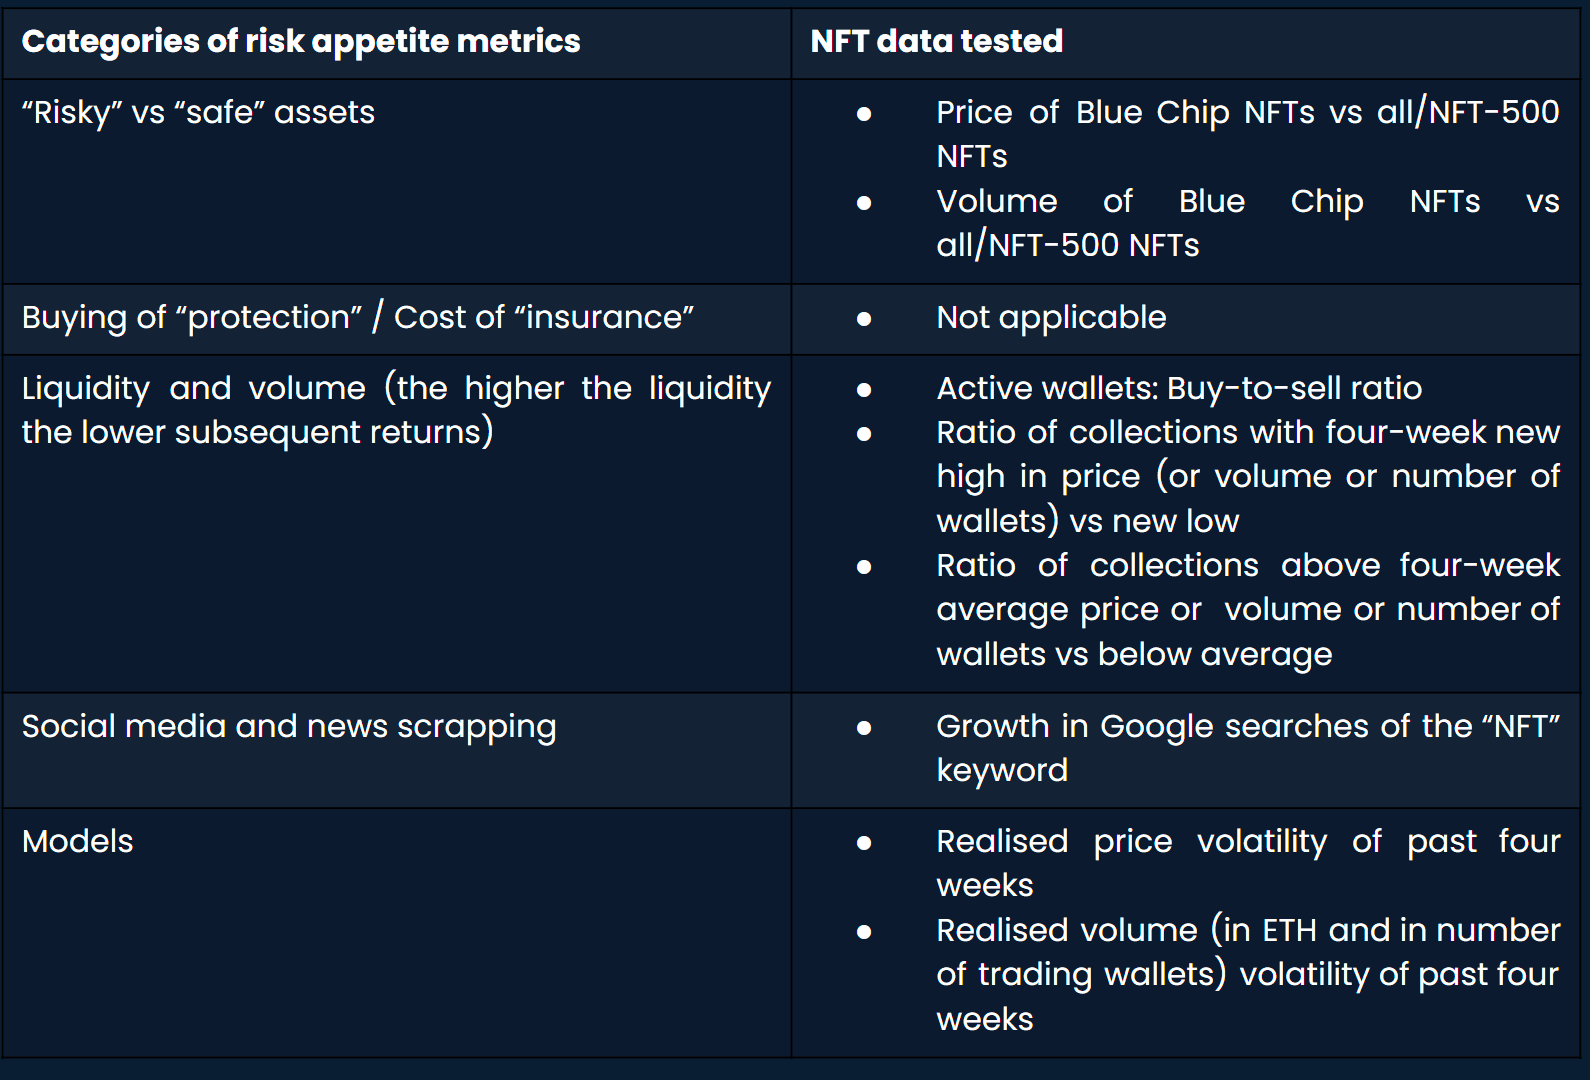
- This paper focuses on NFTs as an asset class (which will subsequently be referred to as the “NFT market”) rather than NFT collections of individual assets. Our main objective is to ascertain investor sentiment proxies that can account for NFTs’ price action. Investor sentiment proxies selected for this analysis include models such as regression of price on past realised volatility and quantitative metrics to gauge volume, sales velocity, and even social media occurrences of “NFT” searches.
Key Findings
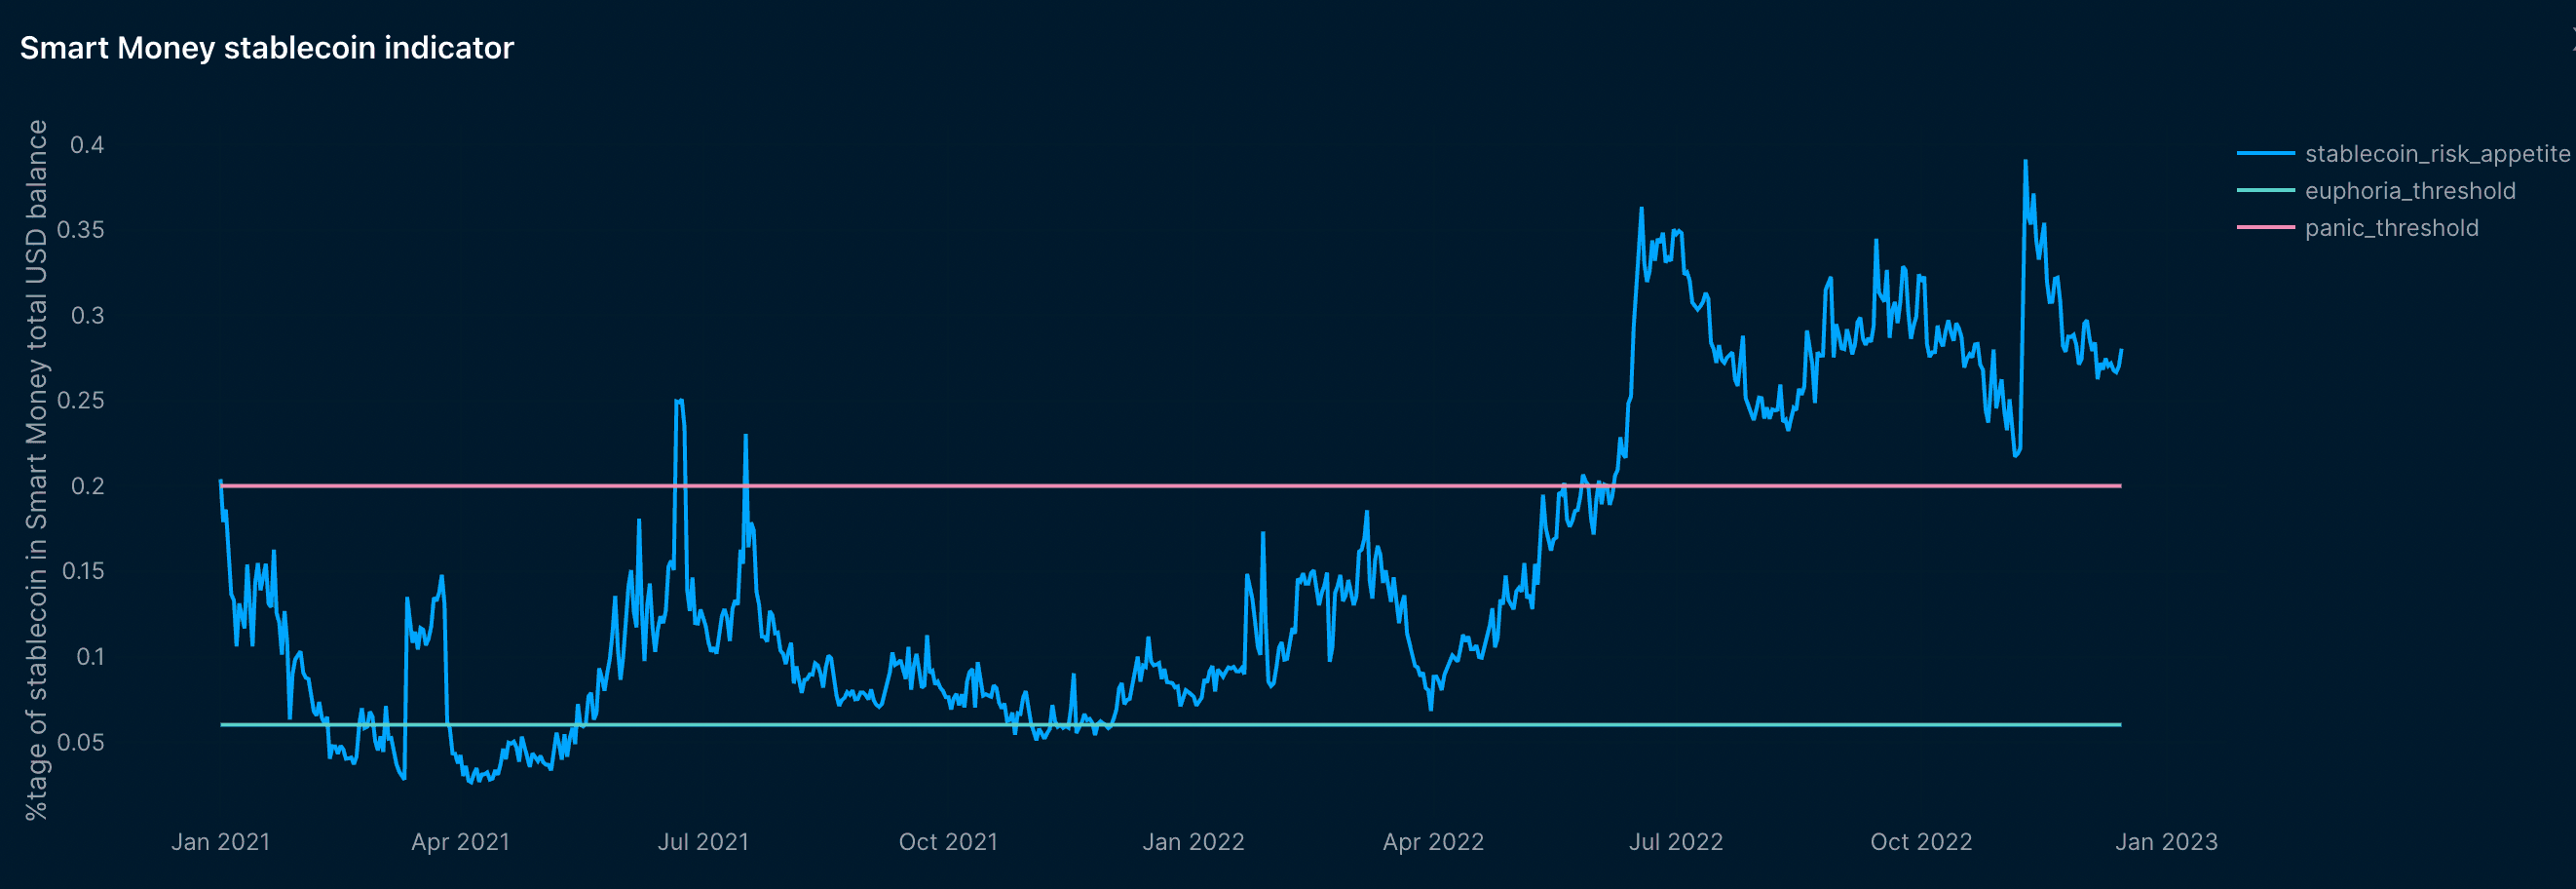
NFT vs fungible token correlations being weaker than inter-fungible-token correlations, Nansen developed an investor sentiment indicator specific to the NFT market based on two on-chain metrics:
- Trailing realised volatility of NFT prices: higher realised volatility -> higher forward weekly returns
Volume of Blue Chip NFTs vs all NFTs sales: higher ratio -> lower forward weekly returns.
Key Data and Charts
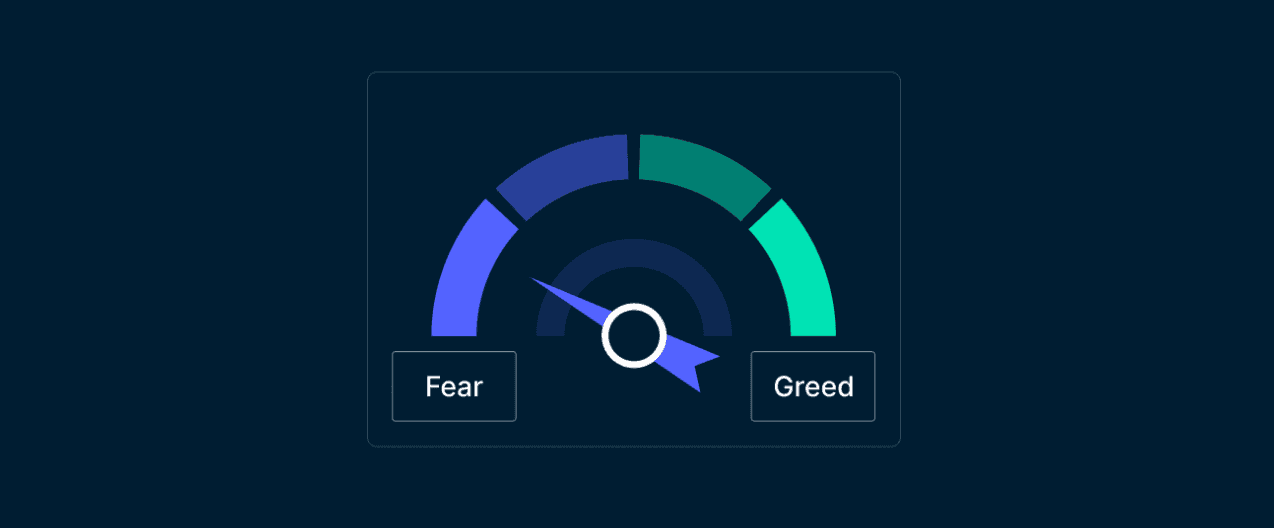
According to the Stablecoin Risk Appetite Indicator, investors are climbing a wall of worry, as crypto prices consolidate. A fall of the Indicator below the 11% threshold would trigger a risk-on signal, which would be synonymous with less bearish sentiment from Smart Money investors.
- Overview of factors and models tested to gauge NFT risk appetite
Read the full report here!
Top Traders for Gaming NFTs and Tokens

Report Overview
- In the first half of 2022, blockchain gaming deals accounted for $2.9B, roughly 35% of all gaming deals. VCs are still actively looking and taking bets on the future of blockchain gaming.
- This report aims to highlight the Top Traders for the gaming sector. More notably, the top ranking traders in Metaverse NFTs, Gaming NFTs, and Metaverse Tokens. The addresses that have demonstrated “Smart” on-chain behavior can be a good indicator to follow as the gaming industry becomes more mature over time.
Key Findings
- The top ranking Metaverse NFT Trader earned over 800 ETH and of the top 20 addresses for the metaverse category, their largest NFT holdings are The Sandbox, Otherdeed for Otherside and various others.
- The top ranking Gaming NFT Trader earned over 1041 ETH and of the top 20 addresses for the gaming category, their largest NFT holdings are Parallel and CyberKongz.
- The top ranking Metaverse Token Trader led the charts with $6.1M in realized profits, followed by the top ranking Gaming Token Trader ($5.6M) and top ranking Gaming Infrastructure Token Trader ($2.6M).
- Notable tokens held by the most profitable metaverse and gaming traders include StarLink, The Sandbox and Illuvium. These are promising Gaming NFTs that Smart Gaming NFT holders are accumulating at this point in time.
Key Data and Charts
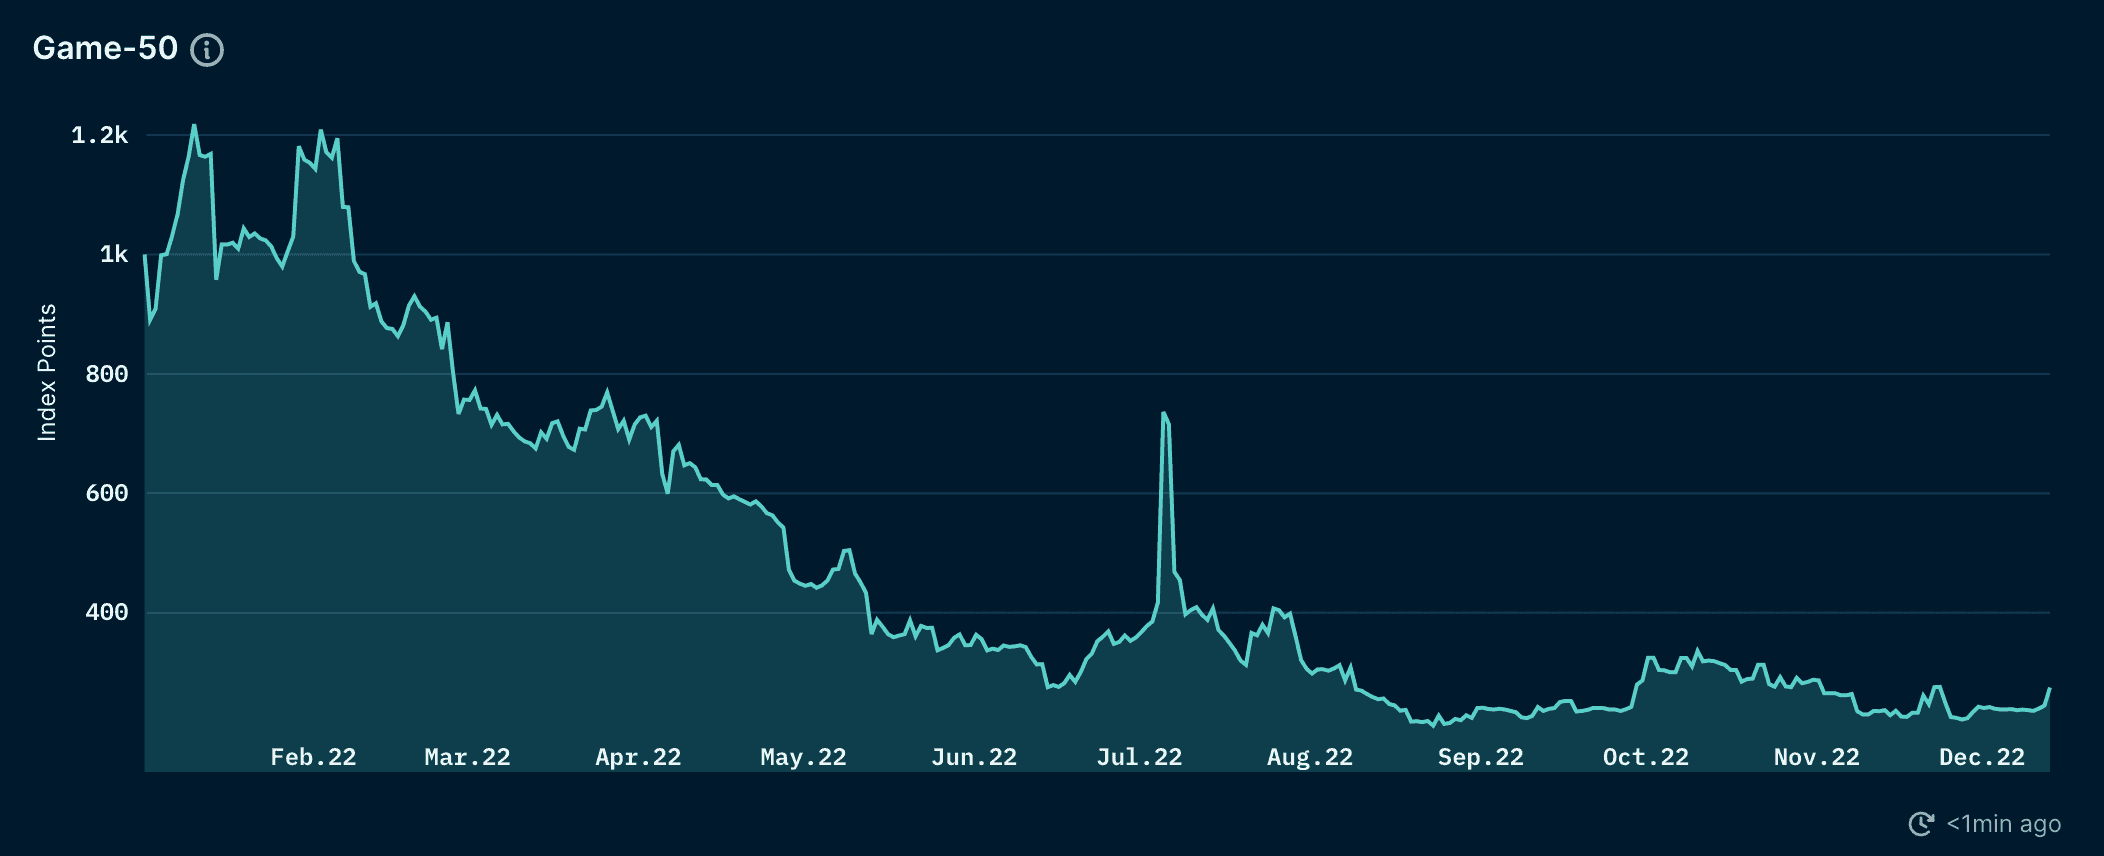
- Our Nansen Gaming-50 Index has fallen by 73% (ETH) YTD and 90% (USD). Despite the collapse of the gaming industry as seen in the gaming index, blockchain gaming is still dominating VC funding deals.
- Top Addresses with Realized Profits for Metaverse NFTs
| Address | Spent | Revenue | Profit | Sales | Profit Multiple | Profit/Sales |
|---|---|---|---|---|---|---|
| 🤓 lootez.eth | 180.12 | 982.37 | 802.25 | 671 | 4.45 | 1.20 |
| 🤓 "mr" on OpenSea | 46.77 | 674.38 | 627.61 | 85 | 13.42 | 7.38 |
| "79A5" on OpenSea | 86.00 | 546.38 | 460.40 | 213 | 5.35 | 2.16 |
| 🤓 "0x4595FF" on OpenSea | 165.38 | 604.74 | 439.35 | 128 | 2.66 | 3.43 |
| 🤓 neometa.eth | 58.79 | 448.13 | 389.34 | 211 | 6.62 | 1.85 |
| 🤓 "F0B73C" on OpenSea | 245.26 | 505.05 | 259.79 | 236 | 1.06 | 1.10 |
| 151.eth | 57.92 | 277.50 | 219.58 | 36 | 3.79 | 6.10 |
_Table 1: Profit Leaderboard by Smart Money Metaverse NFT Trader All units of measurement are in ETH_
- Top Addresses with Realized Profits for Gaming NFTs
| Address | Spent | Revenue | Profit | Sales | Profit Multiple | Profit/Sales |
|---|---|---|---|---|---|---|
| @eddyiskongz | 176.94 | 1218.01 | 1041.07 | 102 | 5.88 | 10.21 |
| 🤓 @jayg_nft | 173.85 | 1080.73 | 906.87 | 335 | 5.22 | 2.71 |
| Smart NFT Trader | 2.69 | 429.23 | 426.54 | 16 | 158.83 | 26.66 |
| 🤓 mdiaz.eth | 16.59 | 384.99 | 368.40 | 68 | 22.21 | 5.42 |
| "NFT100x" on OpenSea | 125.19 | 469.53 | 344.34 | 116 | 2.75 | 2.97 |
| Legendary NFT Collector | 56.74 | 350.22 | 293.48 | 23 | 5.17 | 12.76 |
| 0xdame.eth | 15.23 | 306.35 | 291.12 | 70 | 19.12 | 4.16 |
_Table 3: Profit Leaderboard by Smart Money Gaming NFT Trader All units of measurement are in ETH_
- 10 Gaming NFTs that Smart Money Gaming NFT Traders are Holding
| NFT Collection | # of Smart Money Metaverse NFT Trader Wallets |
|---|---|
| Parallel | 5 |
| CyberKongz | 5 |
| Loot | 3 |
| Realms (for Adventurers) | 2 |
| Northern Guilds - Guild of Thorl | 2 |
| Ether Orcs Genesis | 2 |
| Ragnarok Meta | 2 |
| Solarbots | 2 |
| Antebellum Genesis Land | 2 |
| Crypts and Caverns | 2 |
Read the full report here!
NFT Benchmark Indicator Report for Smart Money Minters

Report Overview
- As the NFT sector has shifted from its euphoric bull to bear phase, many indicators that Nansen users have previously used to evaluate NFT collections may no longer be suitable.
- For instance, the 7D inflow for Hot Contracts back in February 2022 easily surpassed a minimum threshold of $1m in volume. Comparatively, we are only seeing a maximum of $100k inflows into these NFT contracts. Similarly, many Hot NFT Collections typically attract more than 5 Smart Money Depositors. At this current condition, we are seeing significantly lower numbers.
- This report focuses on the NFT primary markets as opposed to secondary sales by creating an indicator based on all recently minted NFTs. The analysis benchmarks Nansen’s Smart Minter label as an indicator to predict profitability based on historical performance over the last 120 days.
Key Findings
- For investors looking to hold NFT collections for 30 days following the mint date, the data indicates that it is difficult for NFT projects to make a profit without at least 30 Smart Minters, regardless of the types of smart money investors minting.
- For investors looking to hold NFT collections for only 1 day or 7 days after the mint date, the data suggests that NFT projects with a single Smart Minter would secure profitability on average, regardless of the types of smart money investors minting.
- After 14 days from the project mint date, in general, it would need at least 30 NFT-specific smart money minters but only one general Smart Minter to confirm profitability.
- It is crucial to keep in mind that every created benchmark mentioned above is derived based on past NFT performance over the last 120 days as of November 15, 2022. These benchmark findings are merely intended to serve as a general guide for investors to consider as they navigate this bear market environment. They are easily skewed by variance or nullified as market conditions change. They are not north stars, but may act as pointers to help inform buying and selling decisions.
Key Data and Charts
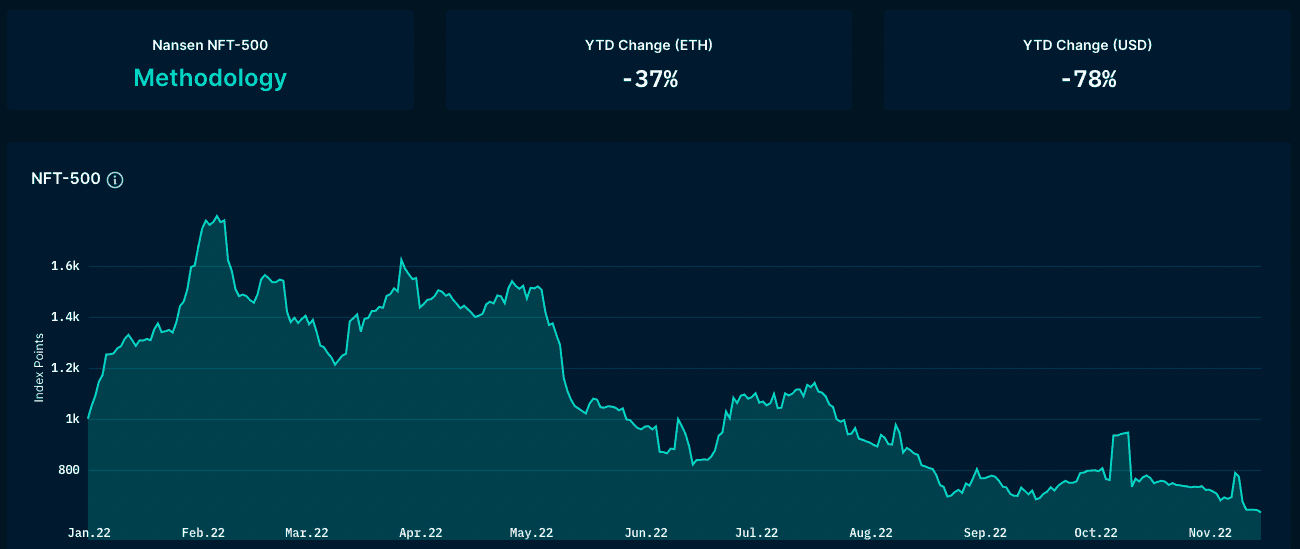
- The NFT market has been in a downturn since the end of May, with significantly lower transaction volume and user activity. According to Nansen Trends & Indexes dashboard, the overall market in NFT sales has plummeted since June 2022.
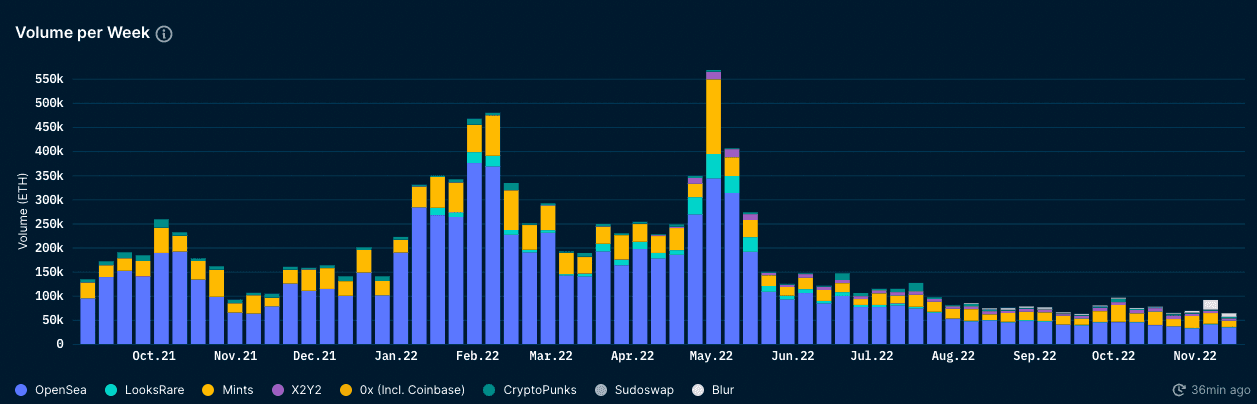
- The NFT-500 index also presents a bearish NFT market environment as the index points continue to drop and is now down 37% YTD measured in ETH and 78% YTD measured in USD.
Read the full report here!
Section 4: Using Nansen for Blockchain Analysis
Trading Crypto With Nansen Smart Money

Report Overview
- Nansen Smart Money labels are designed to help users quickly identify market trends and token movements on the blockchain. The basis of these labels comes from ranking wallet performance and identifying top-performing wallets as “Smart Money”. This report simulated a strategy of copy trading based on Nansen Smart Money labels and estimated the returns associated with such a strategy.
Key Findings
- In this preliminary research, we estimated that using even simple strategies with Nansen Smart Money labels can potentially generate significant returns. This validates our hypothesis that Smart Money wallets are an effective way to surface the signal from blockchain data.
- For the more technically inclined, please refer to our research paper "Using Nansen Smart Money and Bridge Data to Simulate Tactical Investment”.
Key Data and Charts

Figure 2: Momentum Indicators vs ETH
- Out of all the momentum indicators tested the “Percentage change in the number of Smart Money addresses holding a token” indicator delivered the best performance against both the ETH benchmark and the 75 percentile of Monte Carlo simulated returns.
- The strategy delivers an average-yearly-return-to-volatility ratio of ~3.1 vs ~1.8 for a portfolio holding ETH only and an average-return-to-maximum-price-drawdown of ~6.8 vs ~3.2 for ETH, over a period covering March 2020 to March 2022.

Figure 3: Address Percent Change Strategy vs Monte Carlo Simulations
While this strategy may no longer be relevant today - it is a clear demonstration of simple Nansen data being used for profitable trading strategies.
Read the full report here!
Following the Nerds: Understanding Smart Money Labels and How to Use Them

Report Overview
- We cover some of the existing Smart Money labels and describe some strategies on how to use them for your trading activities.
Key Findings
- One way to start your deep dive would be to check out our Smart Money dashboard and filter for the relevant Smart Money tags you are interested in. Next, study the addresses using Wallet Profiler and generate smart alerts for those that are active in your timezone, which can lead to new opportunities.
- Similar to First Mover LP, the Smart & Smarter LP are also focused on liquidity provision. However, the key difference is that here, we use realized profit as a metric as opposed to speed. Tracking wallets like these can lead to profitable opportunities.
Key Data and Charts
For example, filtering for First Mover Staking transactions over the past 24 hours shows these results:
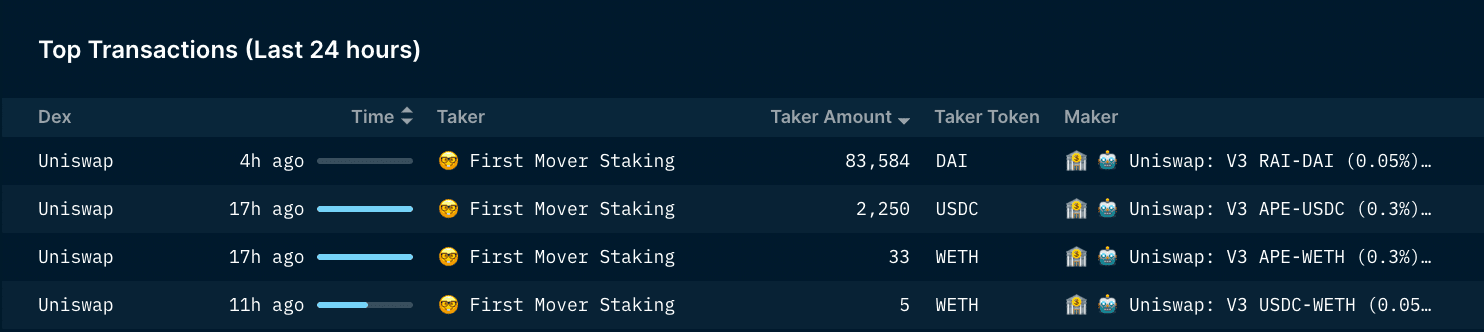 Source: Smart Money Dashboards
Digging further, click into any of the wallets listing to view it on Wallet Profiler and better understand the behaviour of this wallet, and whether or not it is a wallet you are interested in tracking.
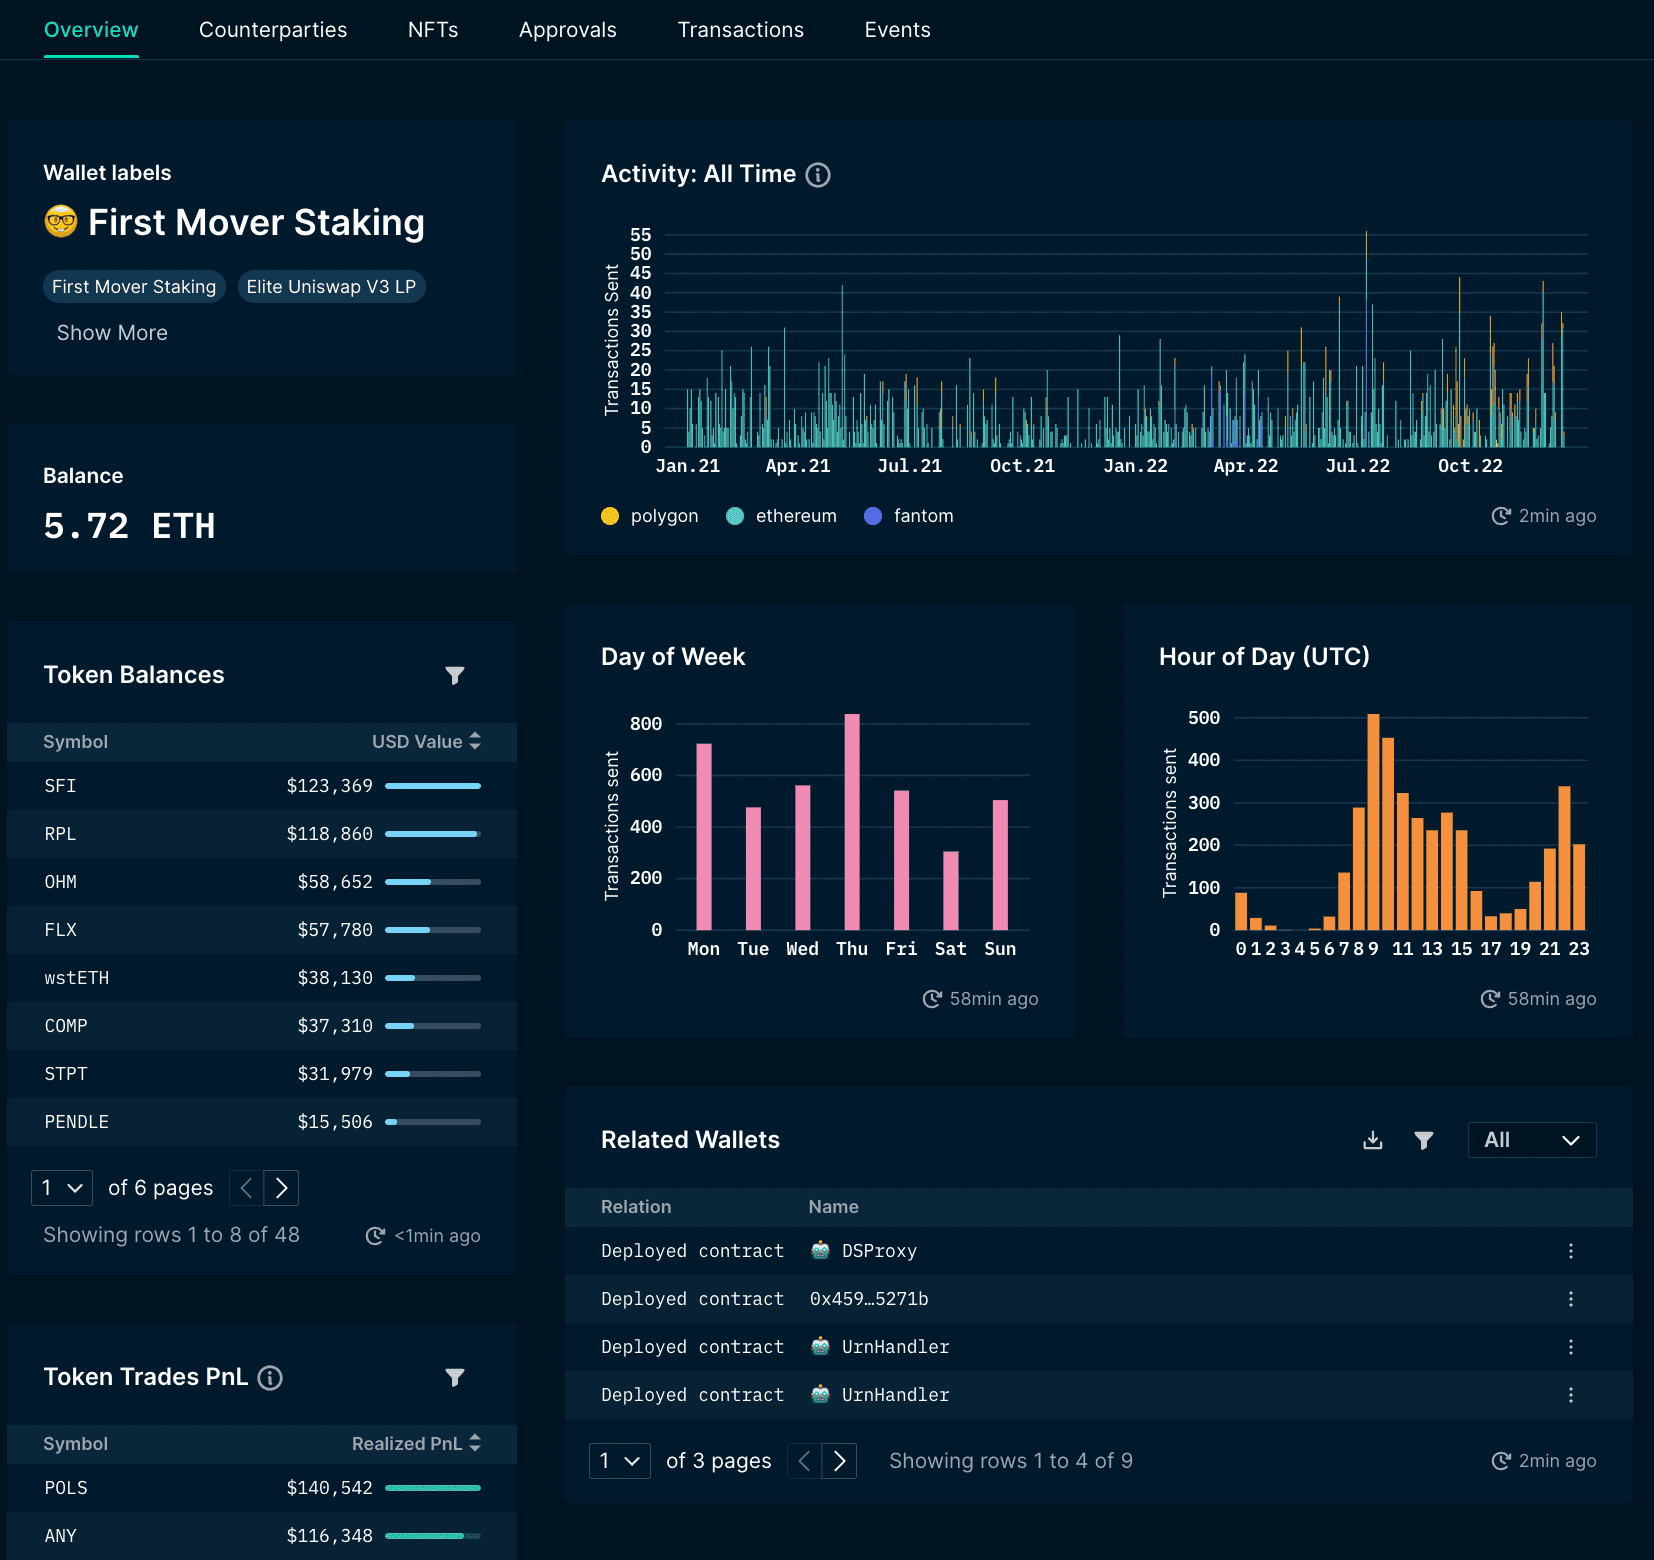 Source: Wallet Profiler
Read the full report here!
Nansen NFT Workflow Strategies

Report Overview
- This report covers the various NFT workflows and strategies that can be performed only through using Nansen’s dashboards, tools, and available data. It ranges from discovery (minting, market overview) to diligence (following Smart Money, defending positions).
Key Findings
- Using NFT Paradise’s Smart Money tab, you can see a breakdown of the buys, sells, and mints of the last 24-hours. Next, you can look at the type of traders, such as Minter, Sweeper, Hodler, or Trader. Smart NFT Minter minting is not necessarily high signal since they often mint a lot of stuff in a ‘spray and pray’ type approach. However, if a Smart NFT Hodler is also minting, then it might be worth looking into more.
- Finding potential blue-chip NFTs to buy is possible by heading to NFT Paradise’s Smart Money tab. Filter by name = HODLER and type = BUY, and look for commonly held collections. If there are certain sweeps or buying behavior that you are interested in, you can dig deeper with NFT god mode.
Key Data and Charts
Profit Leaderboard
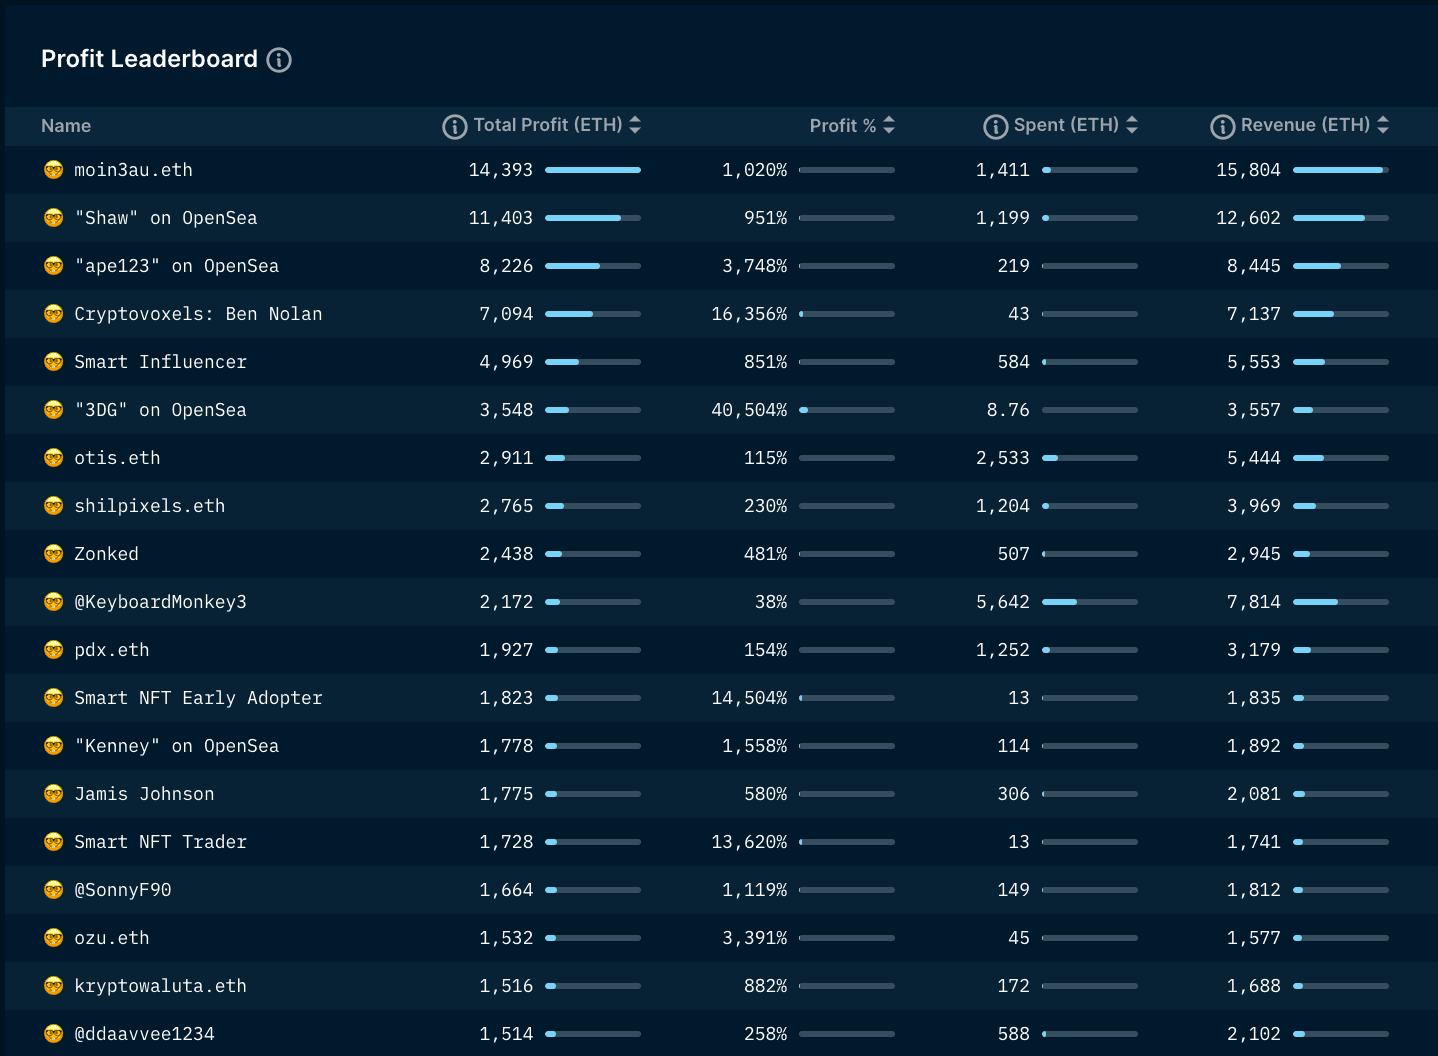
Source: Nansen NFT Paradise
Read the full report here!
Nansen DeFi Workflow Strategies

Report Overview
- This report covers various DeFi workflows and strategies that can be performed using Nansen’s dashboards, tools, and available data. It encompasses everything from discovery to diligence and defence.
- It includes:
- Token Due diligence process
- What are people doing with XYZ token?
- Where are the hottest staking and LPing contracts?
- What has Smart Money been up to?
- Finding alternative wallet addresses for a particular wallet
- Finding high alpha wallets (insiders/private info)
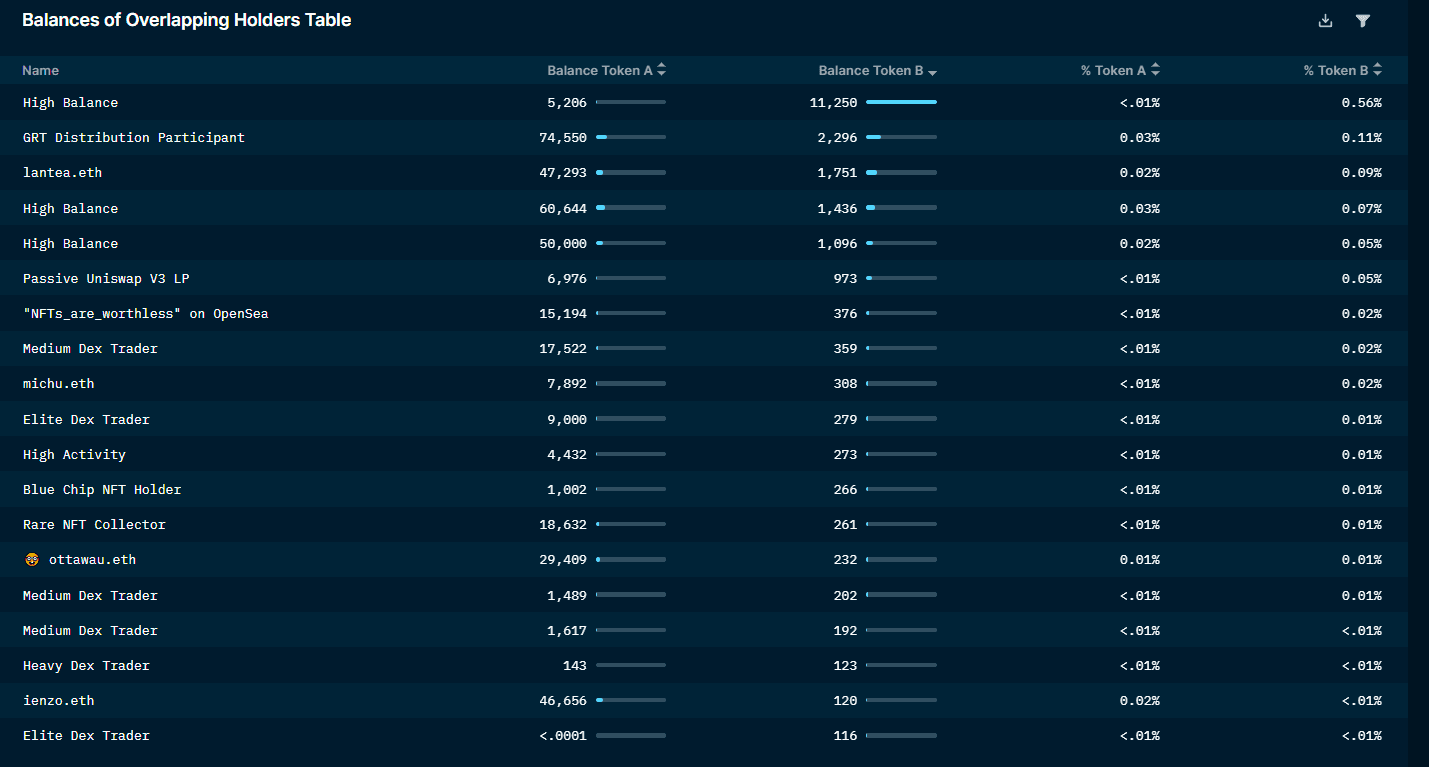
- What overlap in holders is there between 2 tokens if any?
Key Findings
- To take advantage of Smart Influencers, you can use the Smart Money dashboard, and filter strictly for ‘Smart Influencers’ to get all of their recent DEX trades to trade alongside them in real-time if they are buying into meme tokens.
- In a token diligence process:
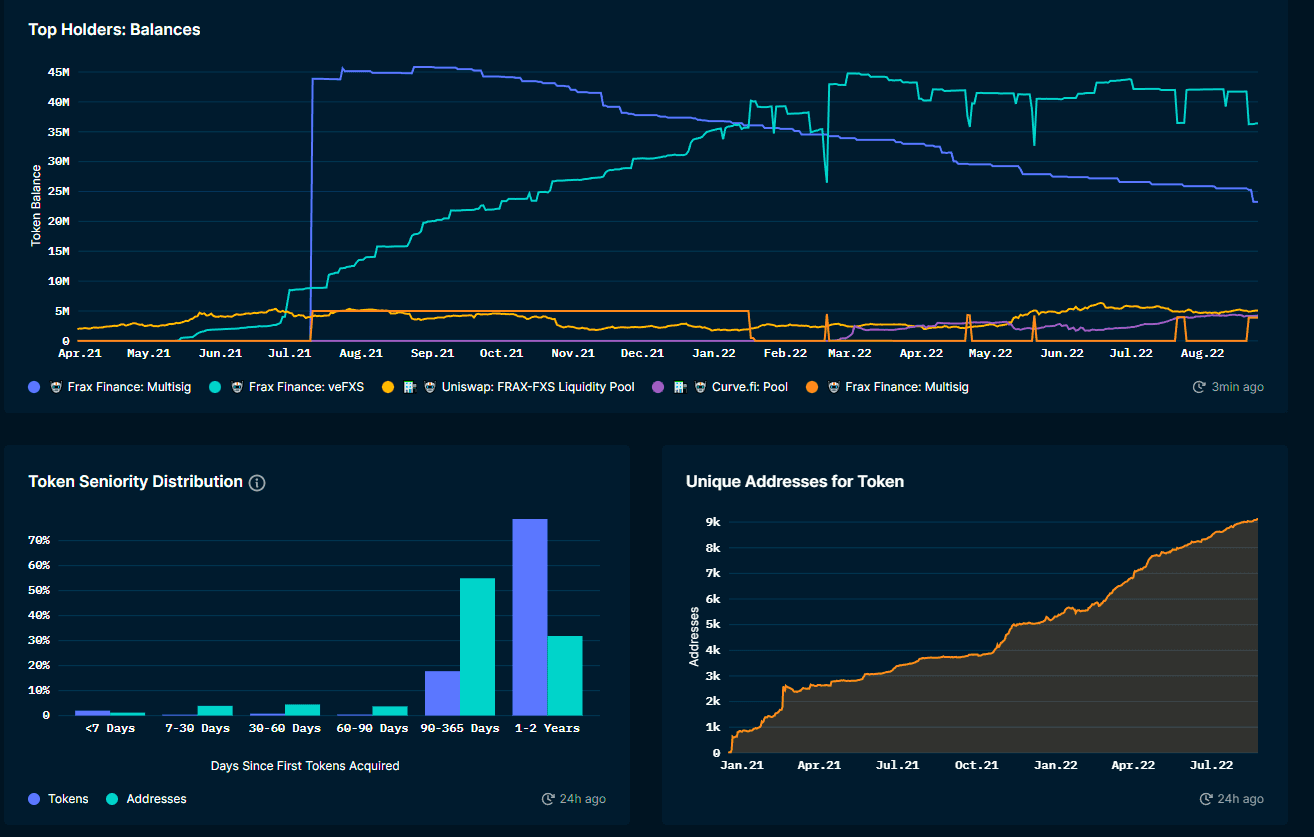
- Check out Token God Mode for your desired token
- Look at the seniority distribution - are there mainly hodlers or new buyers? What is the cost basis for the top wallets? Could they dump on you at a significant profit?
- Look at the # of unique addresses. Is it growing or declining?
- Are there any new large token balance changes?
- Use Nansen Portfolio and look at their positions to gauge conviction level. Does this token represent a majority or a nominal portion of their portfolio?
- Are there any Smart Money buyers? Search for “🤓” in the filters.
- Open waller profiler for token on specific wallets to dig deeper.
- Set Smart Alerts as necessary
- Want to find alternative wallet addresses for a particular wallet? Wallet Profiler displays similar addresses in the ‘Similar Addresses’ field in Wallet Profiler with a score of low, medium or high to help you find linked addresses.
- If you want to manually link wallets, run wallet profiler on an address and look at the Top interacting wallets under the counterparties tab, and filter for “deposit” to find the CEX deposit addresses. Run Wallet Profiler on the CEX deposit address and look at the top interacting wallets to check if any other addresses routinely send funds in. You can do further diligence using wallet pair profiler and finding where the initial funded ETH was deposited from to gain additional insights.
Key Data and Charts
Read the full report here!
Conclusion
2022 has been a key year for crypto. The euphoric bull market of 2021 came to an end, as flawed & unsustainable business models were exposed which led to far-reaching contagion in the space. Despite this, the role of self-custody and on-chain transparency is more relevant now than ever.
Through these 17 reports, we hope to highlight the importance of blockchain analysis in surfacing the signal with unique & actionable insights, empowering participants in the digital assets space with a winning edge to navigate the