Introduction
The purpose of the report is to provide a deeper understanding of how Smart Money movements can predict potential performance on tokens by examining the historical data for Smart Money. The analysis looks into tokens that have seen the highest percentage increase in the number of Smart Money holders week on week and how it might relate to the performance of the token. Additionally, the report investigates whether the number of Smart Money holders and balance changes for the token are also significant factors, with the goal of creating a benchmark to indicate a threshold for positive performance.
Methodology
For our analysis, we focused on the timeframe of the past 3 months and segmented the tokens based on different categories. The three main categories are narrative-driven, mid-cap and small-cap tokens. We looked at these tokens by querying for the number of Smart Money holders week on week and looked at the tokens with the top percentage increase in Smart Money holders for tokens in each of the categories to dive deeper into.
Results
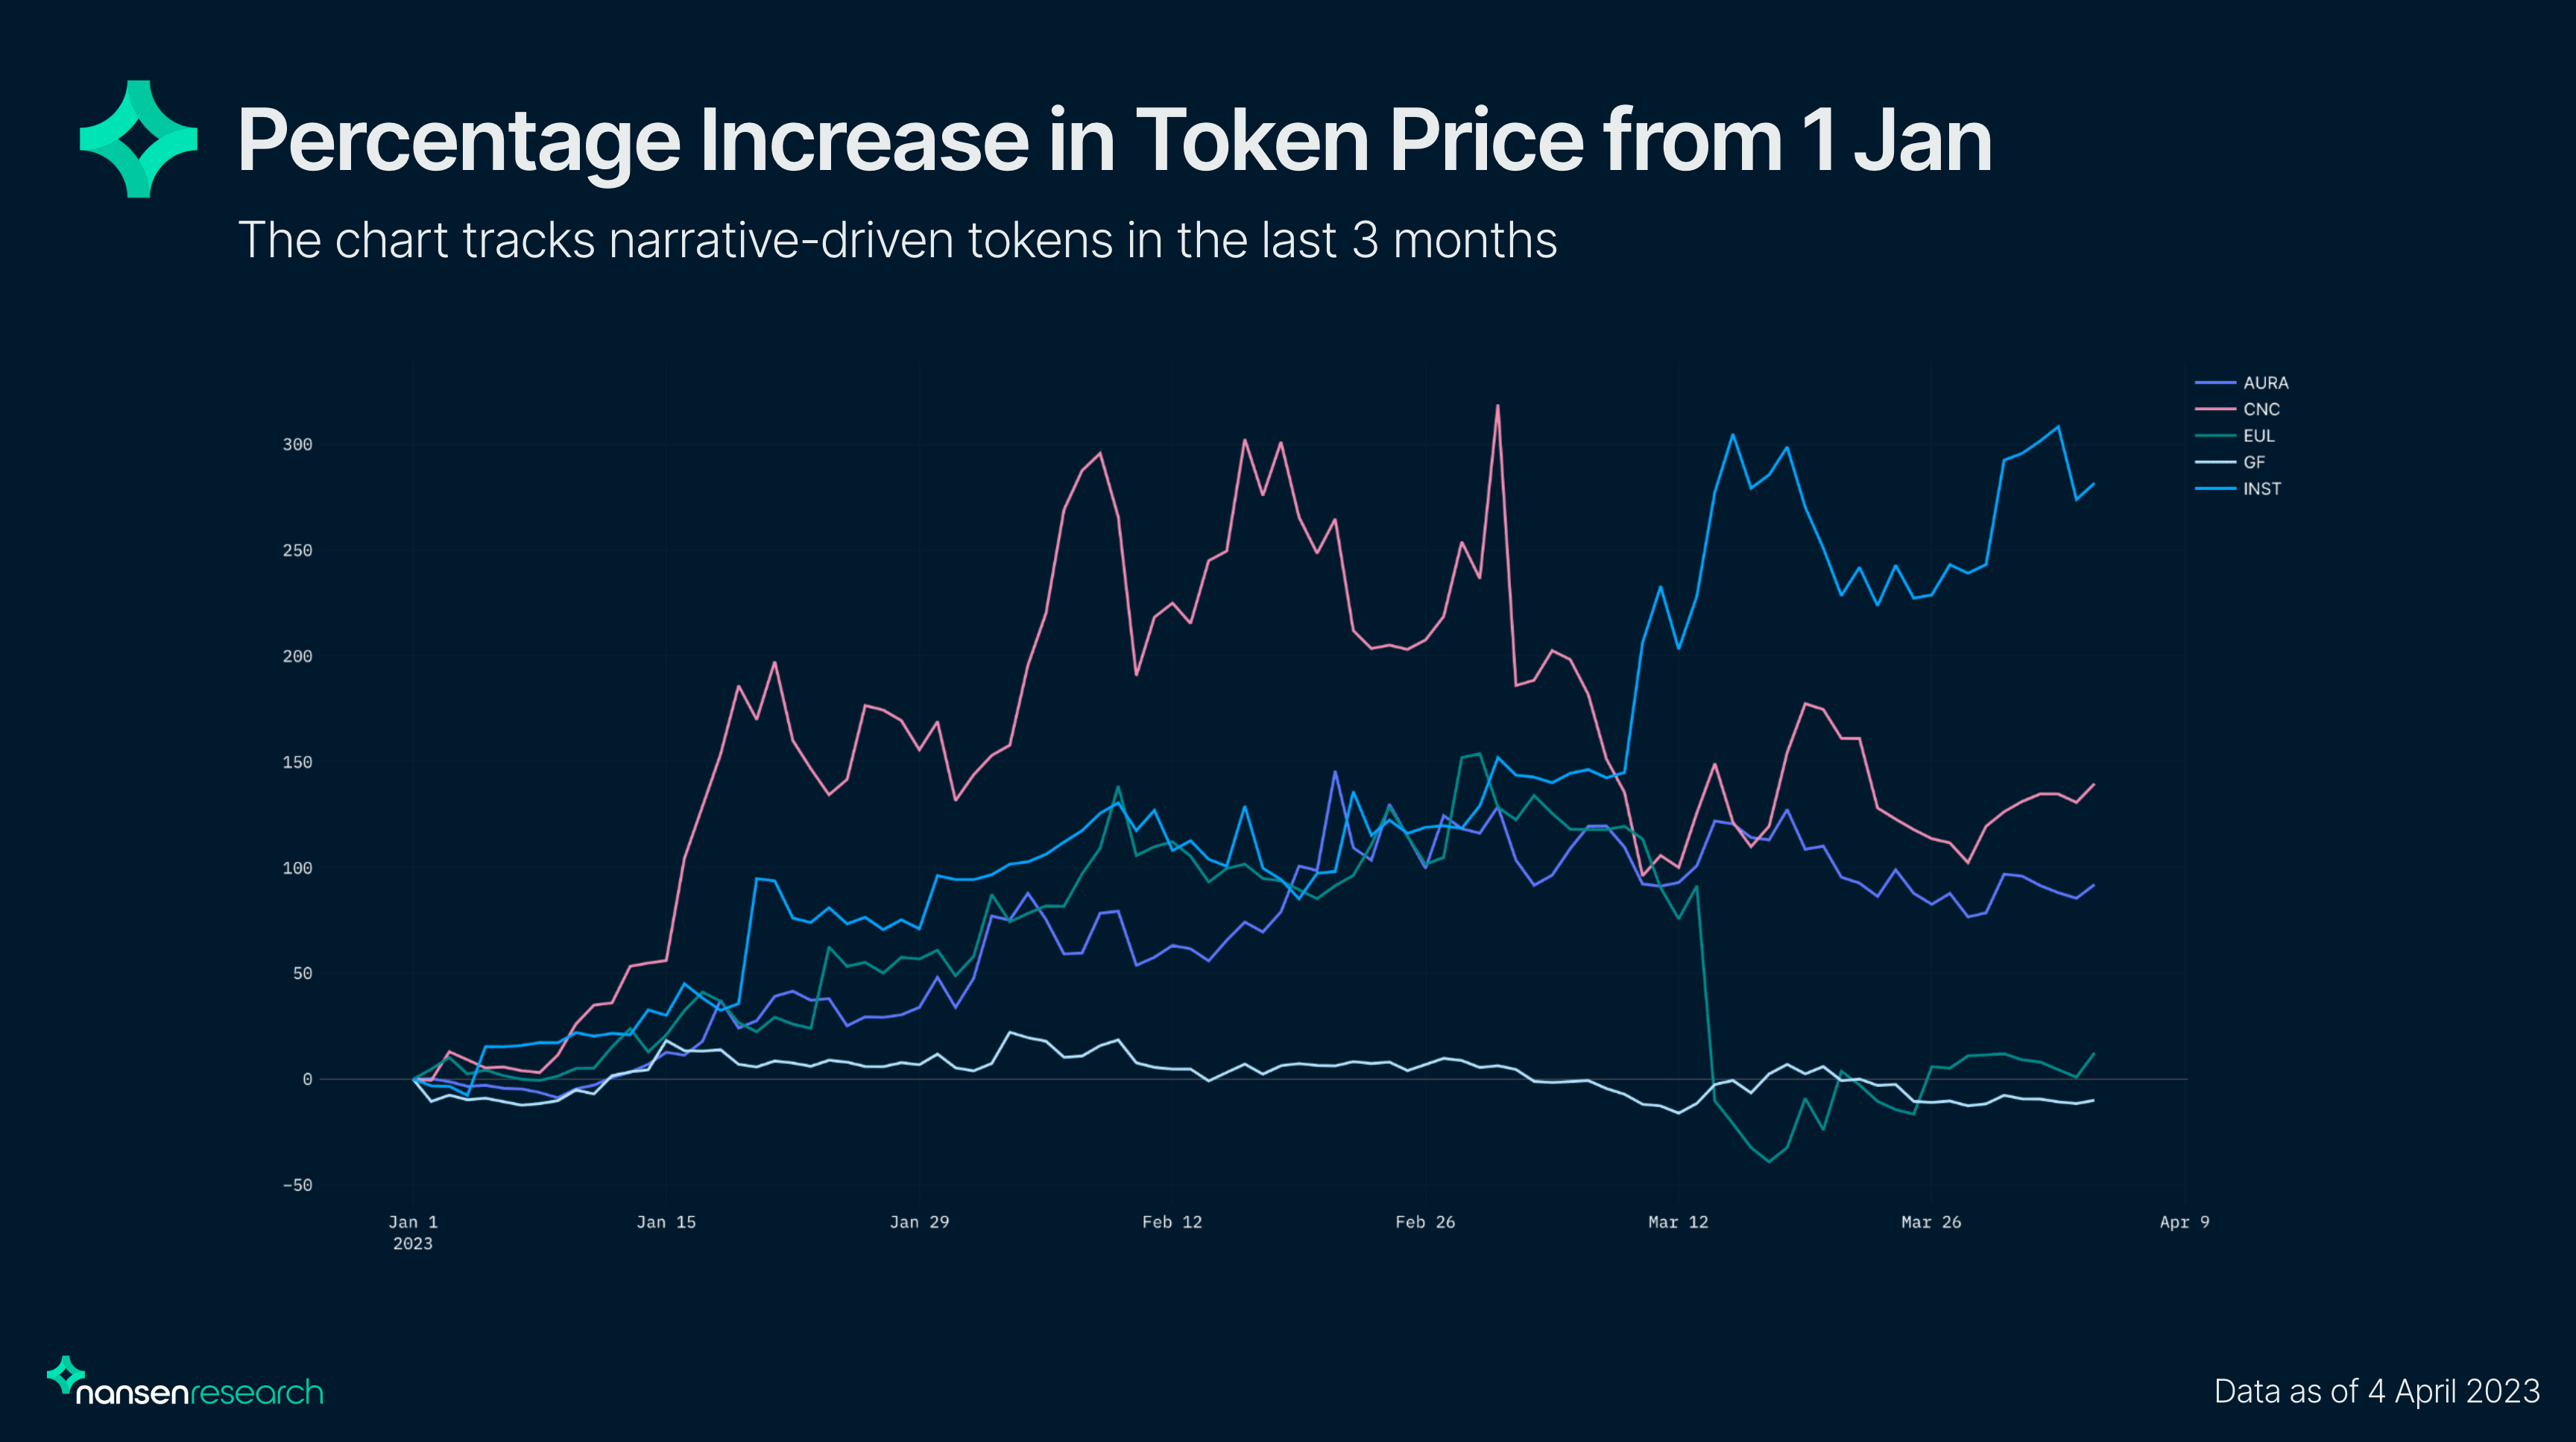
Narrative-driven Tokens
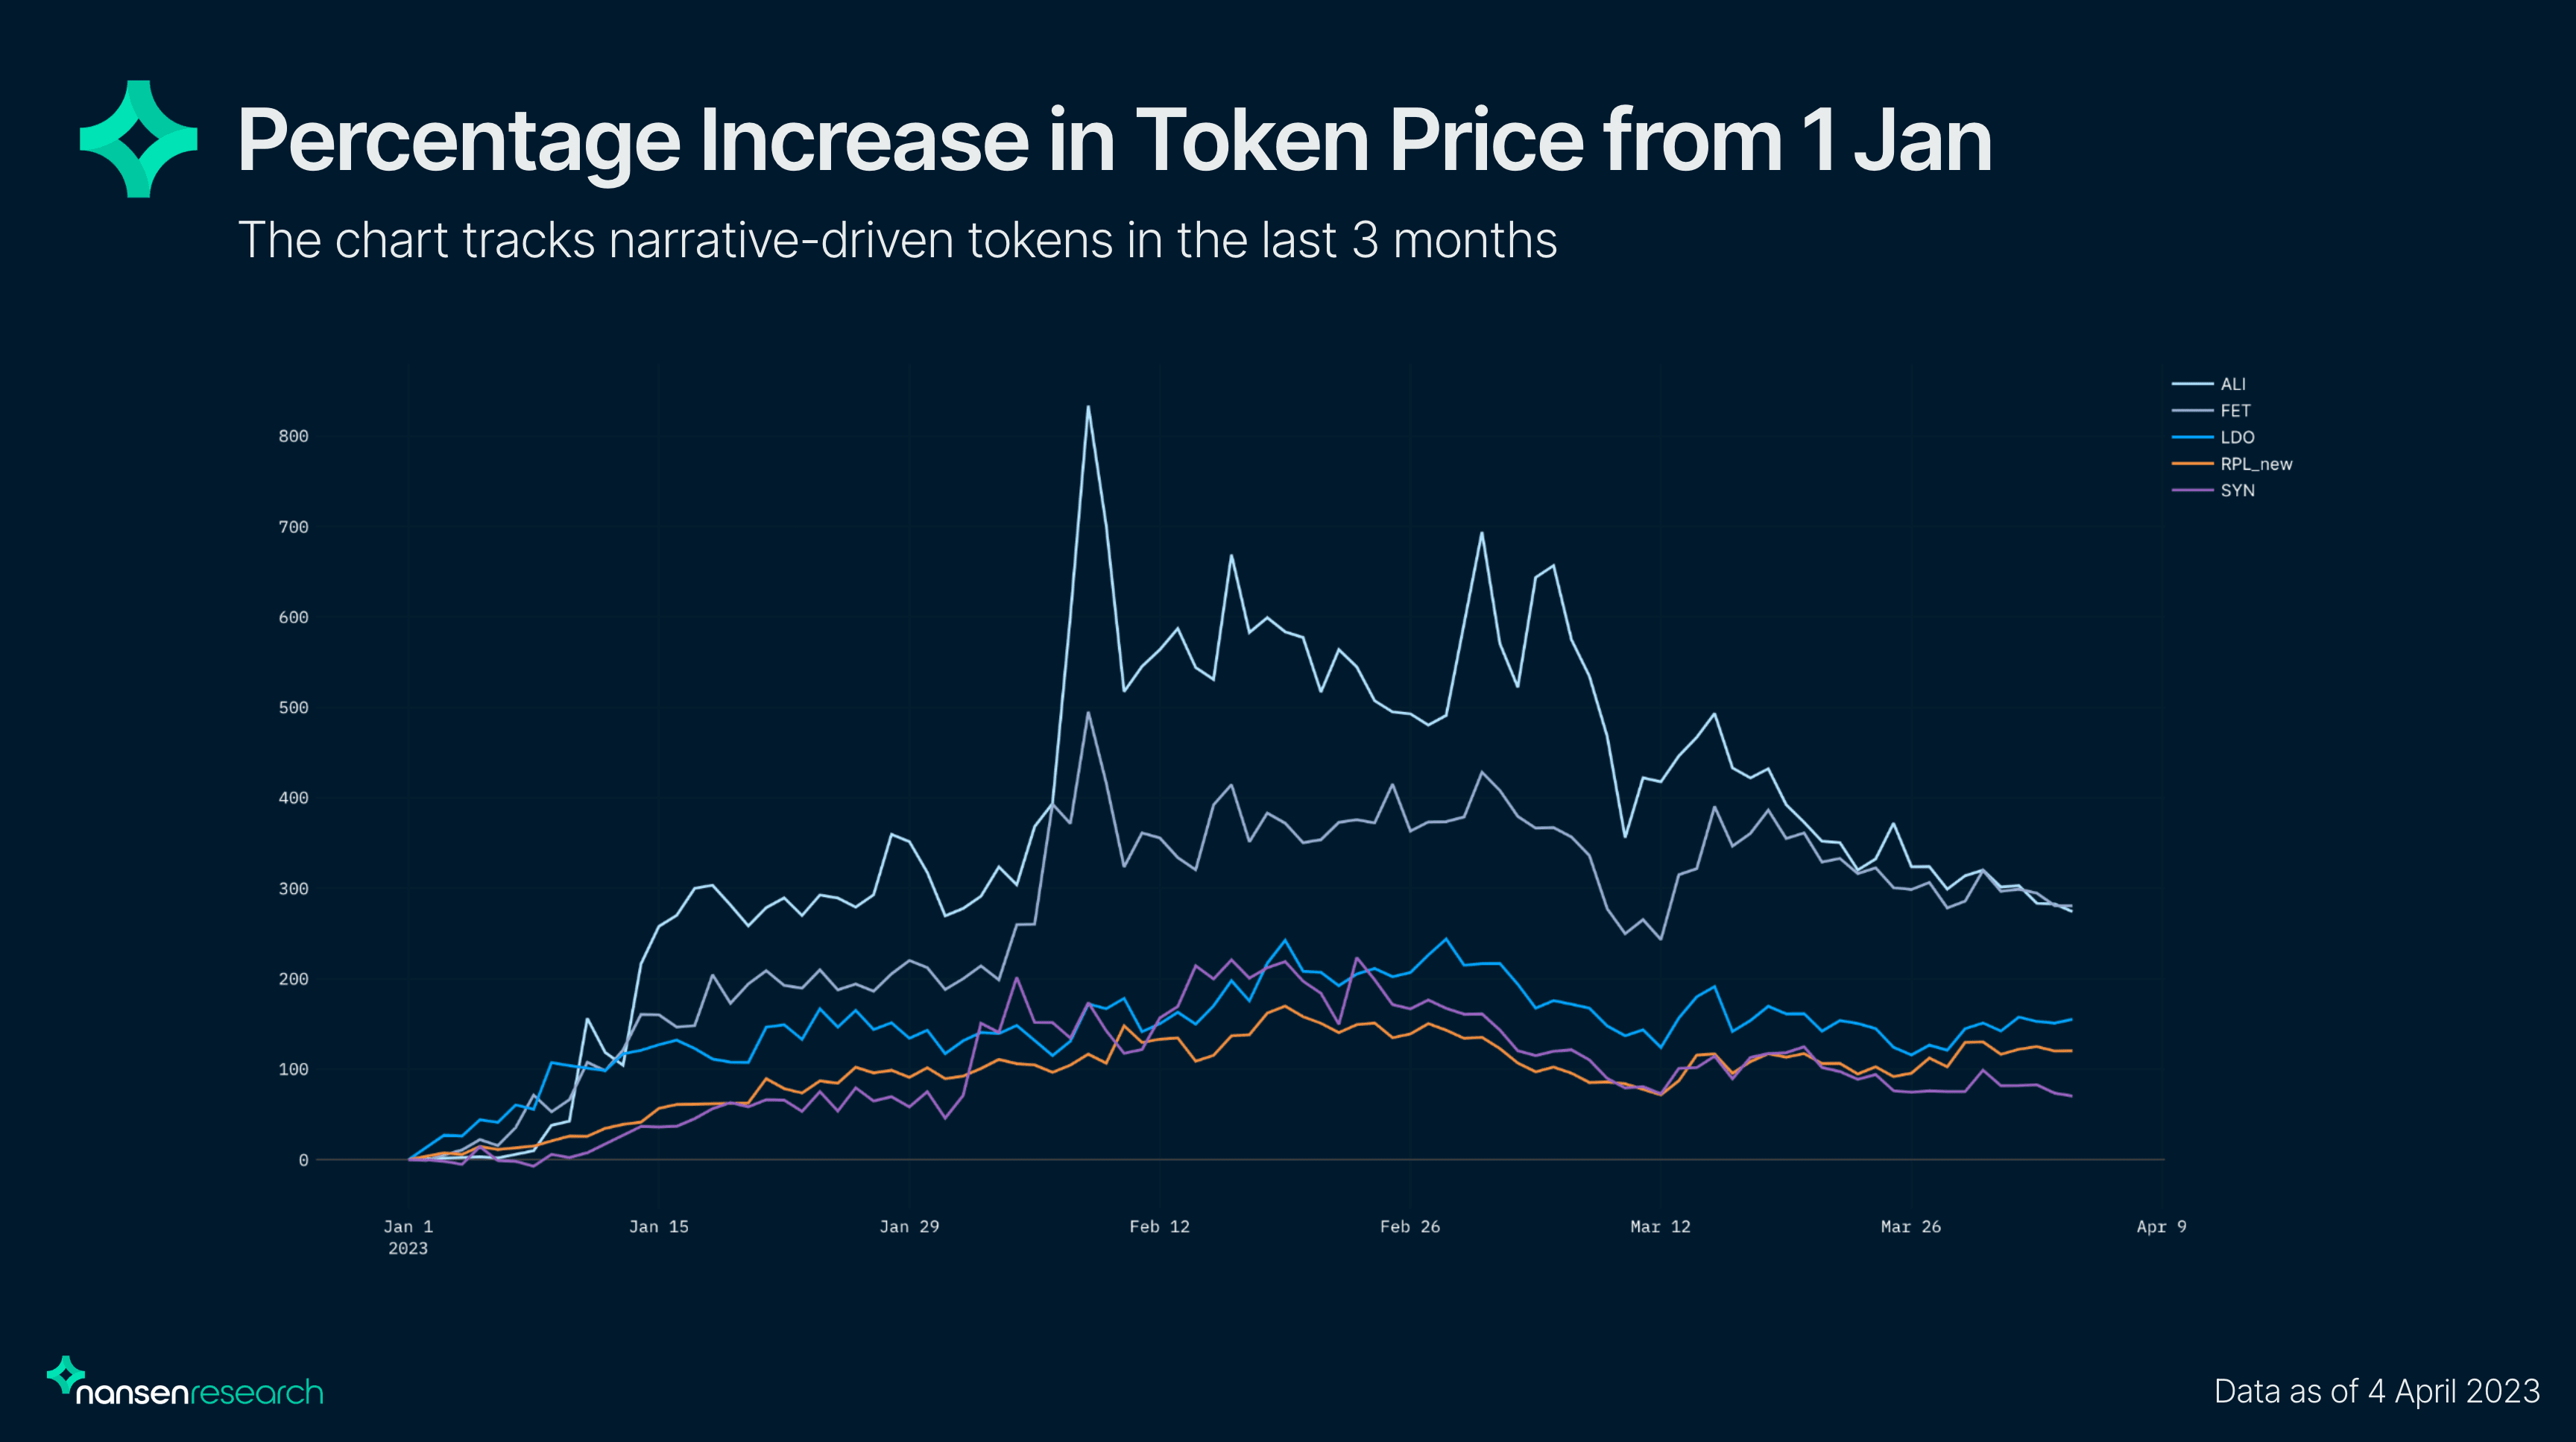
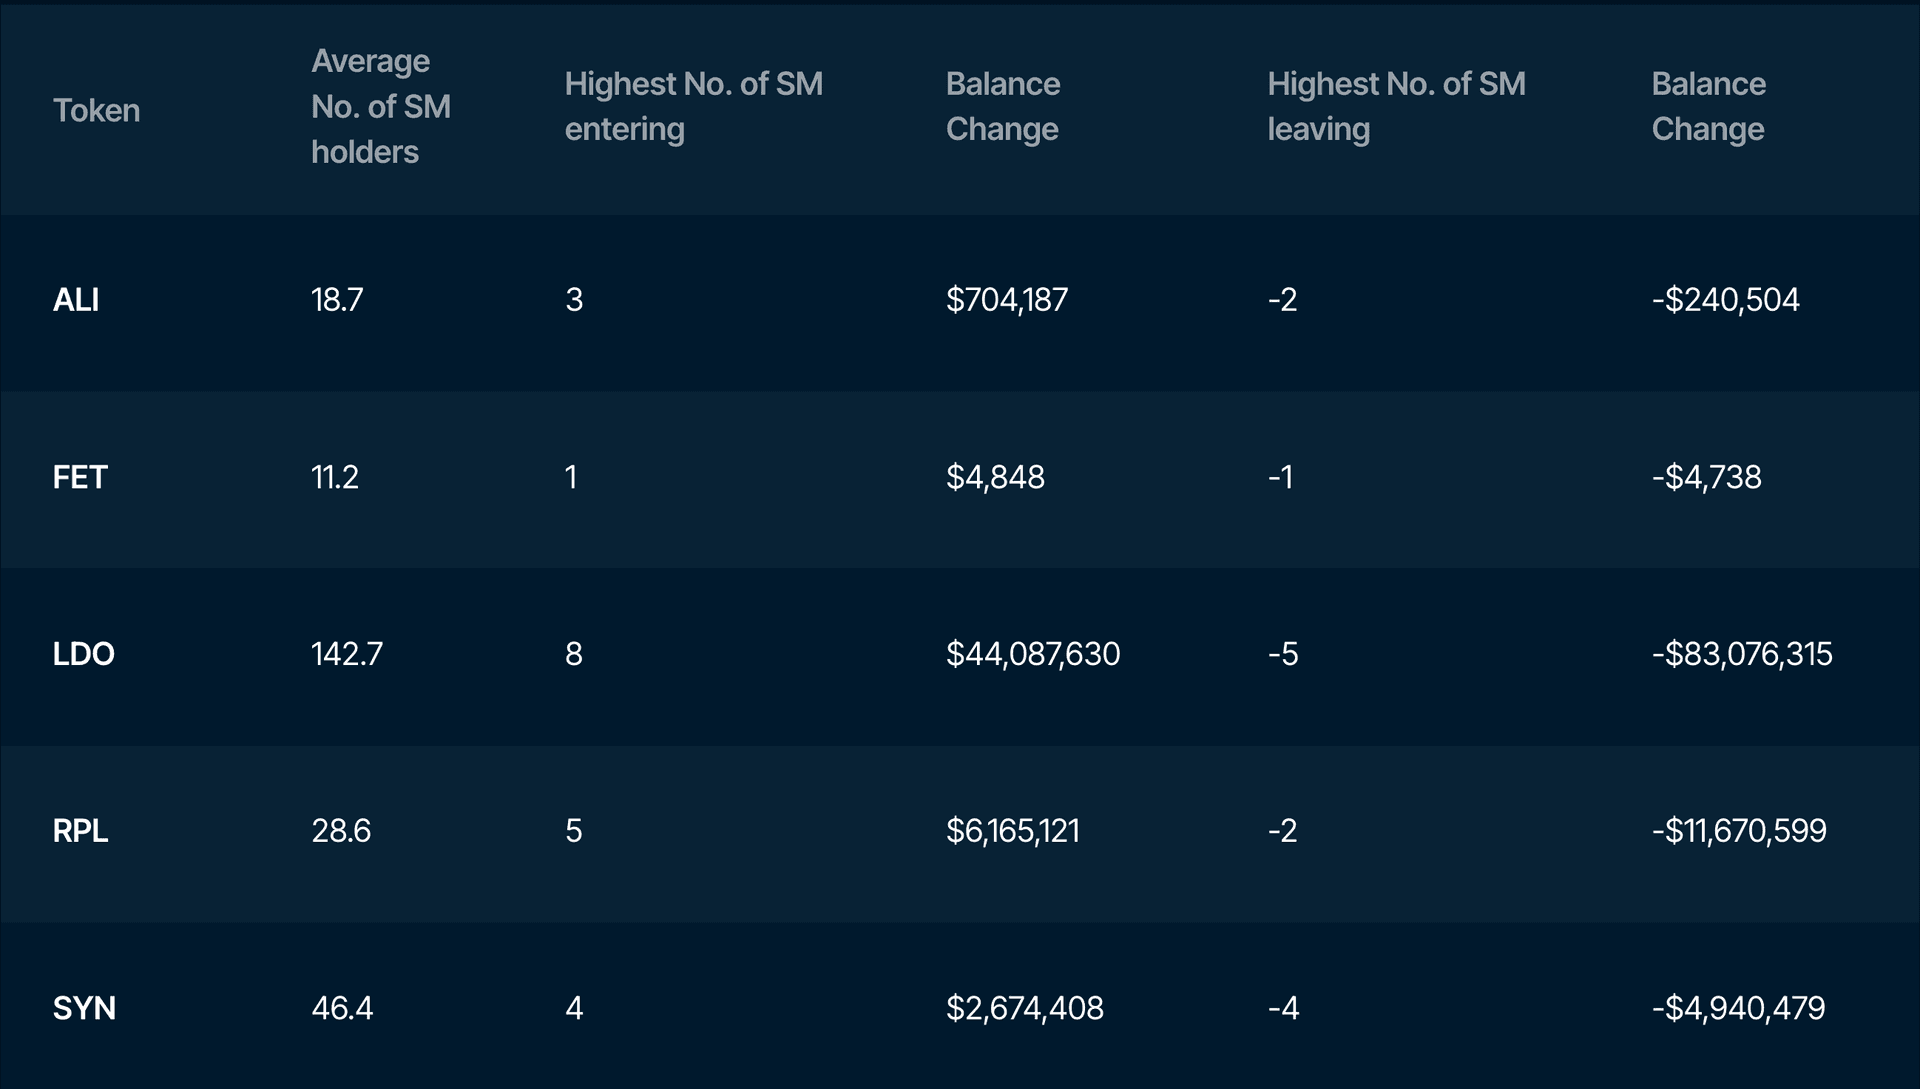
Tokens under the narrative-driven category include ALI, FET, LDO, RPL and SYN.
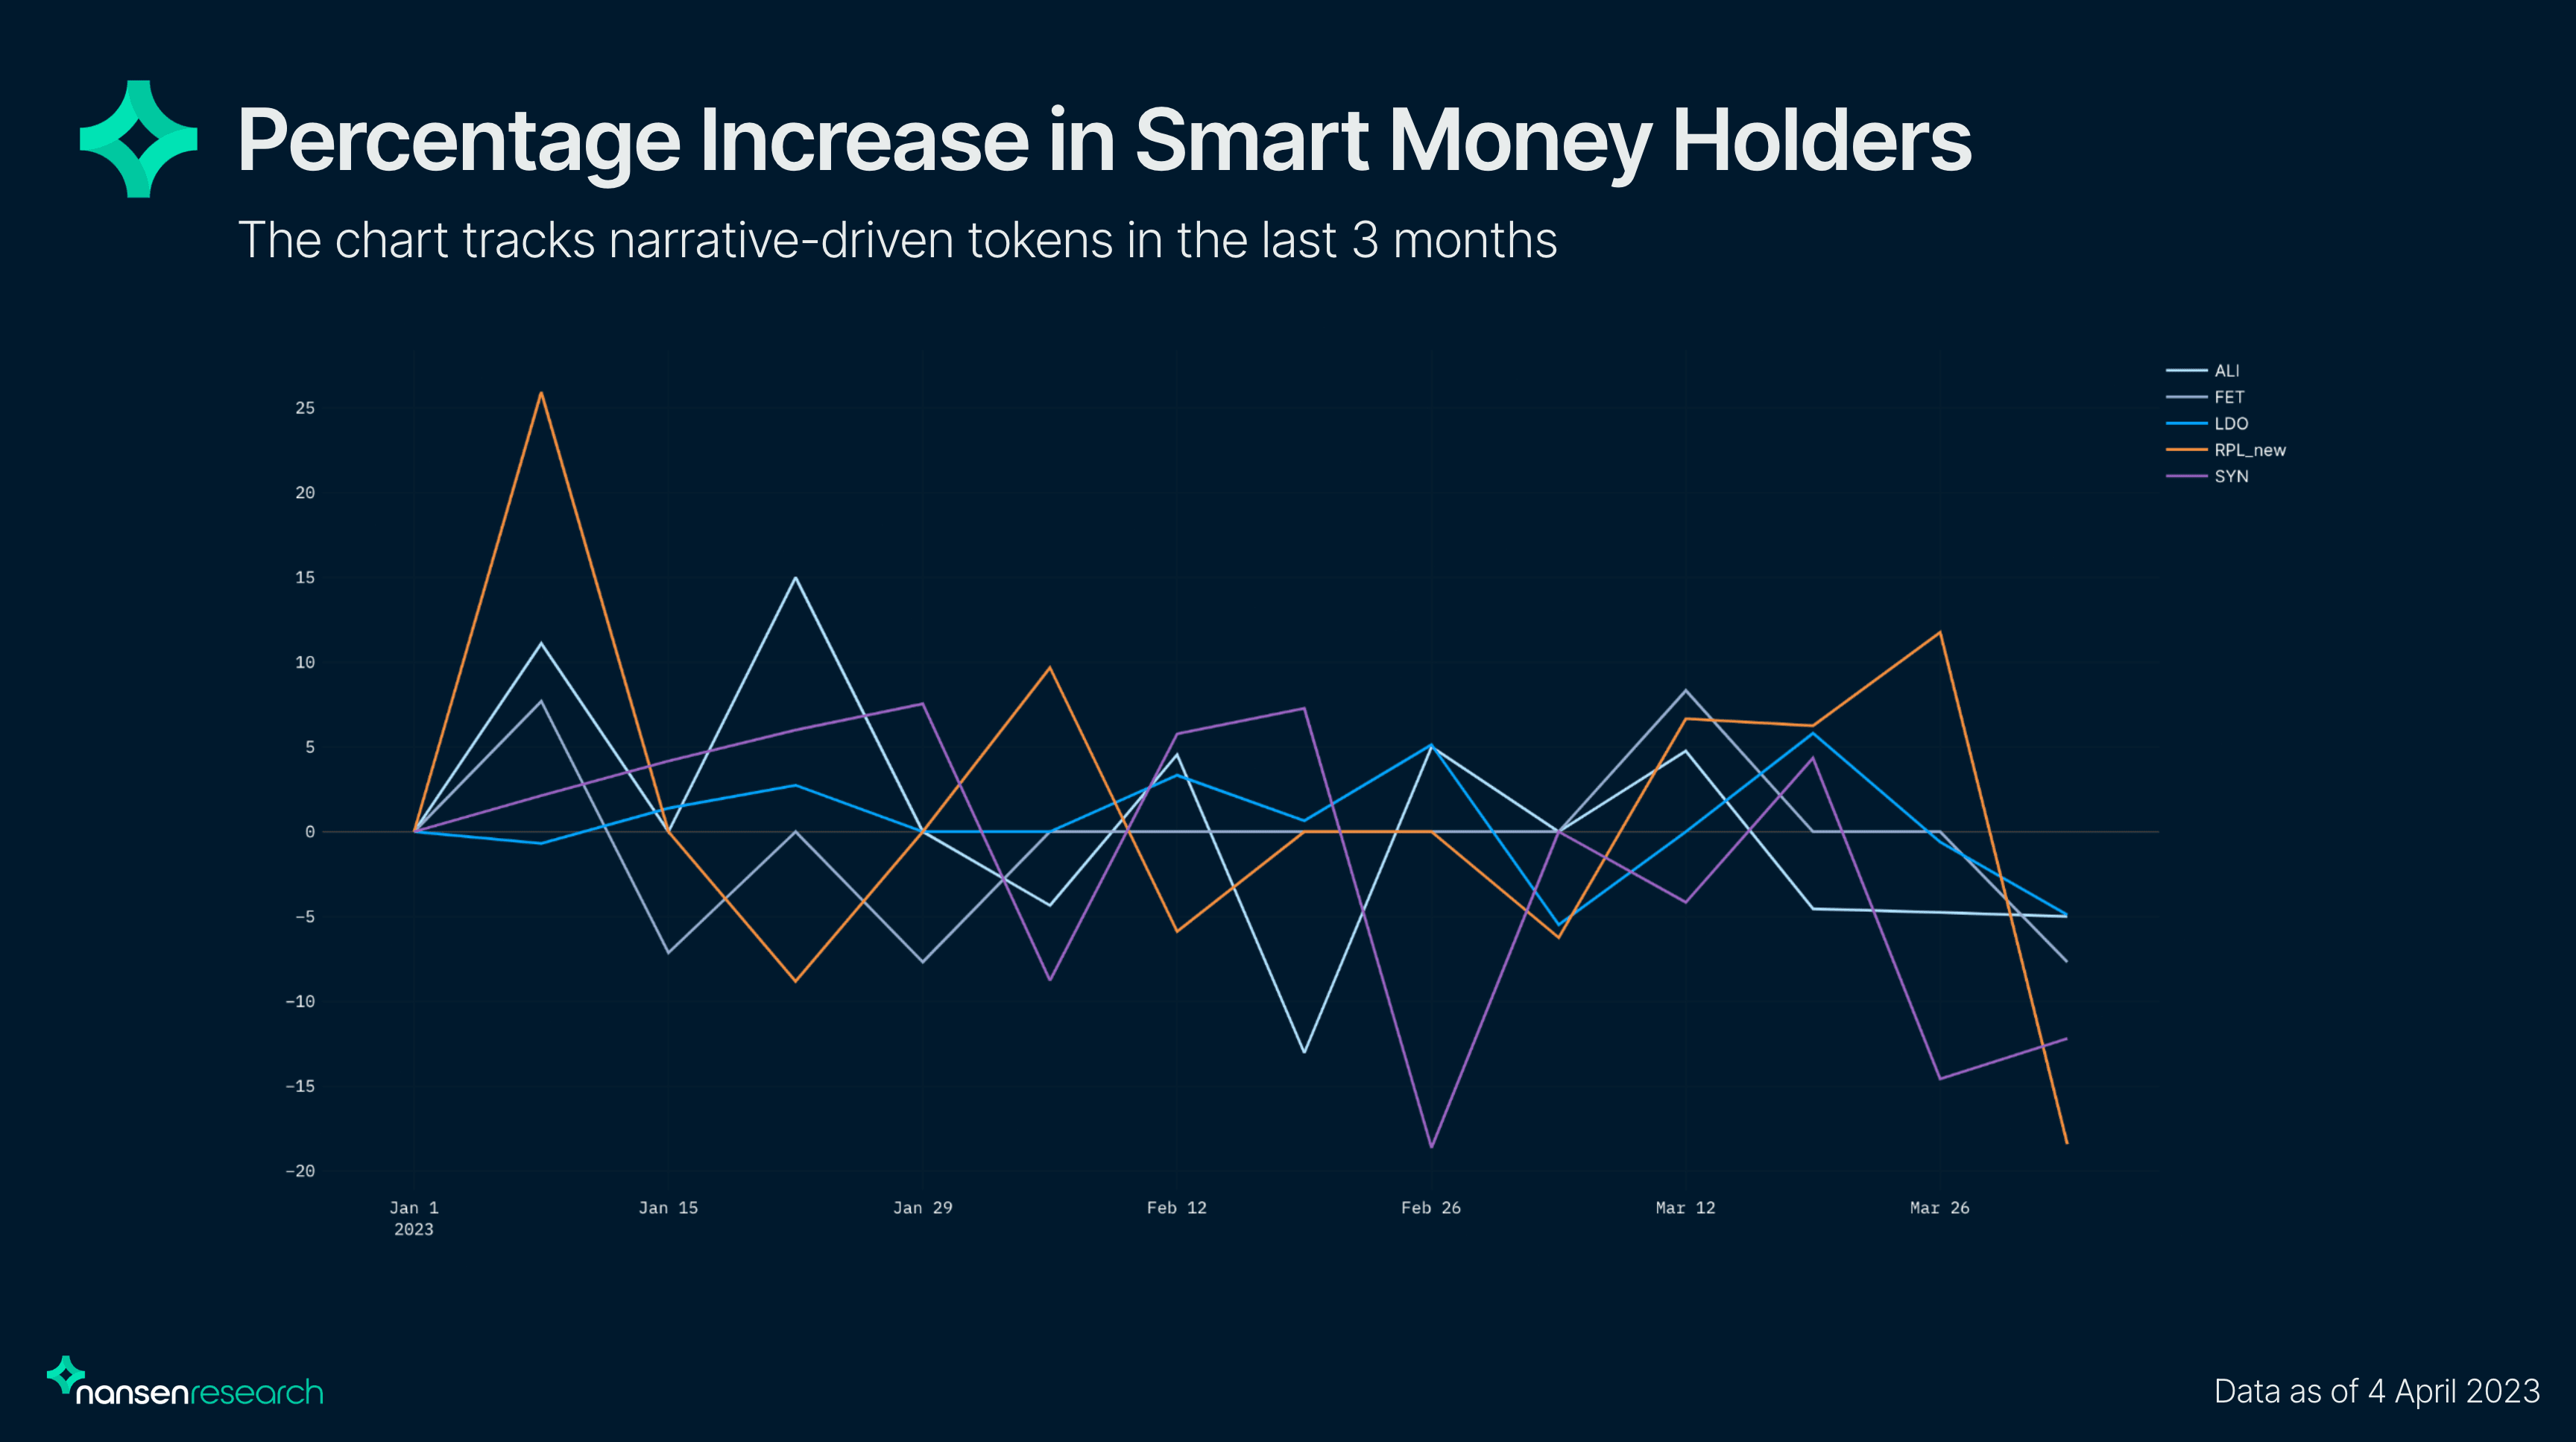
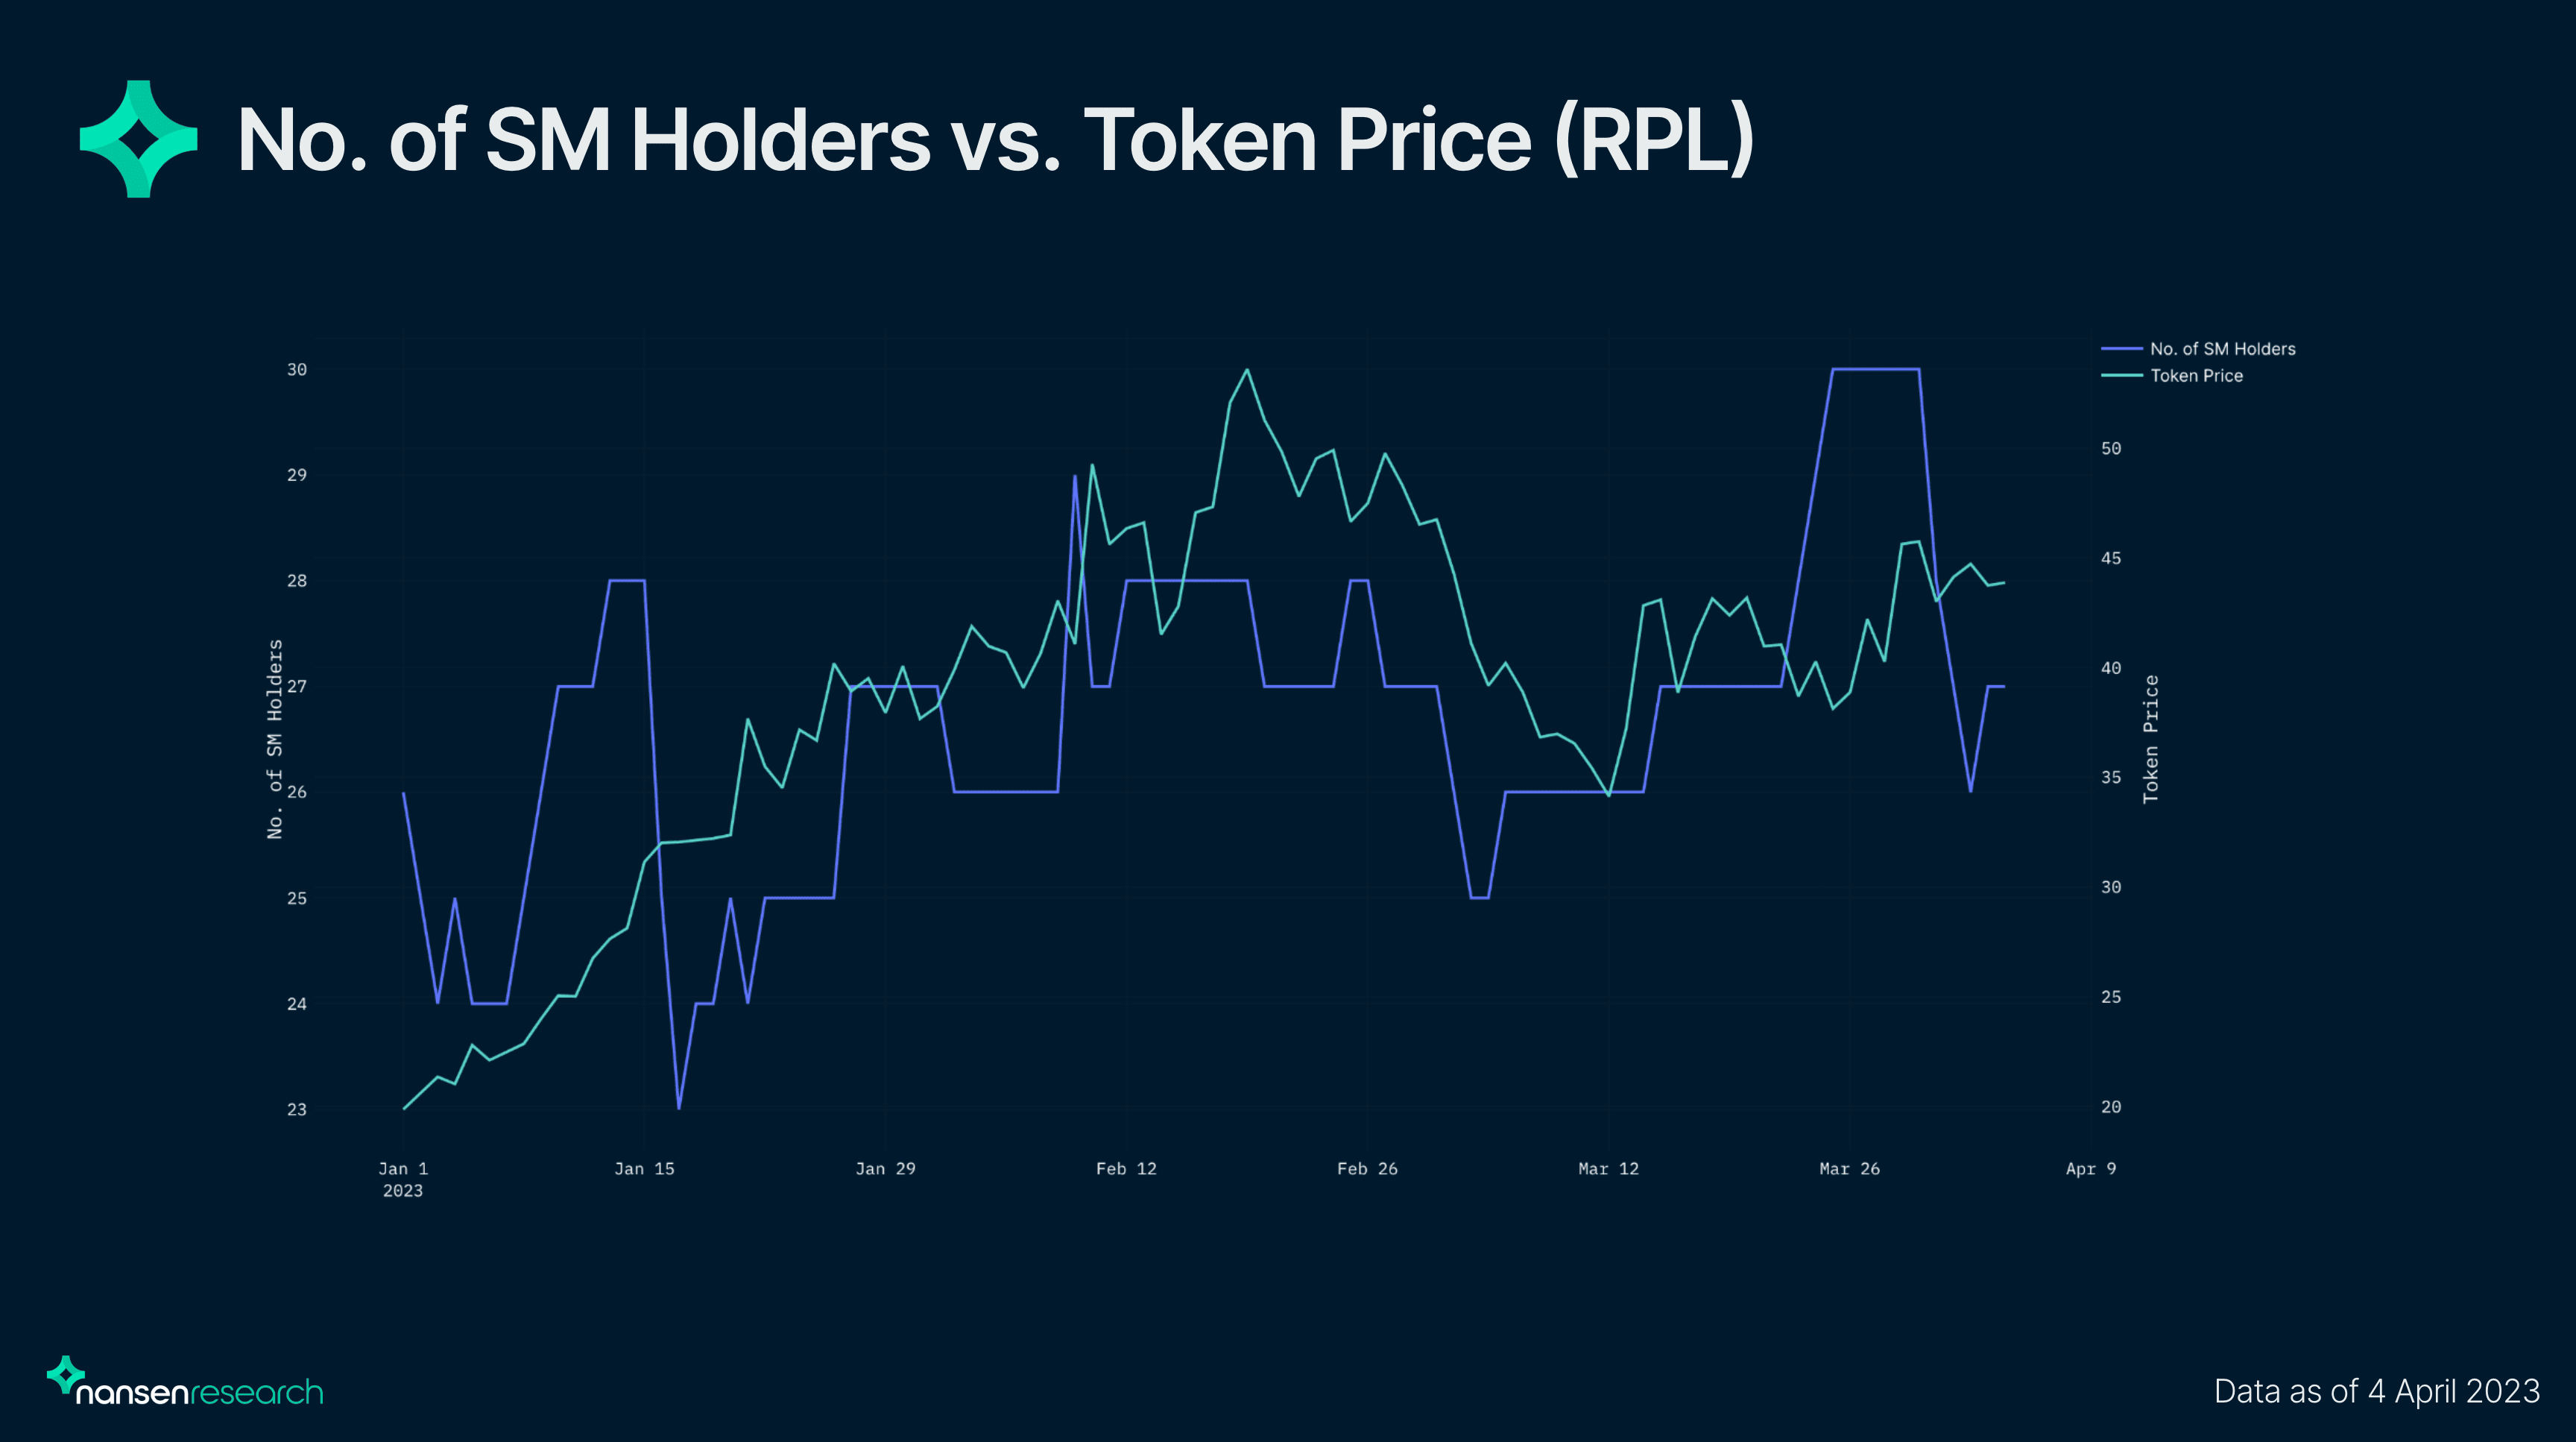
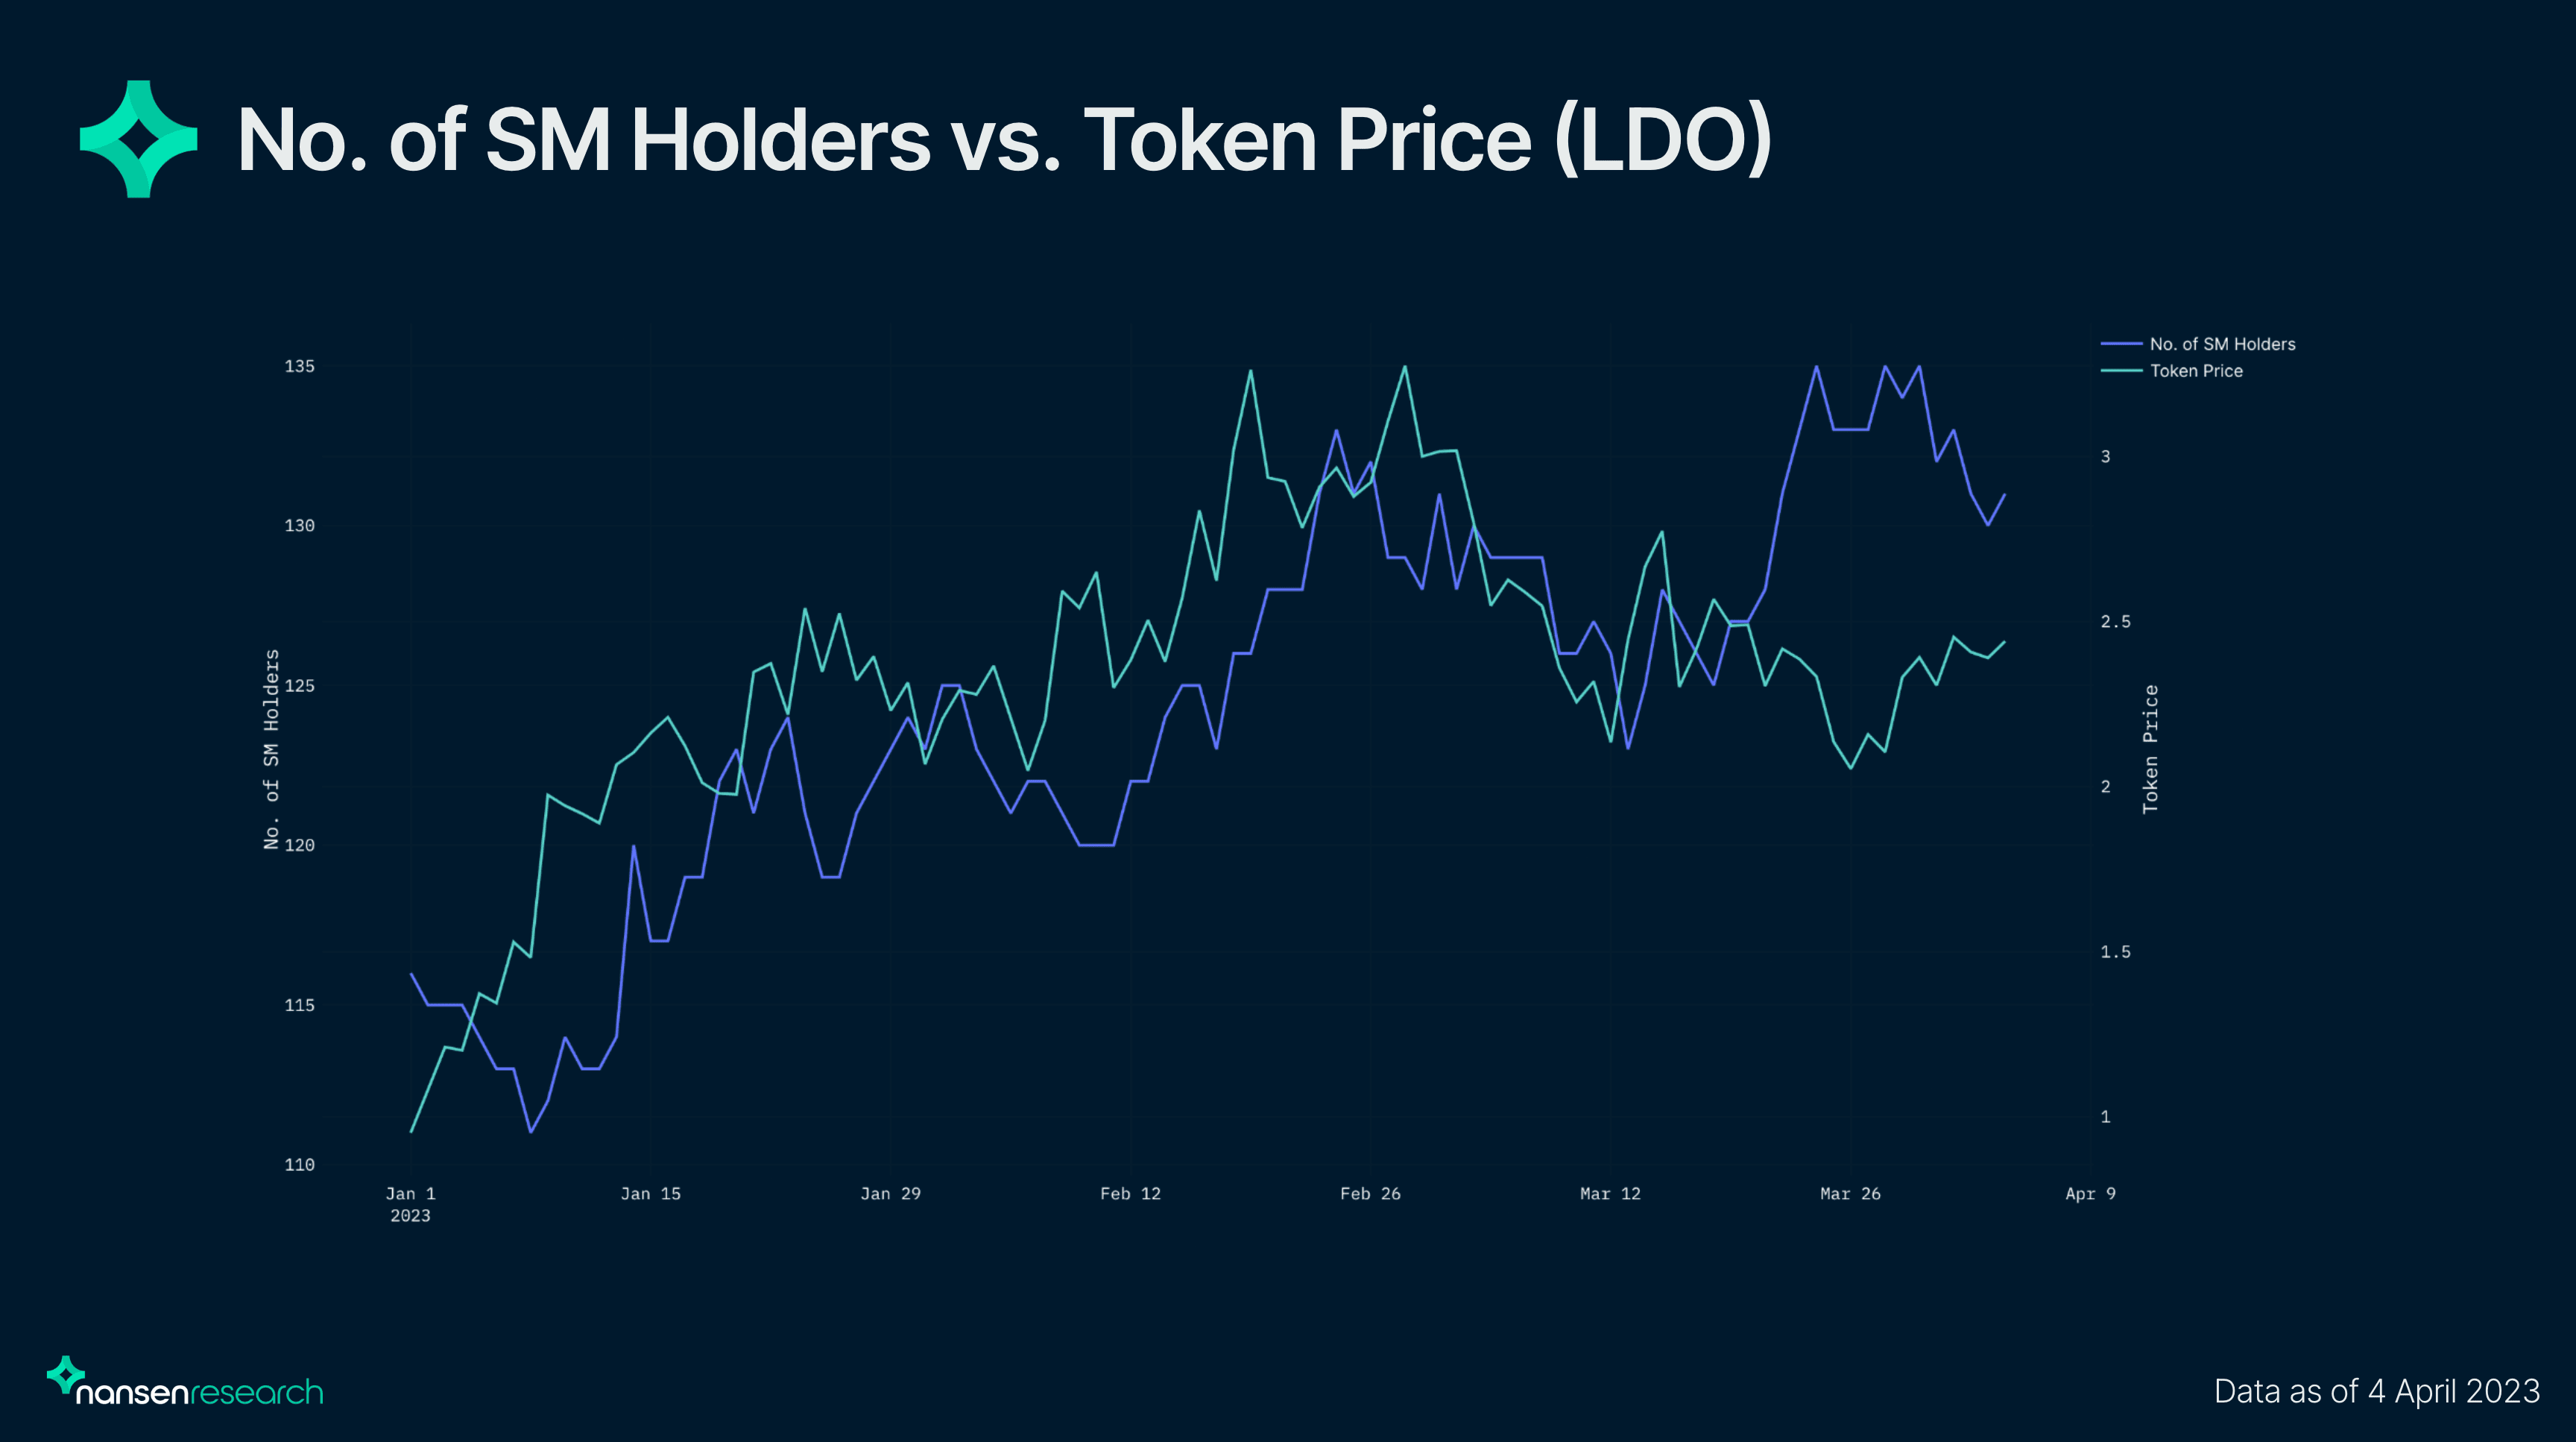
For RPL, the token had a 25% increase in the number of Smart Money holders from the first week of January. The change in the number of Smart Money holders for RPL relative to token price suggested that Smart Money holders were trading in and out of the token while the price slowly grinds up with the strengthening of the LSD narrative. Spikes in token prices were usually followed with a dip in number of Smart Money holders, suggesting that these holders were constantly taking profit on the run-up. The average number of Smart Money holders and inflow value for RPL is low compared to similar tokens like LDO, suggesting that Smart Money’s confidence in the token was not as high. Despite this, Smart Money seems to have lagged behind on LDO’s rapid run-up as shown in the chart below.
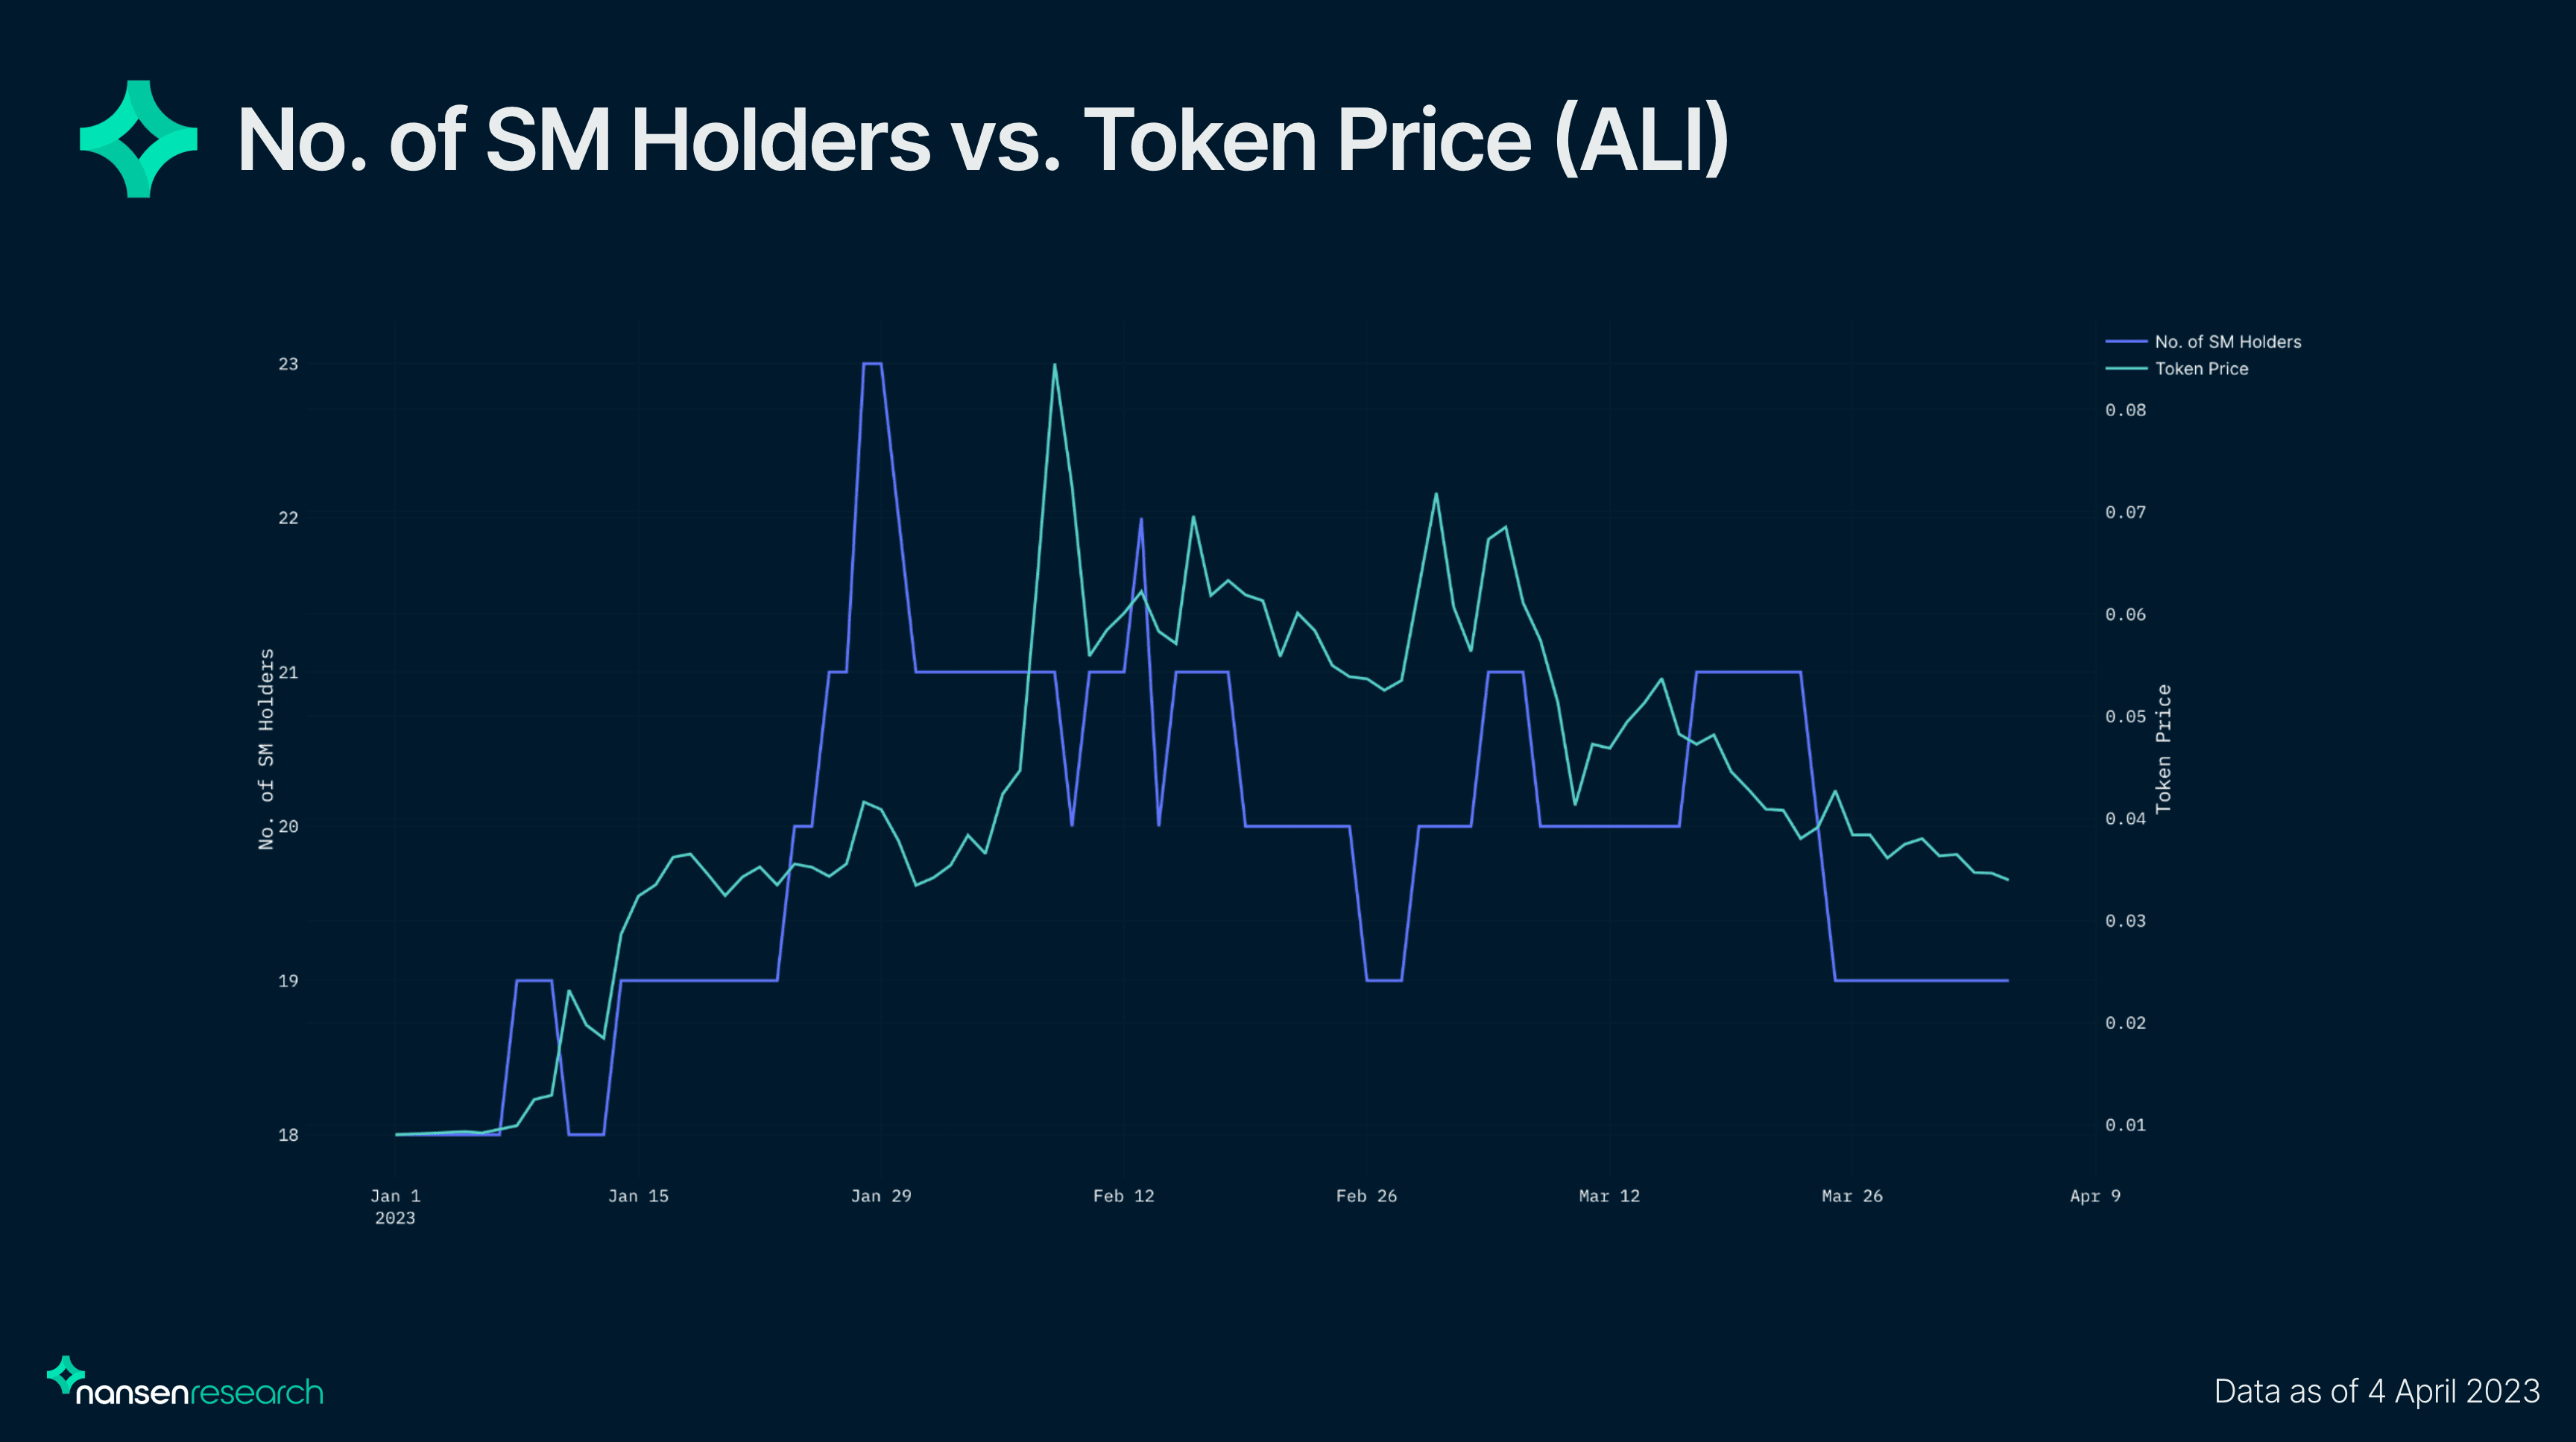
For AI tokens, the number of Smart Money holders decreased on price spikes for the tokens, suggesting that they managed to get in early and were de-risking on the run-up. The highest percentage increase for FET holders happened on February 5, shortly before the price of FET increased by over 70% on February 8. However, FET had low Smart Money allocation in terms of the number of holders and inflow value and hence, might not be a good example for comparing Smart Money movements to token performance due to low sample size. The highest percentage increase for ALI holders also coincided with a mini run-up for the token, whereby the increase in the number of holders happened on the week of January 22, shortly before the price rose by over 25% from January 22 to 29.
Overall, Smart Money holders have generally been profitable on these narrative trades, given that these narrative-driven tokens have done well in the past months in general.
We looked into the balance change of each token and how it impacts the price of these tokens in the week after the increase in the number of Smart Money holders to determine if there could be a correlation to the moves. For LDO and RPL - following in Smart Money’s footsteps would allow traders to be profitable in the next week. Higher inflow values as compared to other tokens probably signified Smart Money confidence in the token, as compared to ALI and SYN - whereby token prices dipped across the week. Thus, no clear correlation could be established for narrative-driven tokens using this analysis.
Note: FET was not included due to the anomaly in inflow value and low sample size.
Mid-cap Tokens
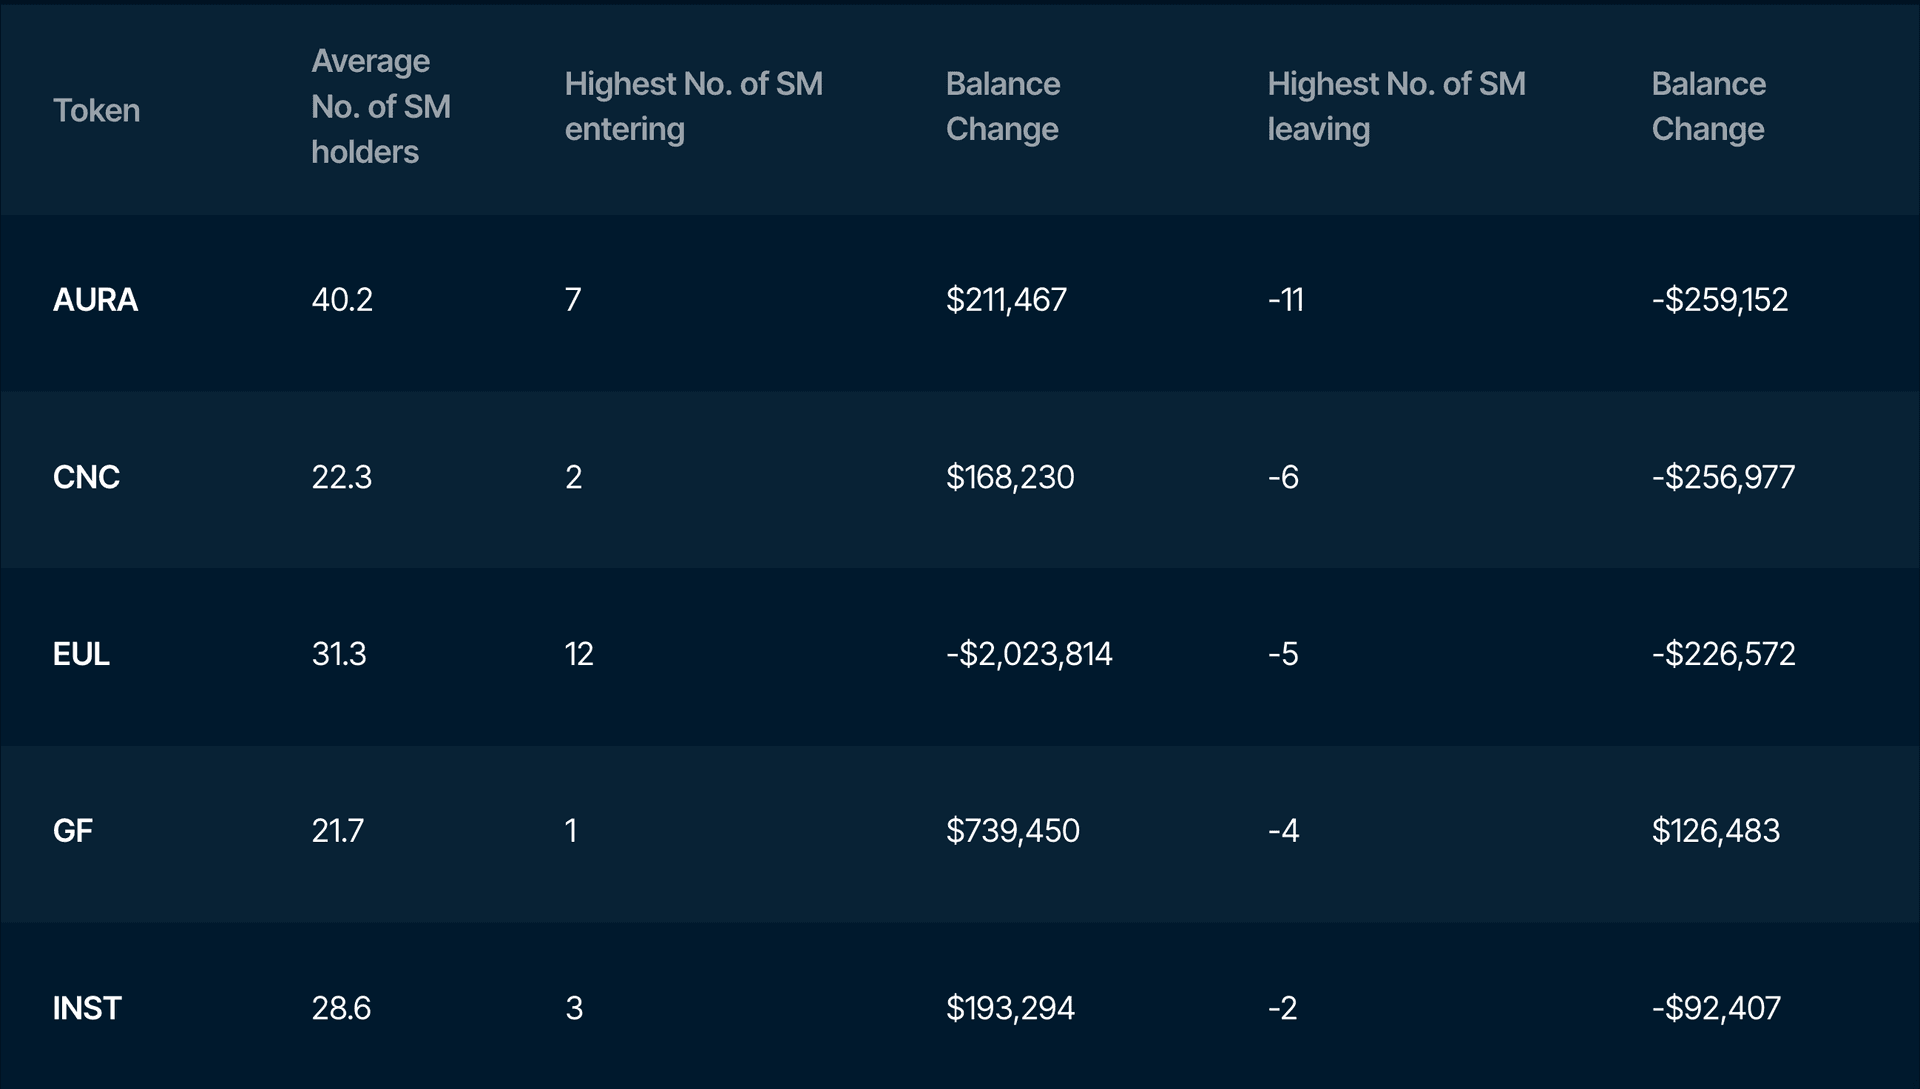
Tokens under the mid cap category include AURA, CNC, EUL, GF and INST.
Mid-cap tokens are generally defined as tokens with a current market capitalization between $15m and $100m.
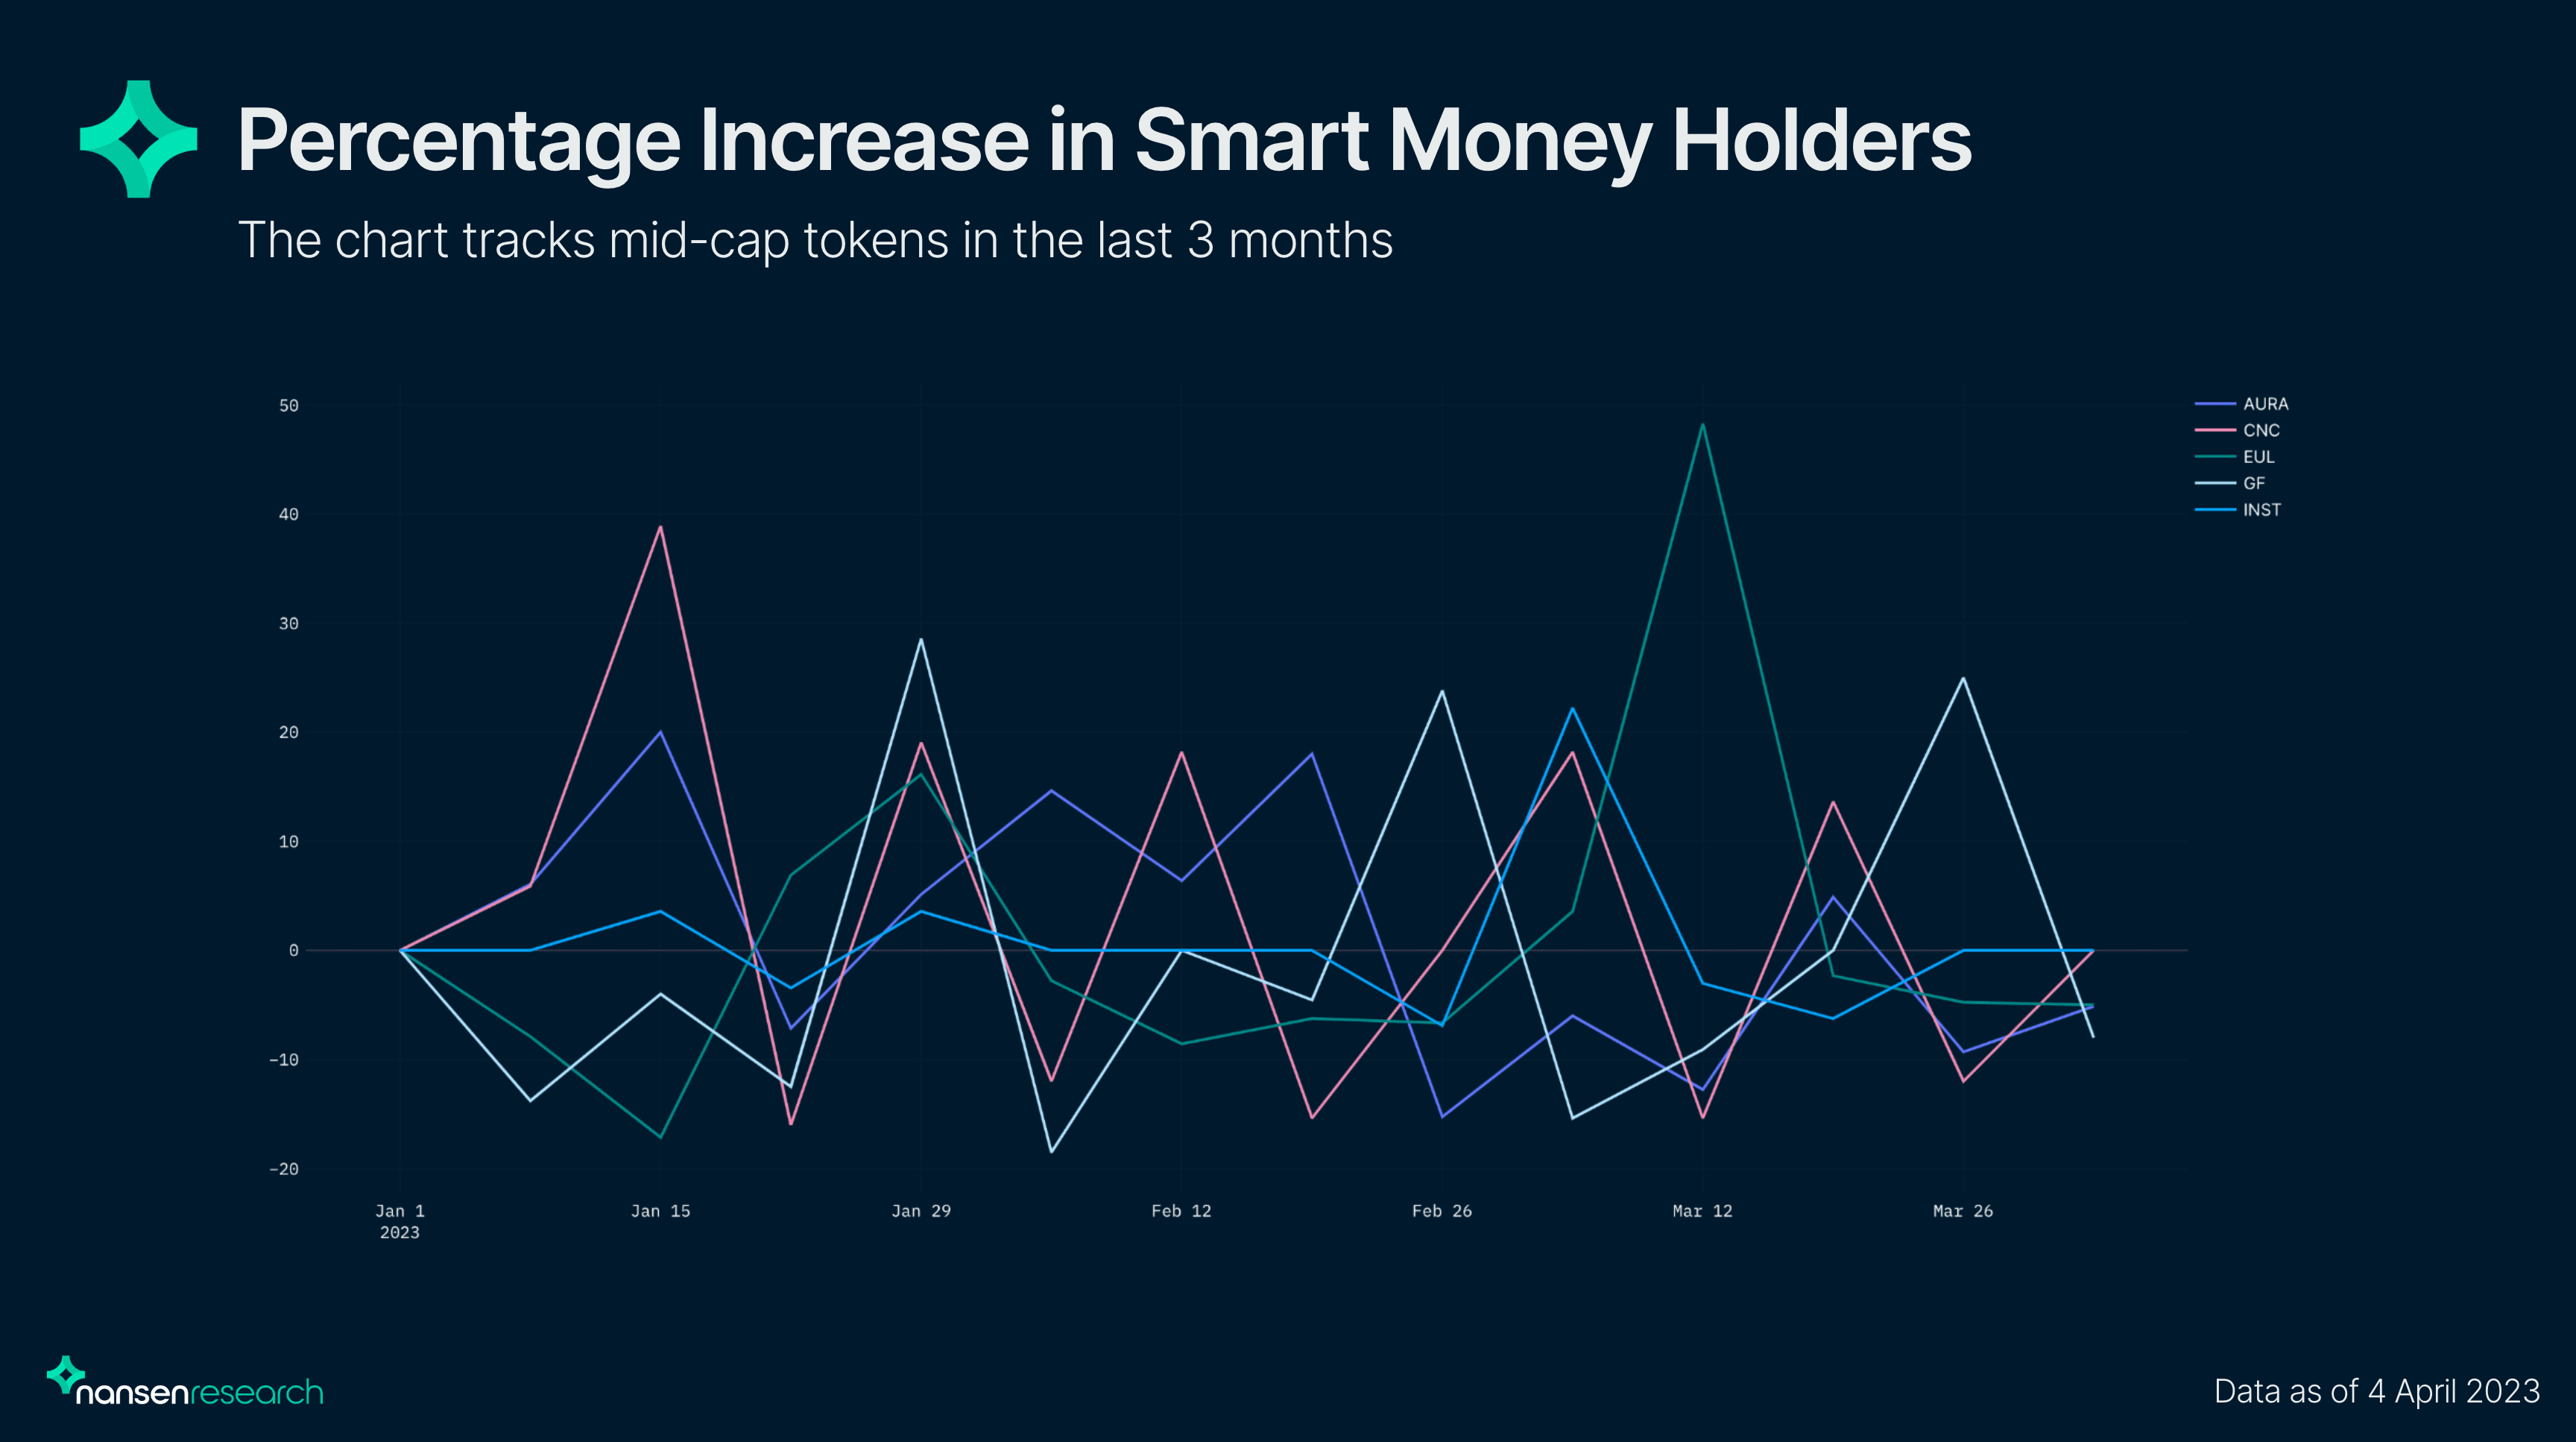
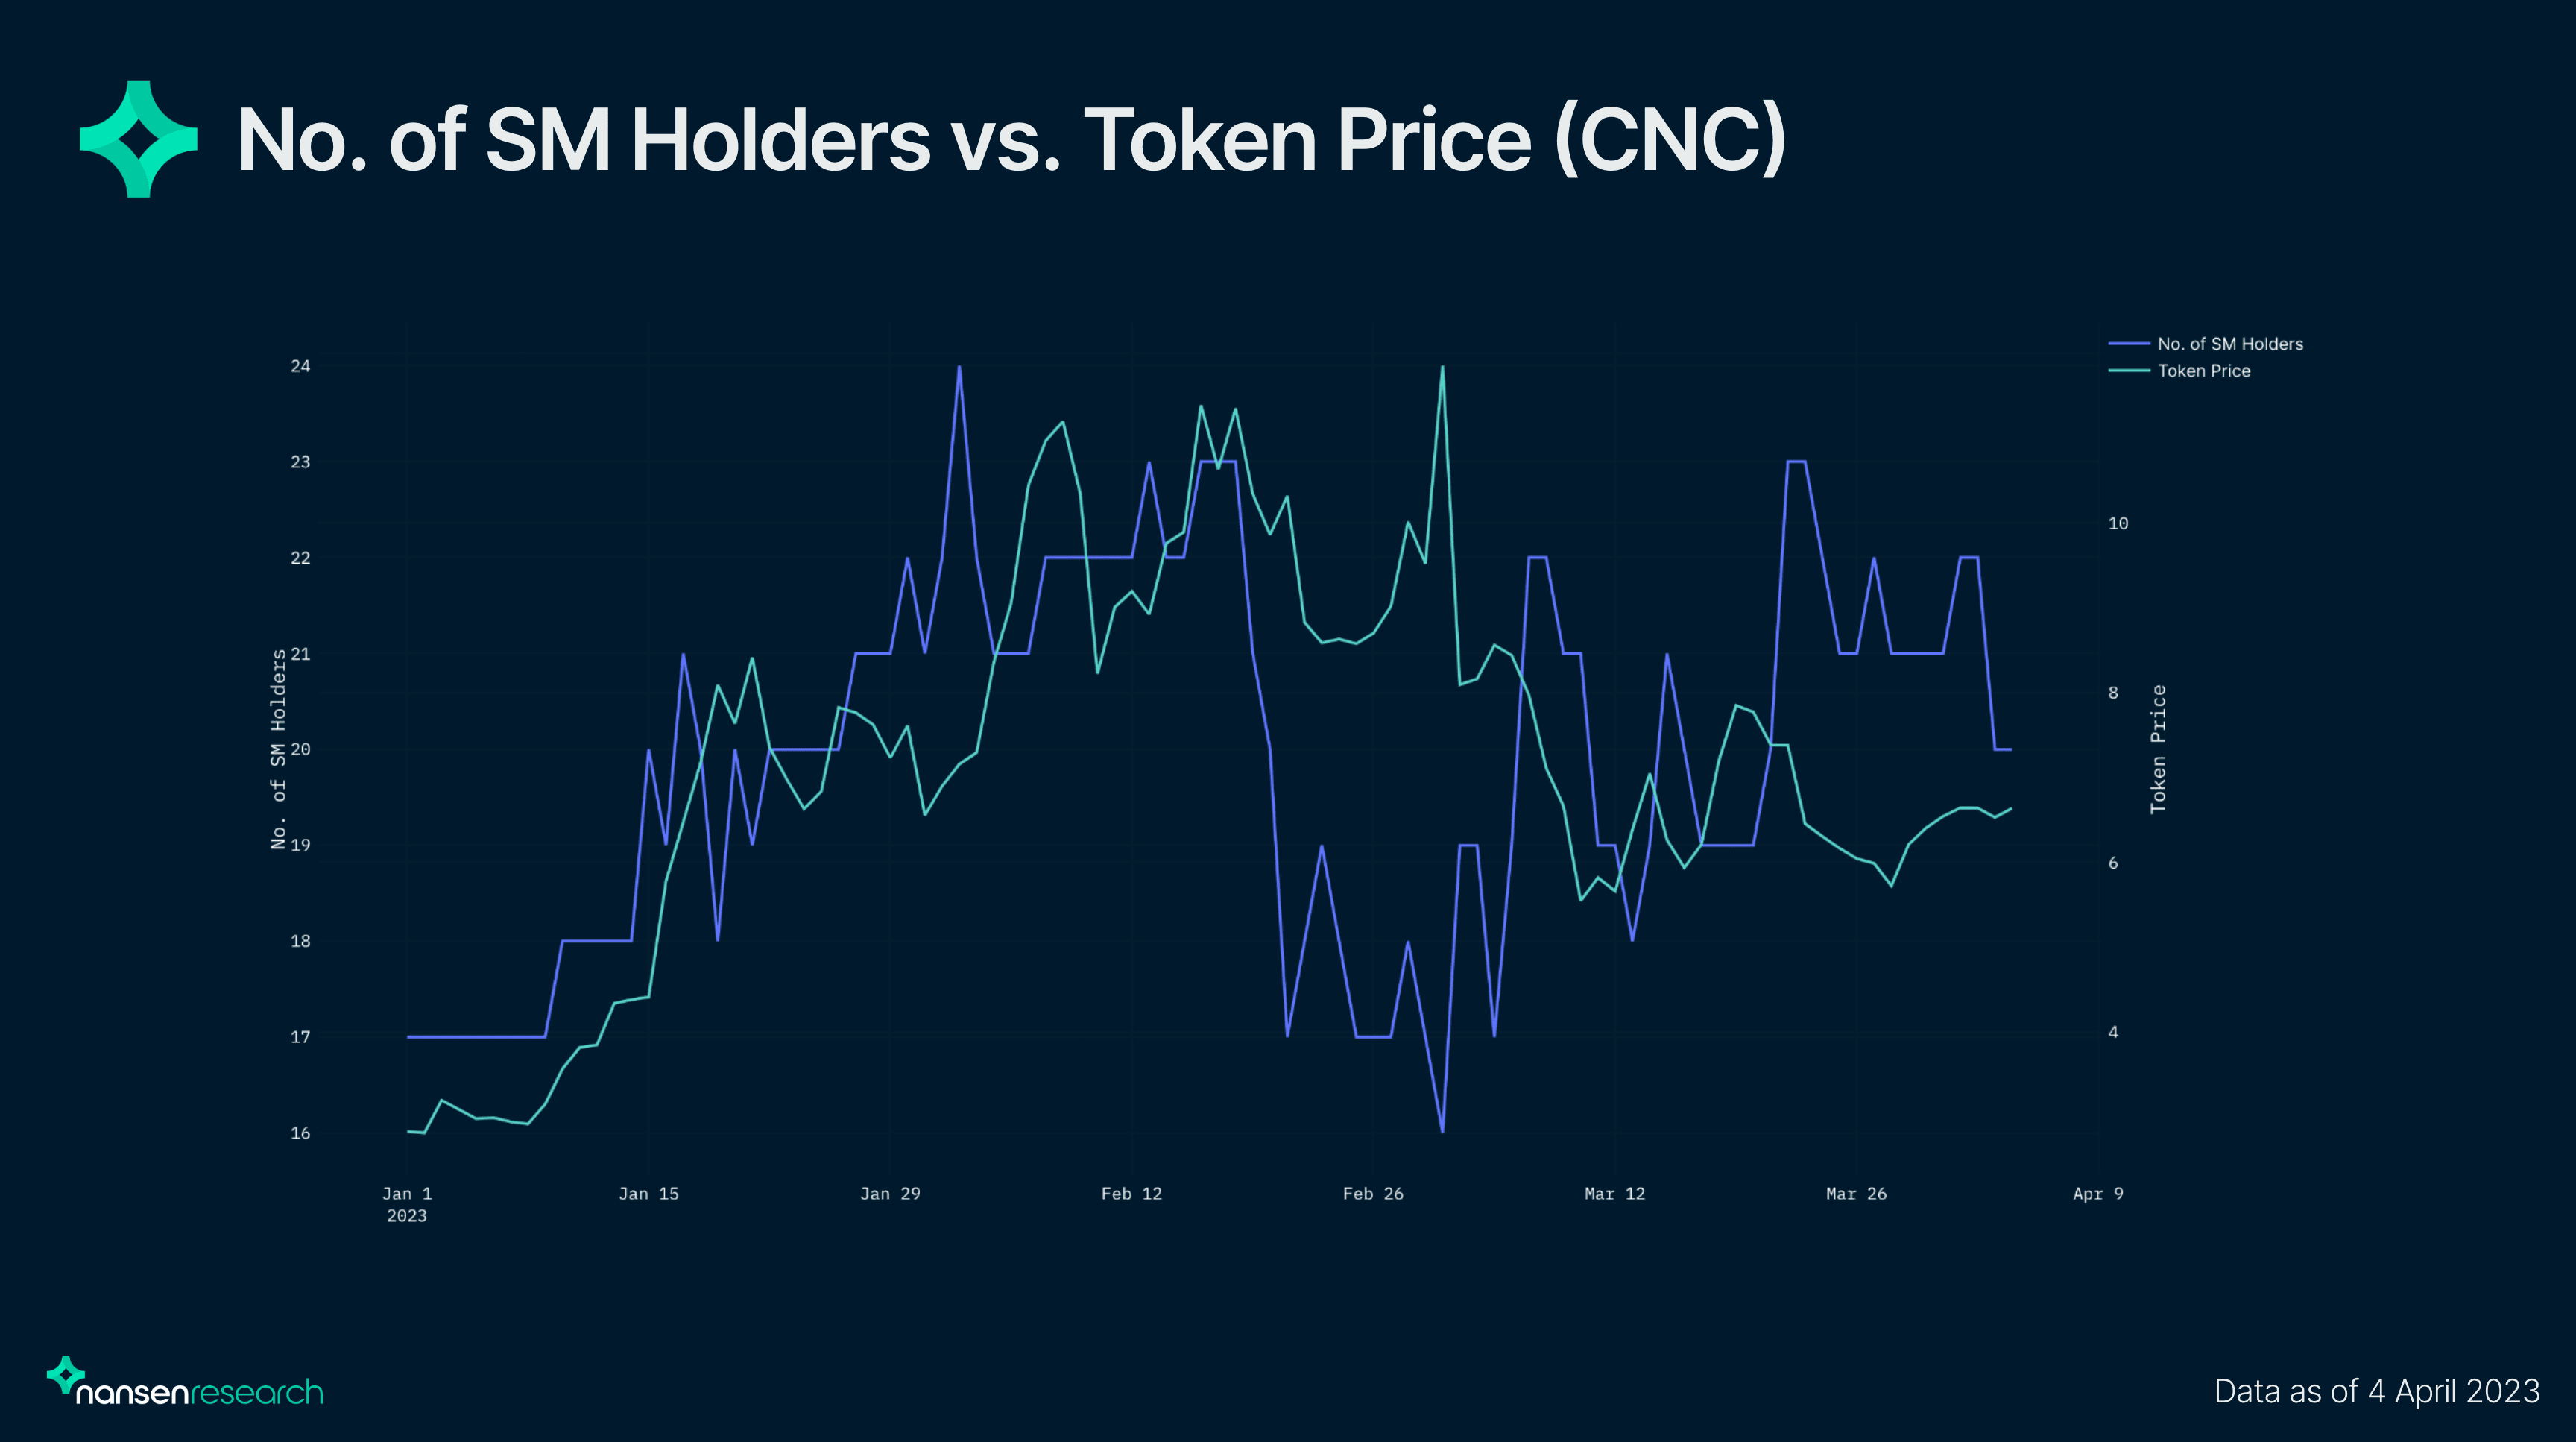
For CNC, the token experienced a 16% increase in the number of Smart Money holders on the week of January 8, which happened shortly before the token’s run-up in price to almost 2x from January 8 to 20. Smart Money looked to be early to the movements from January 31 to February 8 as well but subsequent spikes and troughs for the number of Smart Money holders did not really coincide with price action.
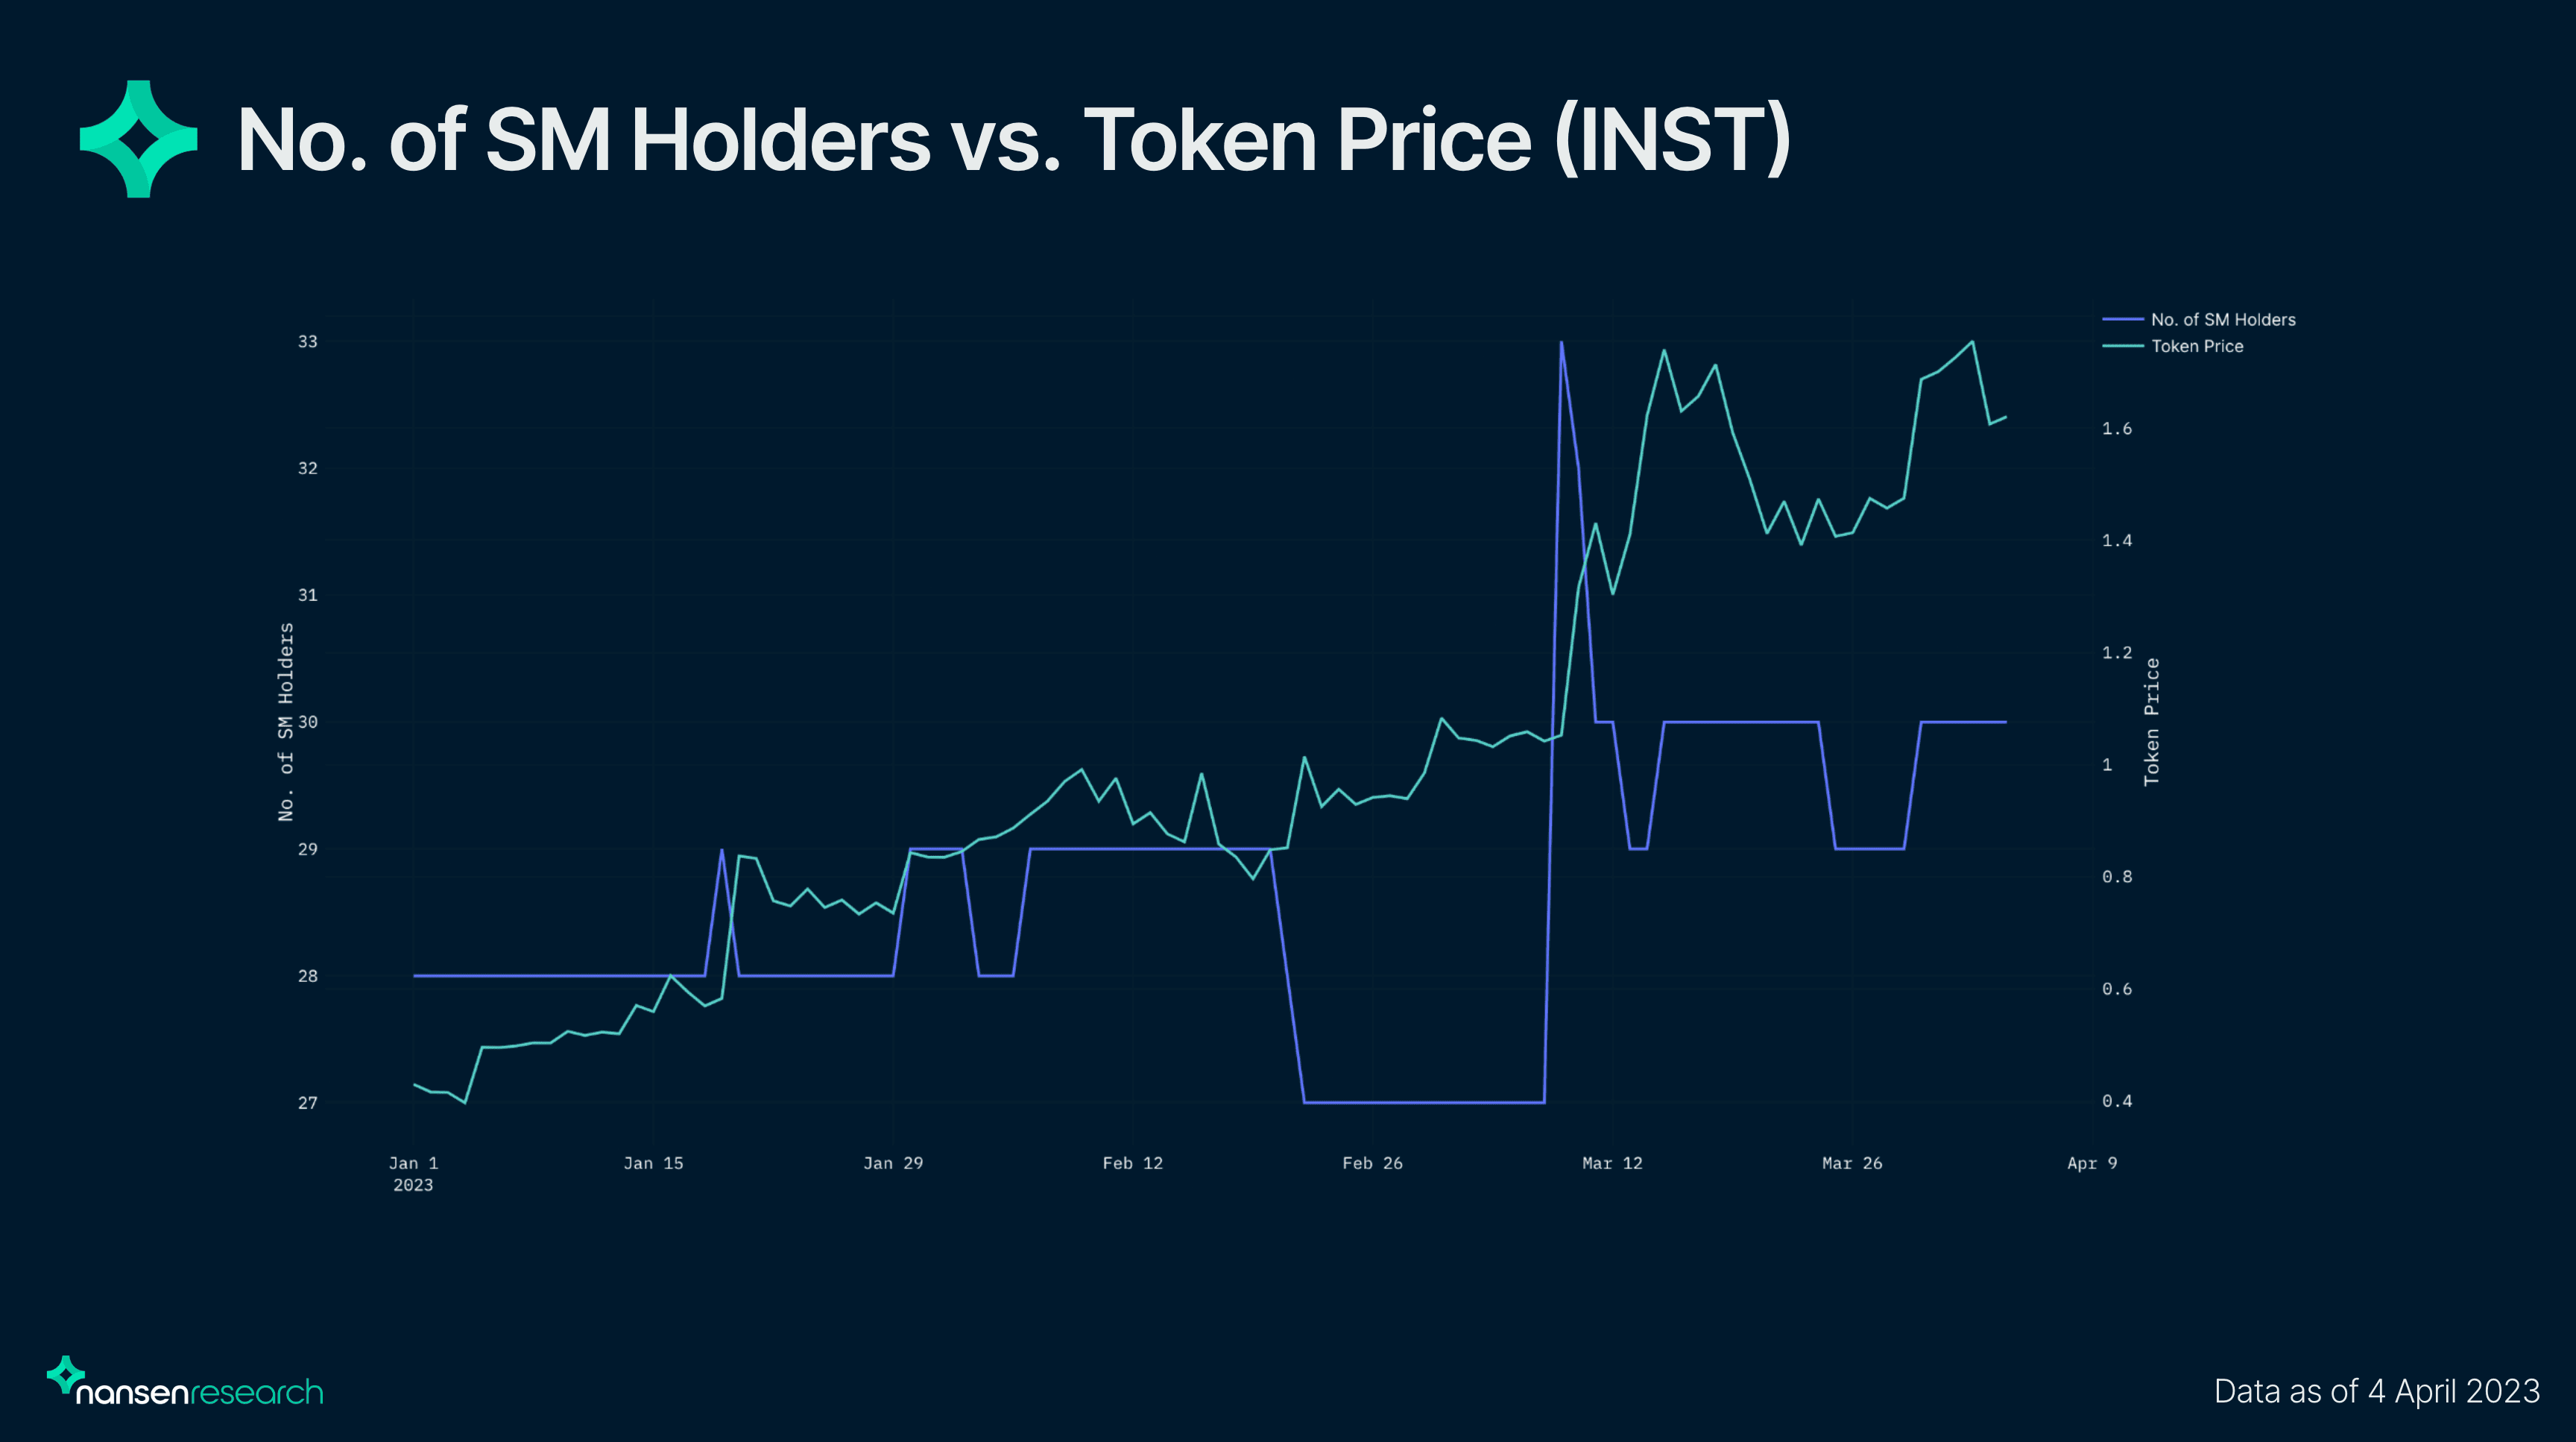
INST had relatively low movement in terms of changes in Smart Money holders until the week of March 5, whereby the percentage of Smart Money holders increased by 22%. The price of INST increased by over 40% during that period, in line with the increase of Smart Money holders from March 5.
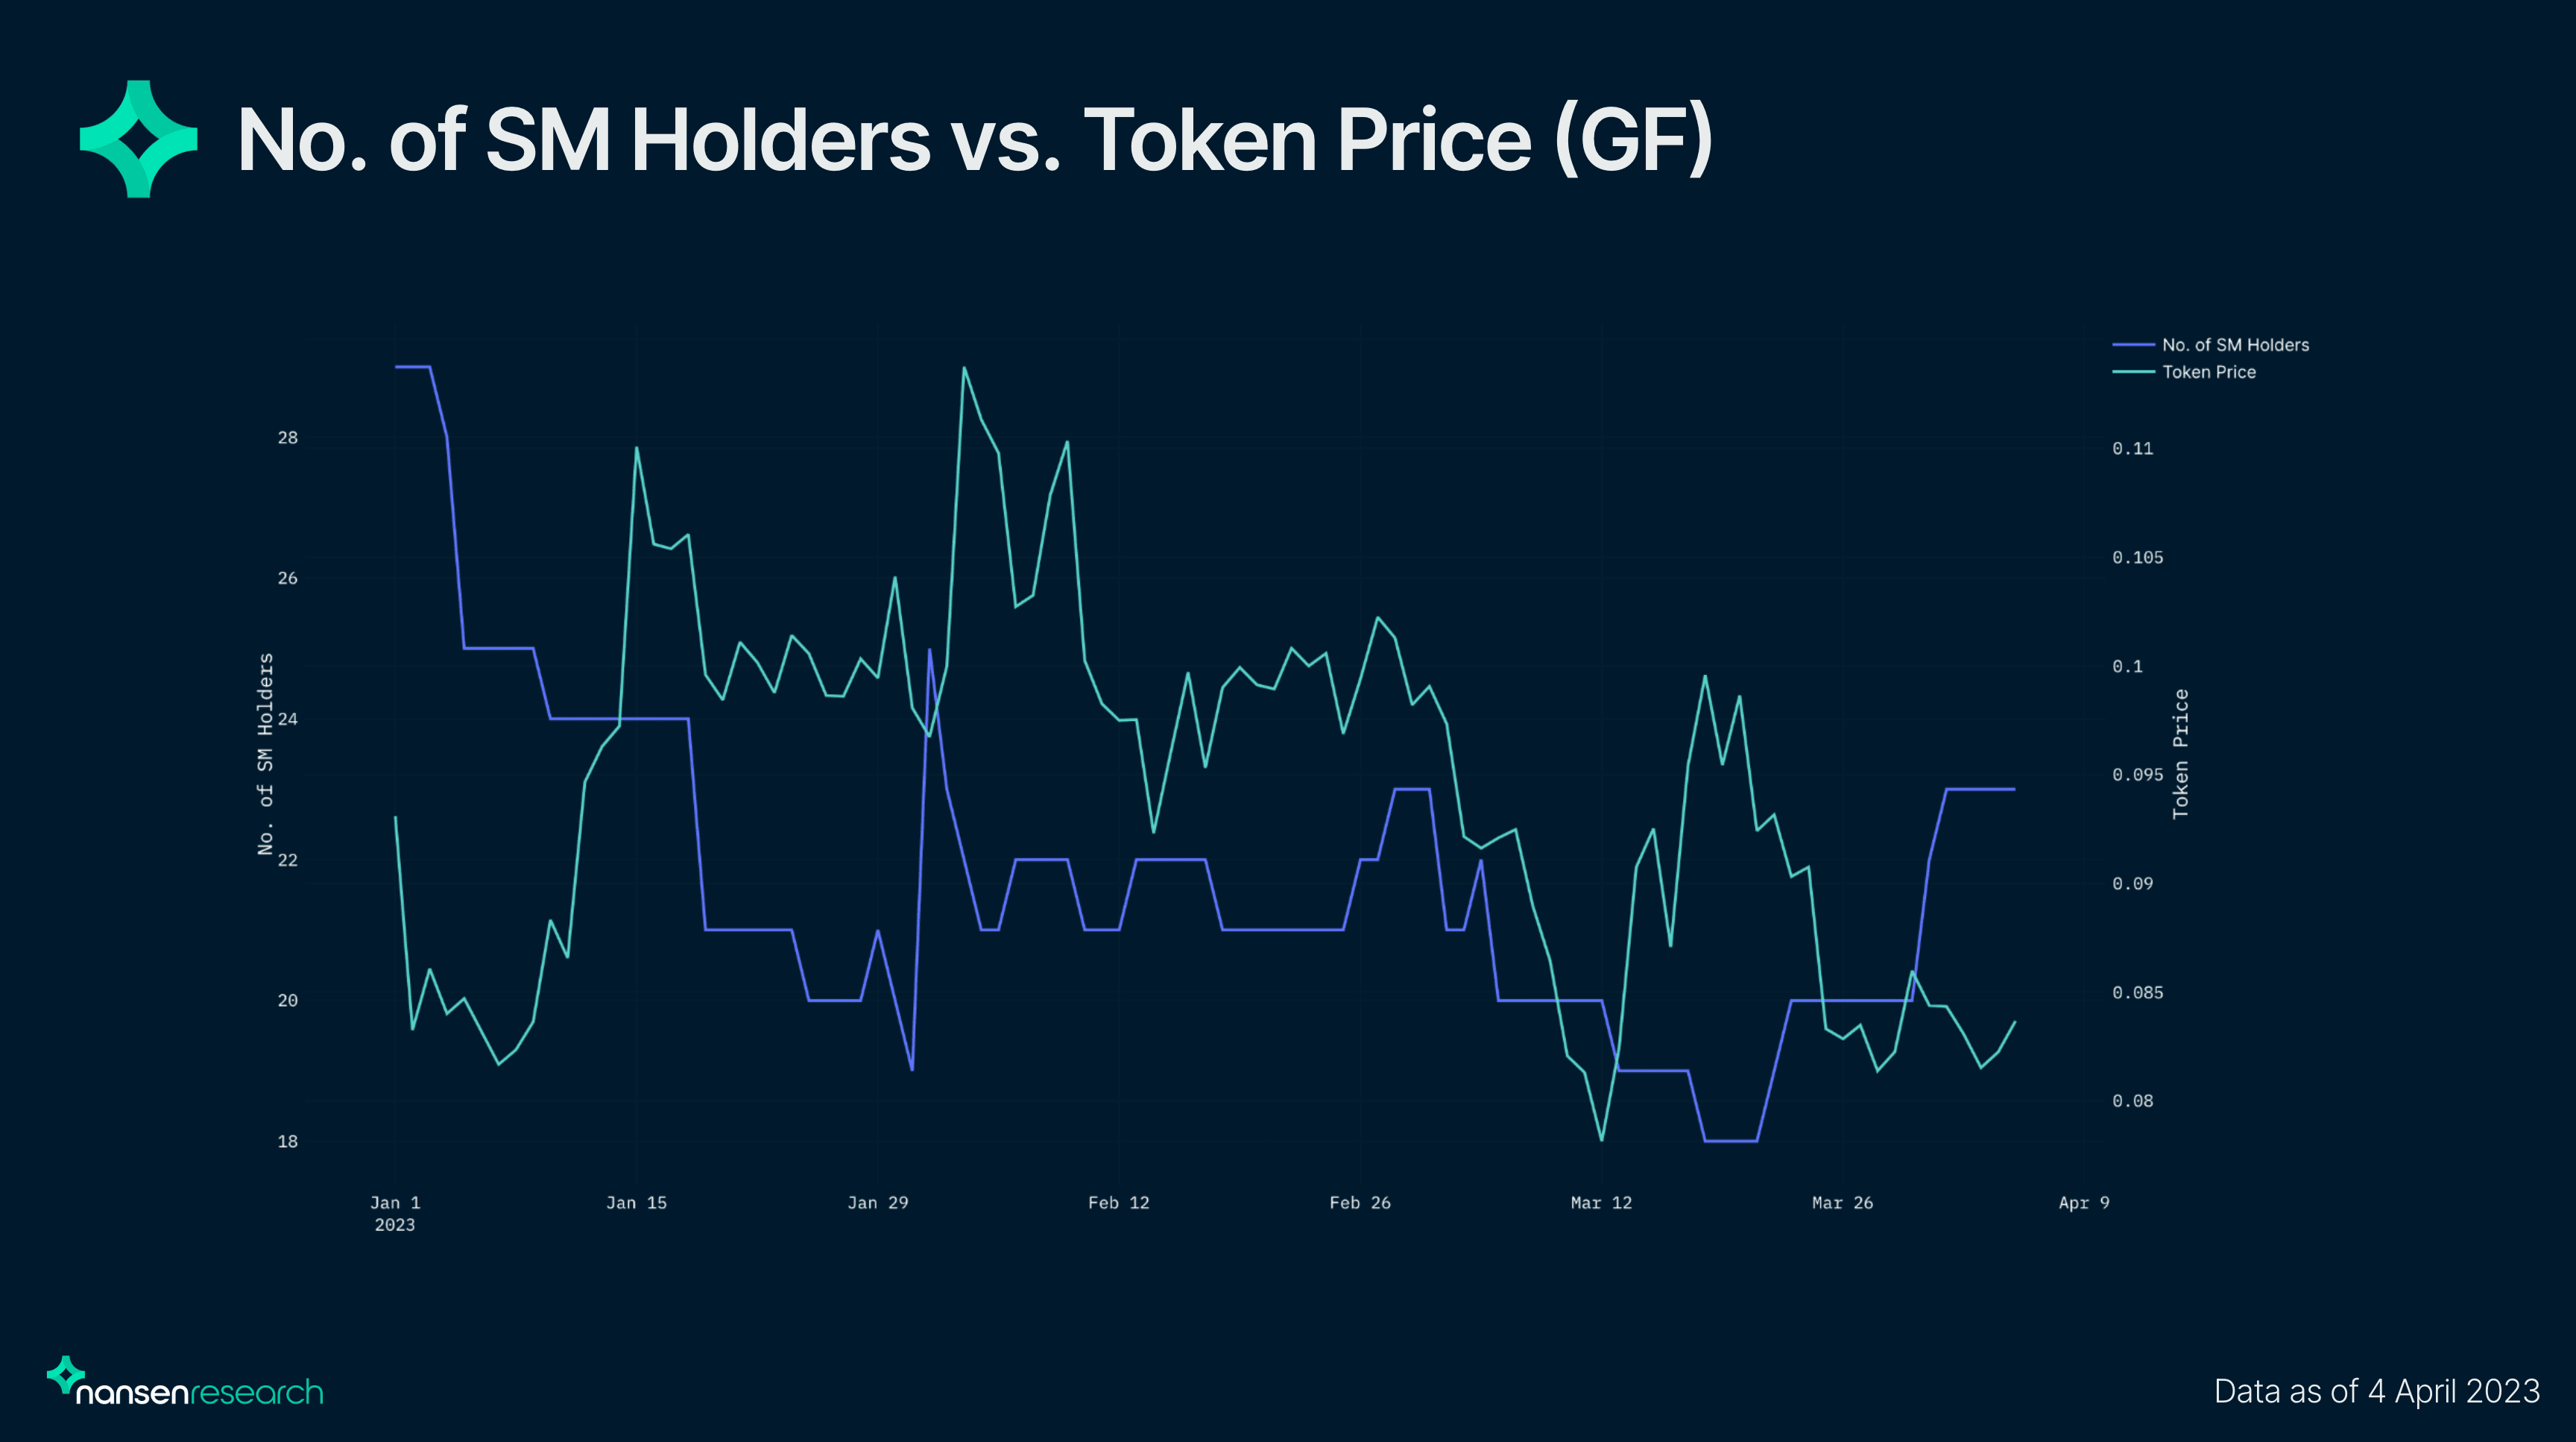
GF had experienced a decrease in the number of Smart Money holders right at the start of the year, despite its token price going up. Besides that, Smart Money looked to be trading in and out of the token and was able to identify the slight dip on January 30 before the token price increased by over 10%. However, subsequent spikes and troughs seemed like Smart Money did not have much of an edge as they were not necessarily early to price spikes.
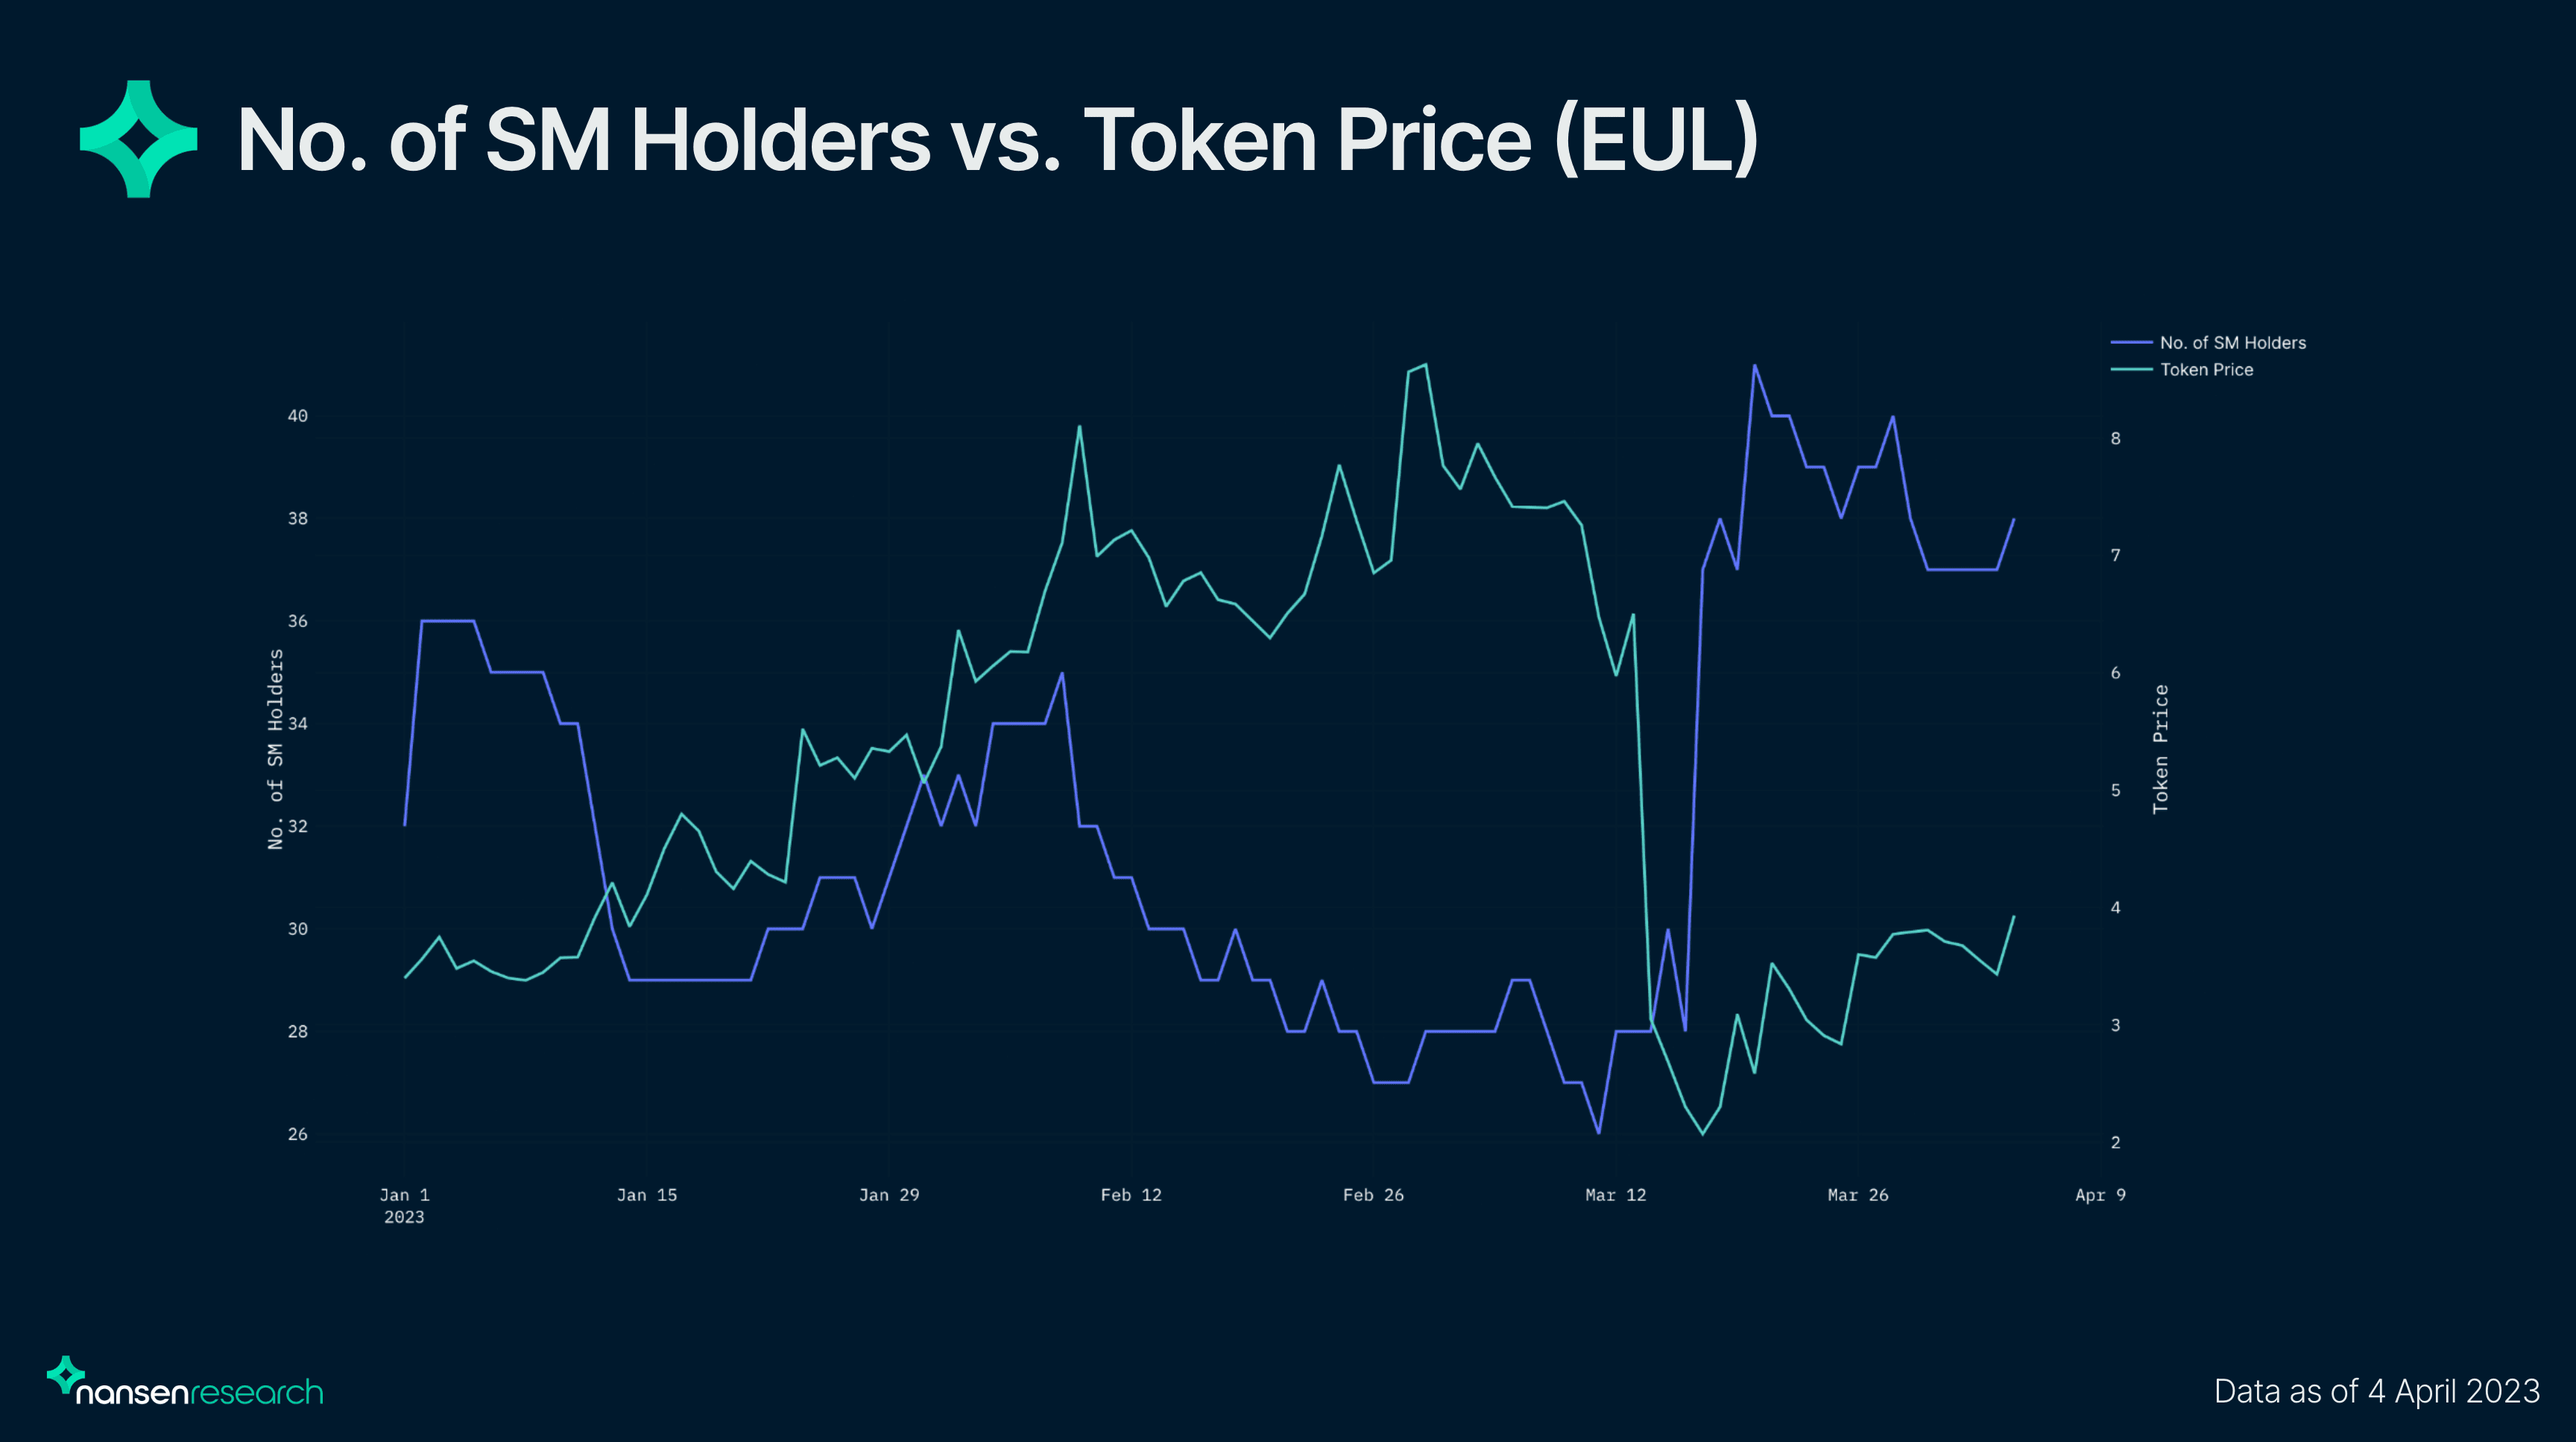
One token that is an anomaly in this analysis would be EUL. The token experienced a spike in Smart Money holders on the week of March 12, while its price dumped significantly due to the $197m exploit on the protocol. The increase in Smart Money holders for EUL could be attributed to users pulling their funds out of LPs which resulted in the uptick as their EUL tokens are sent to their wallets.
For AURA, CNC and INST - following in Smart Money’s footsteps would allow traders to be profitable in the next week as well. Total inflow values for these tokens were rather similar while the average inflow value per holder differed. AURA, which had an average inflow value per holder of ~$30k saw a price increase of 12.4% in the following week while CNC and INST which had an average inflow value per holder of ~$84k and ~$64k saw higher price increase of 95.9% and 23.8% in the following week respectively. Thus, higher inflow value per holder could signal conviction and could bring about greater price increases. However, while GF had a high inflow value per holder, the price of the token decreased by over 12% in the next week. This could be attributed to the fact that Smart Money holders had a shorter holding time for GF. The token also has the smallest market cap among all other tokens in this basket, which could have contributed to greater volatility and unpredictability in token prices.
Note: EUL was left out of the analysis due to the exploit which could skew the data points.
Overall, mid-cap tokens have more stability and hence, an increasing number of Smart Money holders could be a good indication of potential positive price movement.
Small-cap Tokens
Tokens under the small-cap category include BOTTO, INV, JPEG, NOTE, X2Y2.
Small-cap tokens are generally defined as tokens with a current market capitalization lower than $15m.
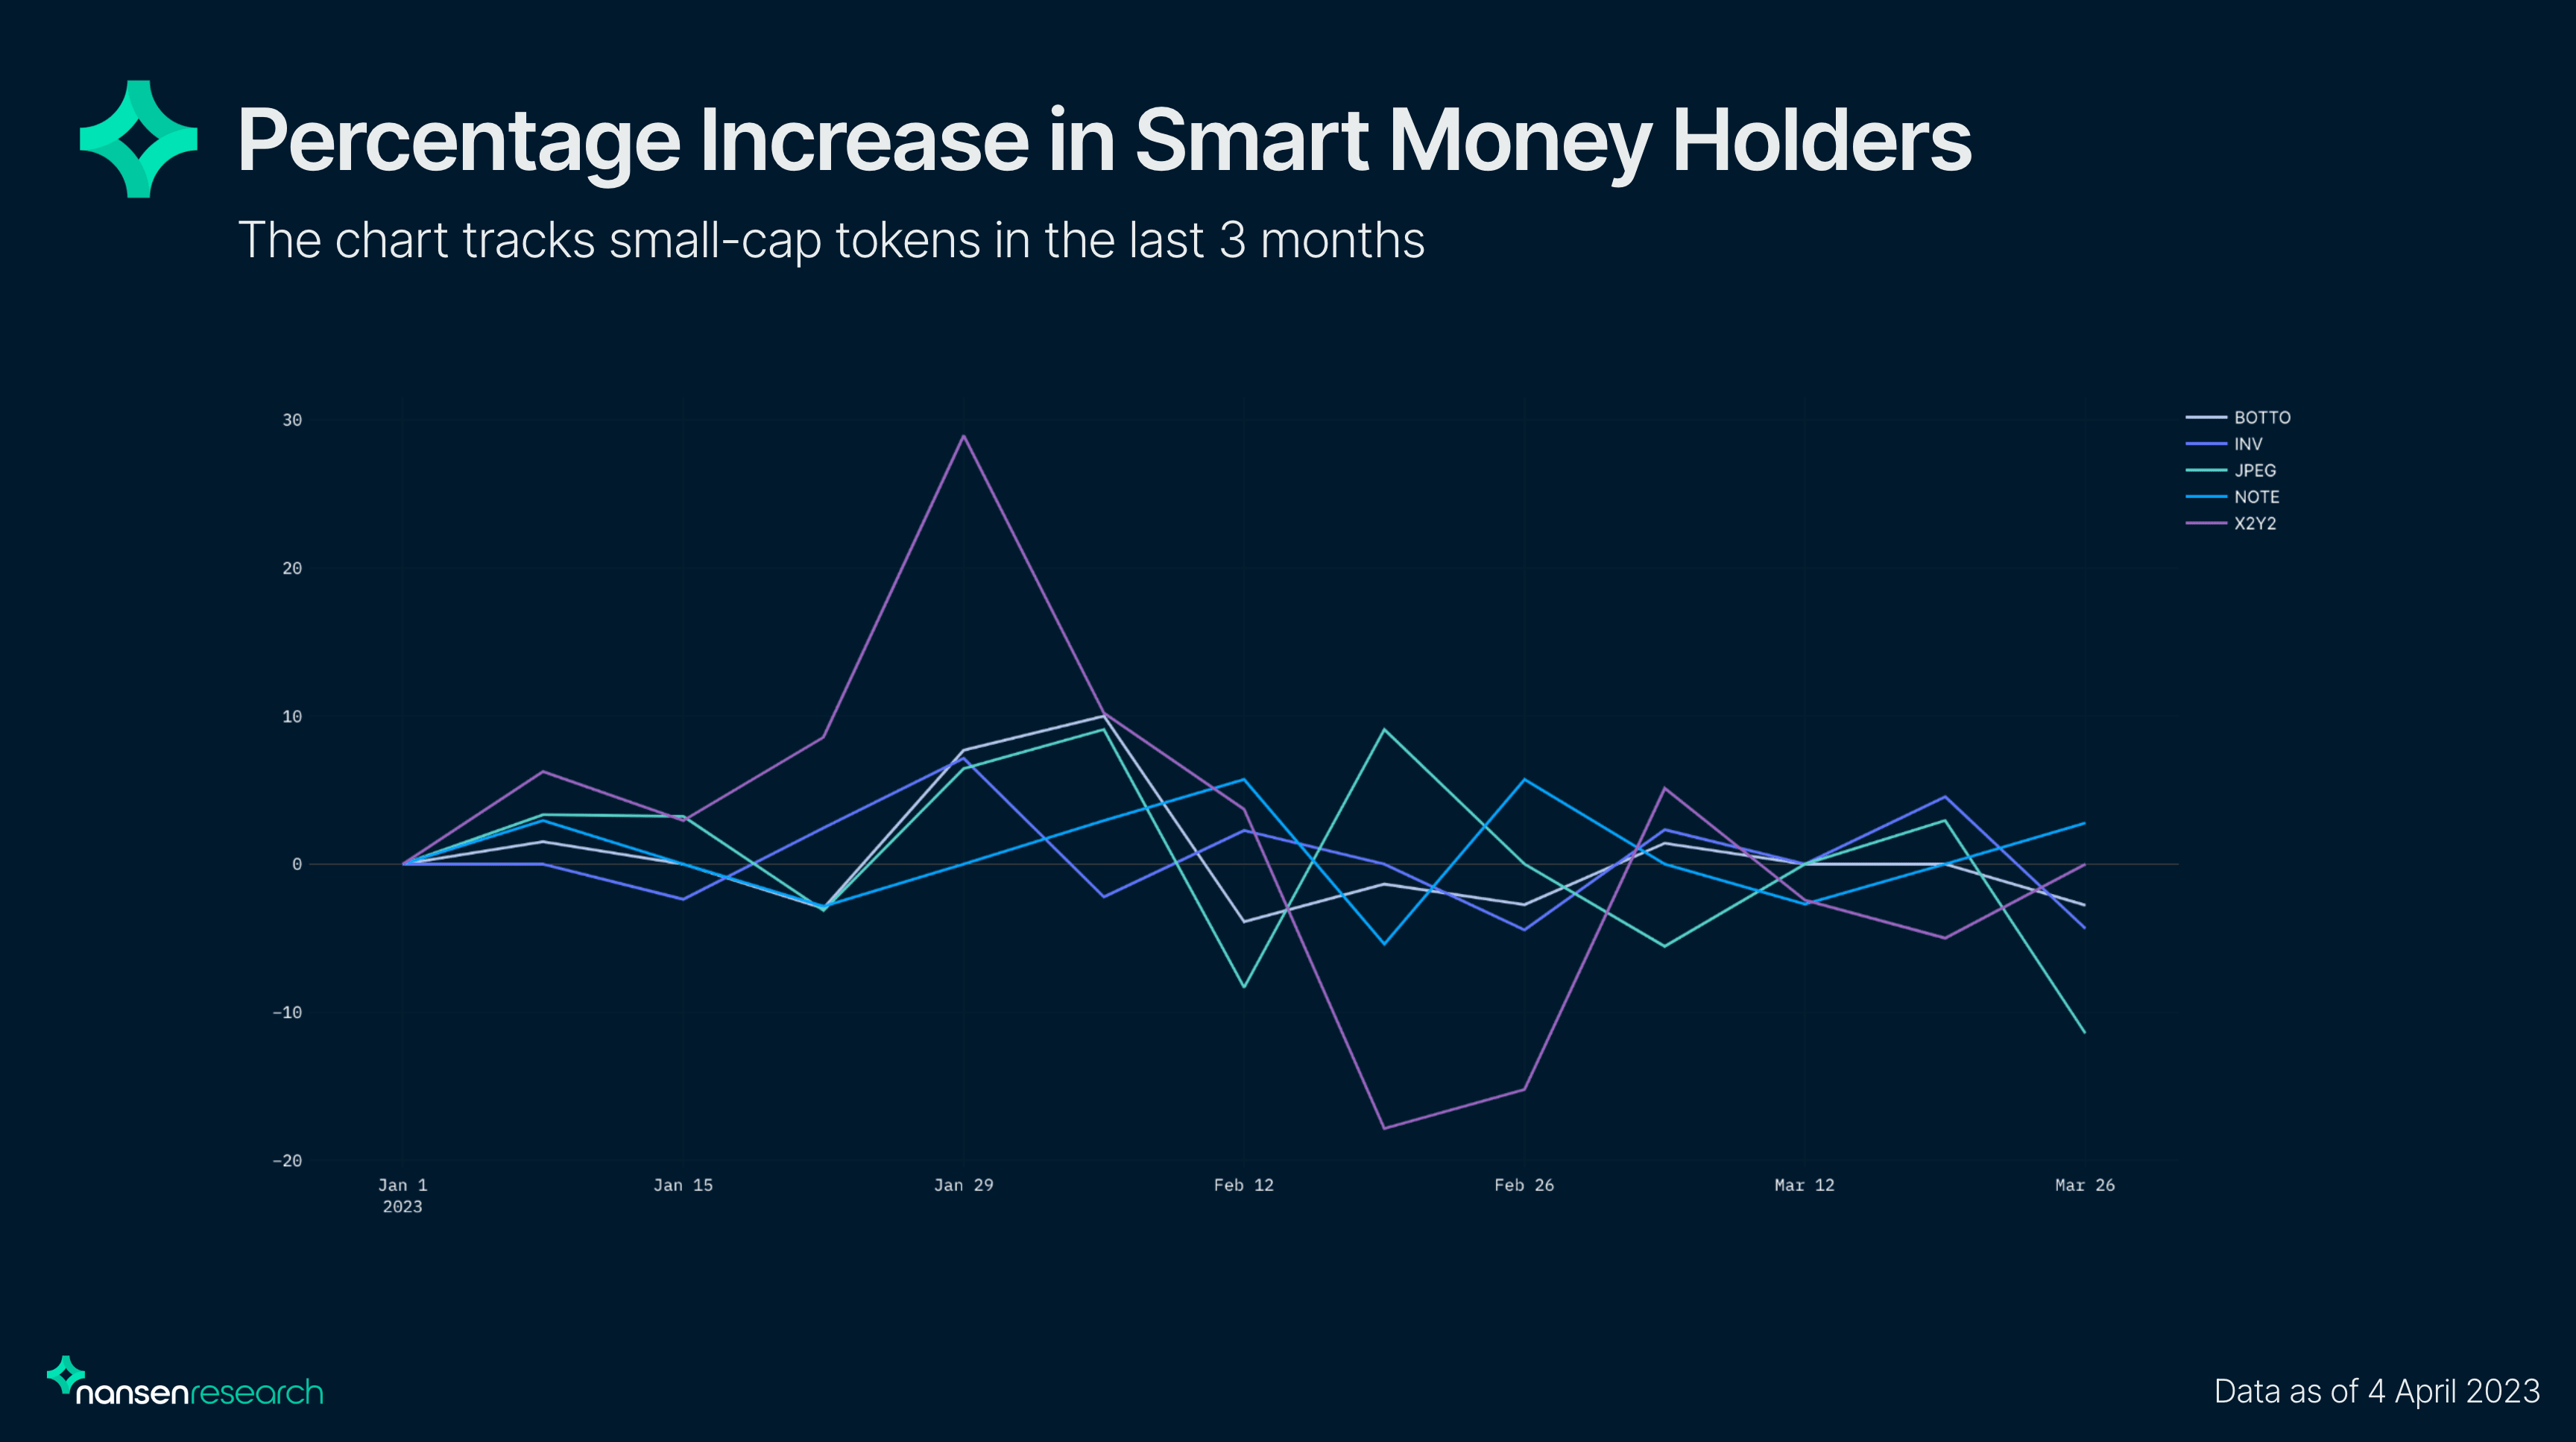
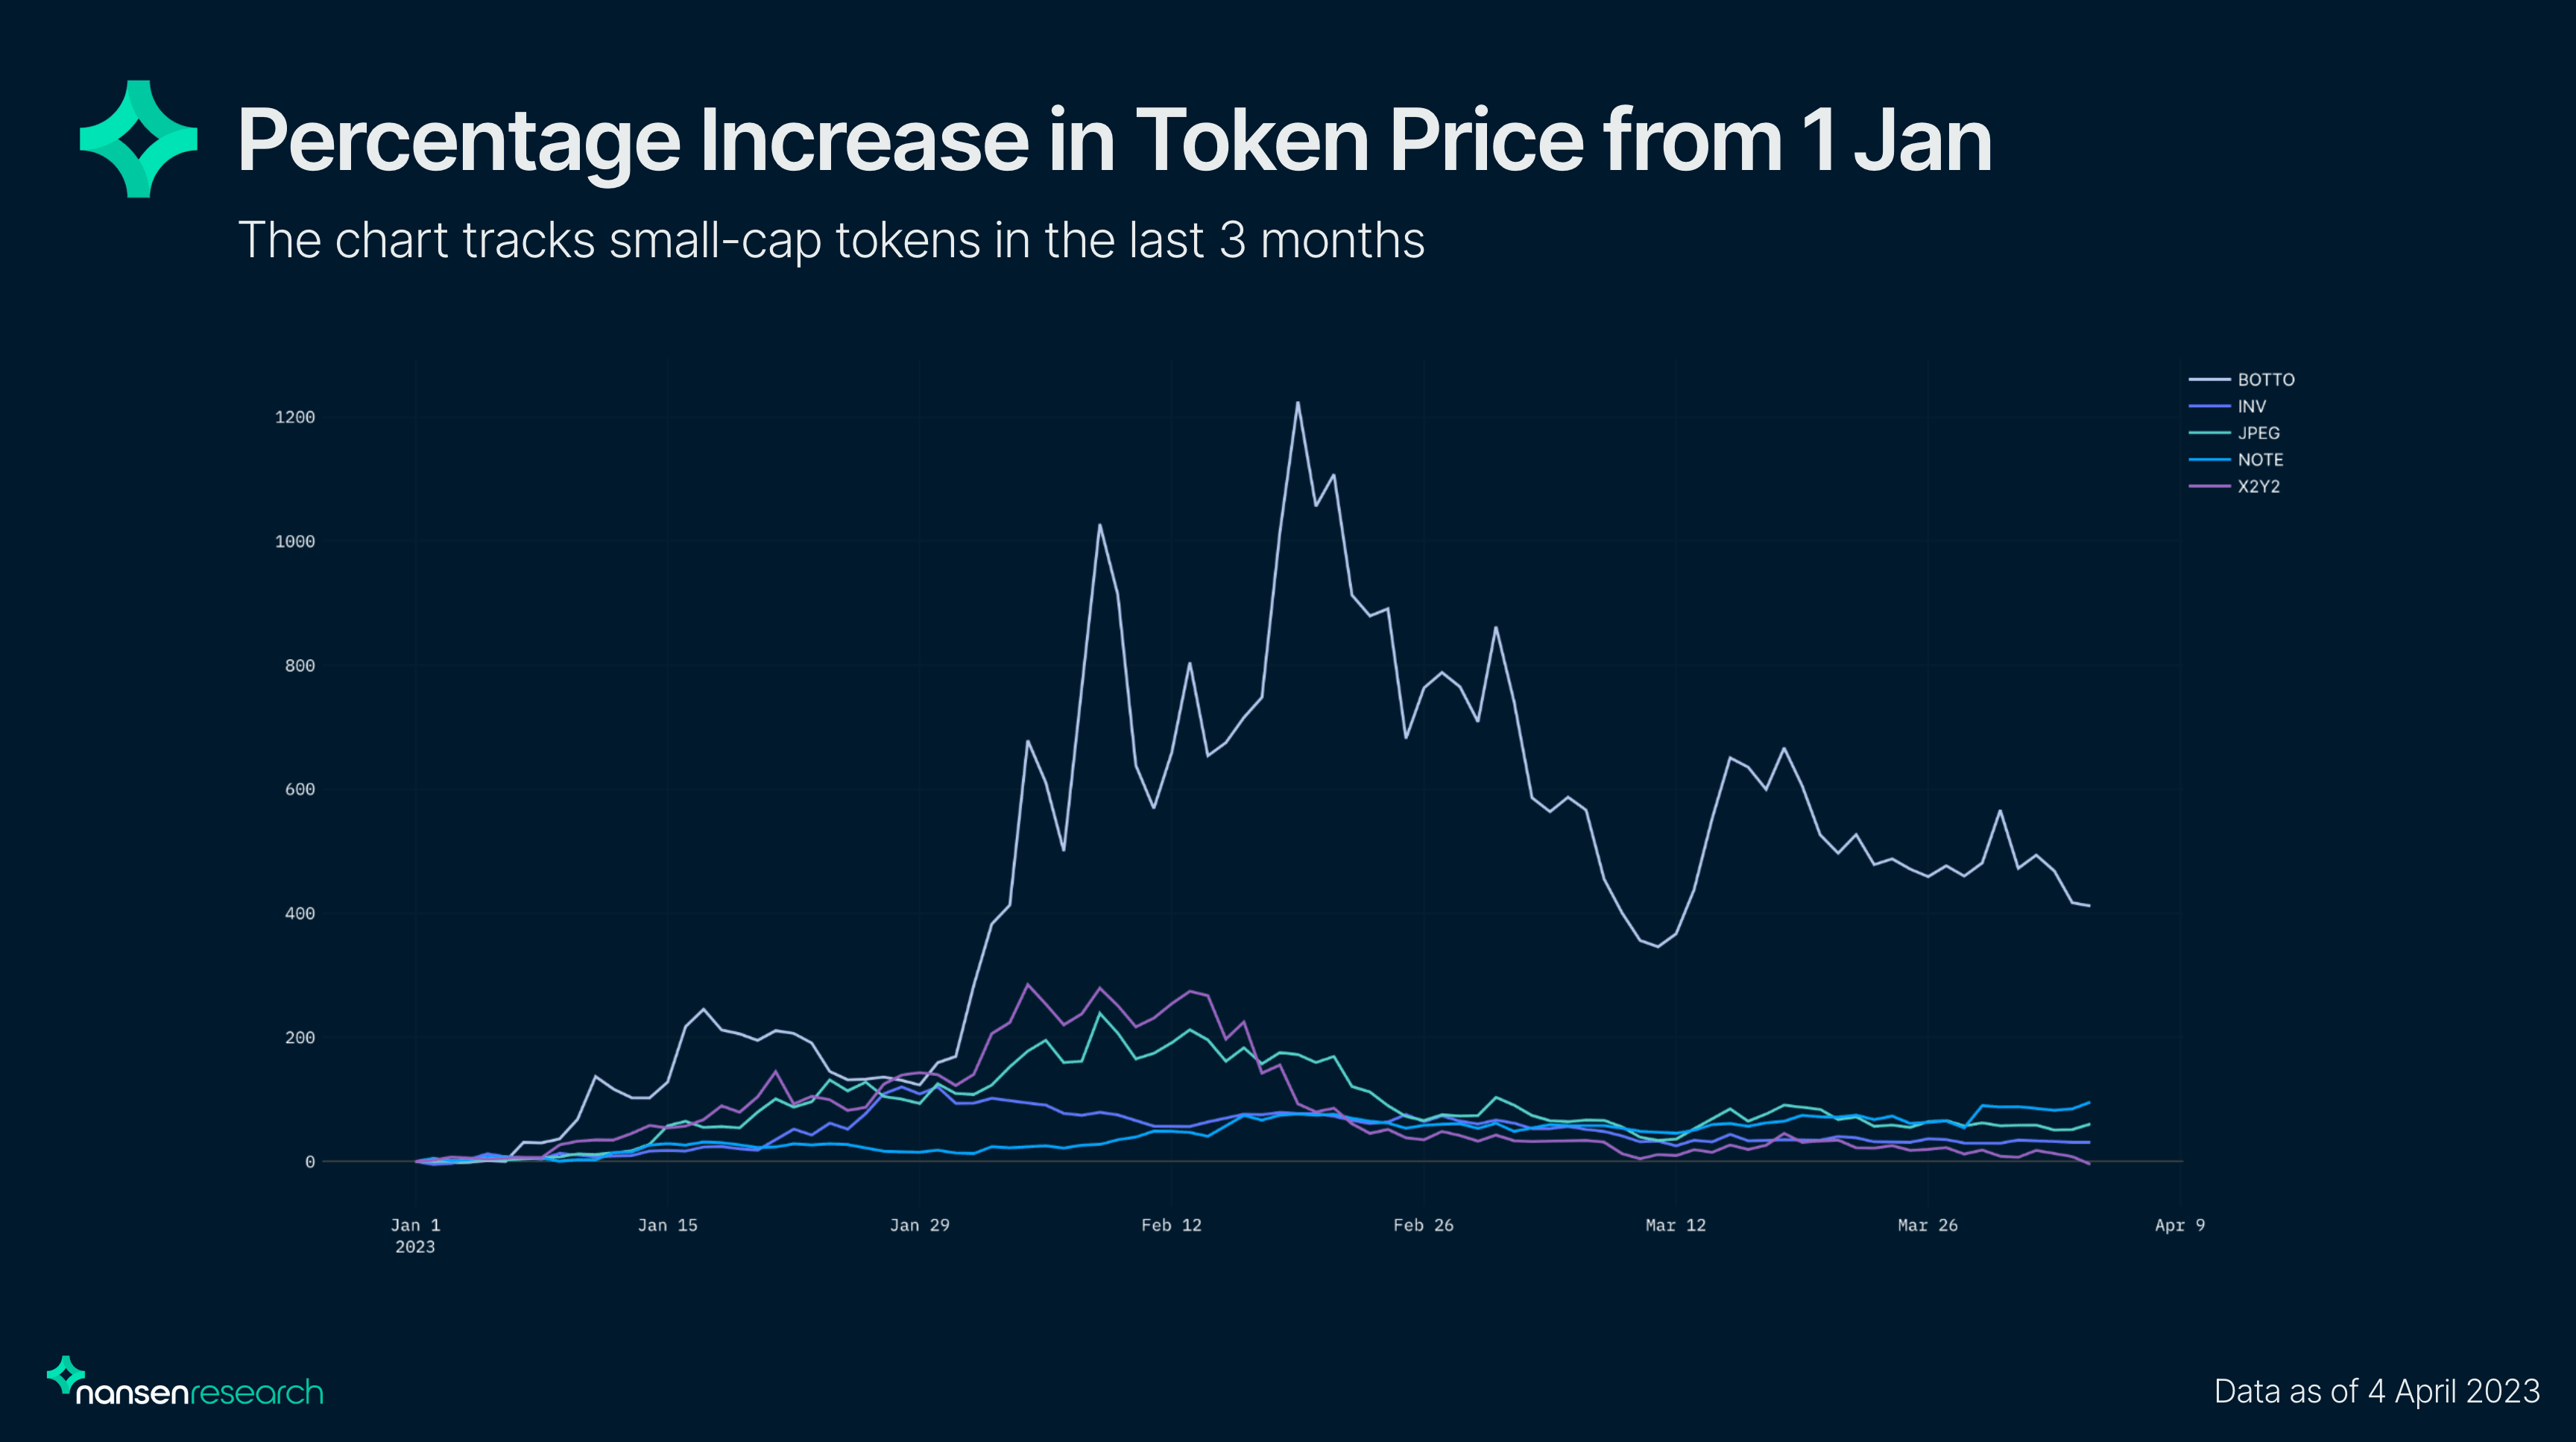
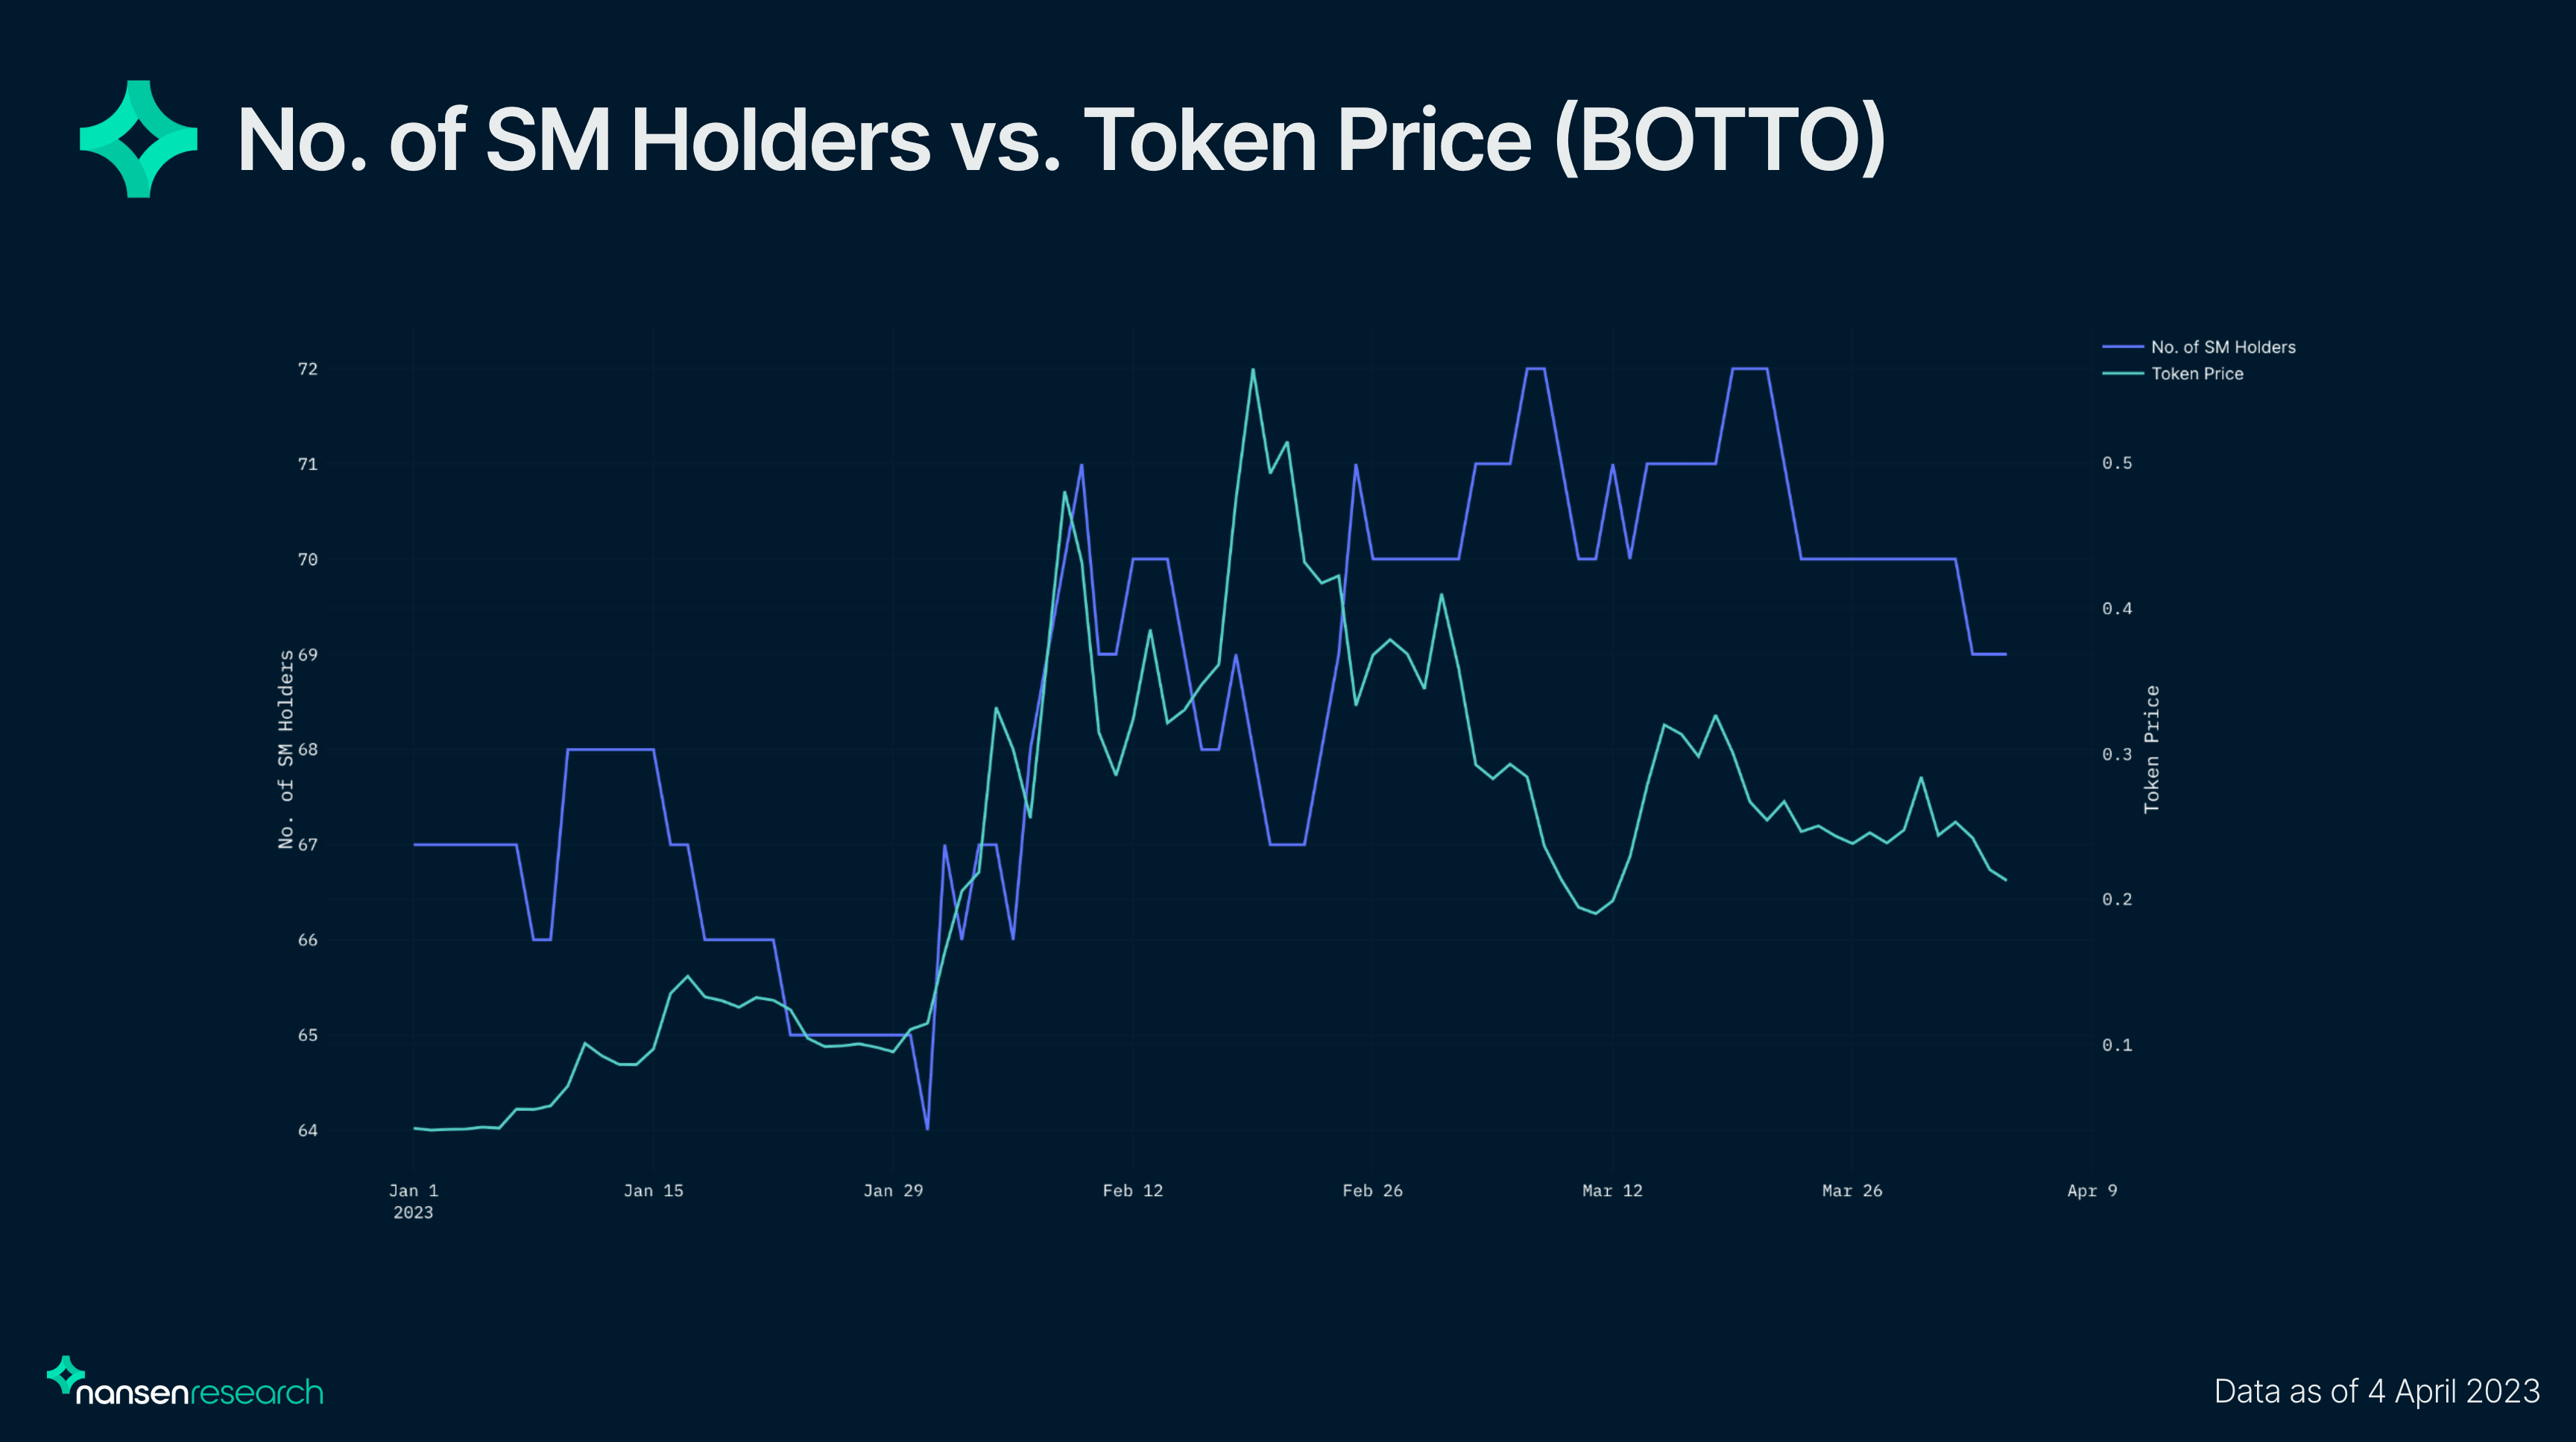
BOTTO is an outlier in terms of price movement since the start of the year. Looking at the number of Smart Money holders for BOTTO, the first significant increase in Smart Money holders came from the week of January 29, as the token experienced a 3x increase in price from January 29 to February 4. The highest percentage increase in Smart Money holders happened after that which happened alongside the increase in token price to $0.48. As the token went to a 3 month ATH of $0.56, Smart Money holders looked to de-risk as the number of holders decreased.
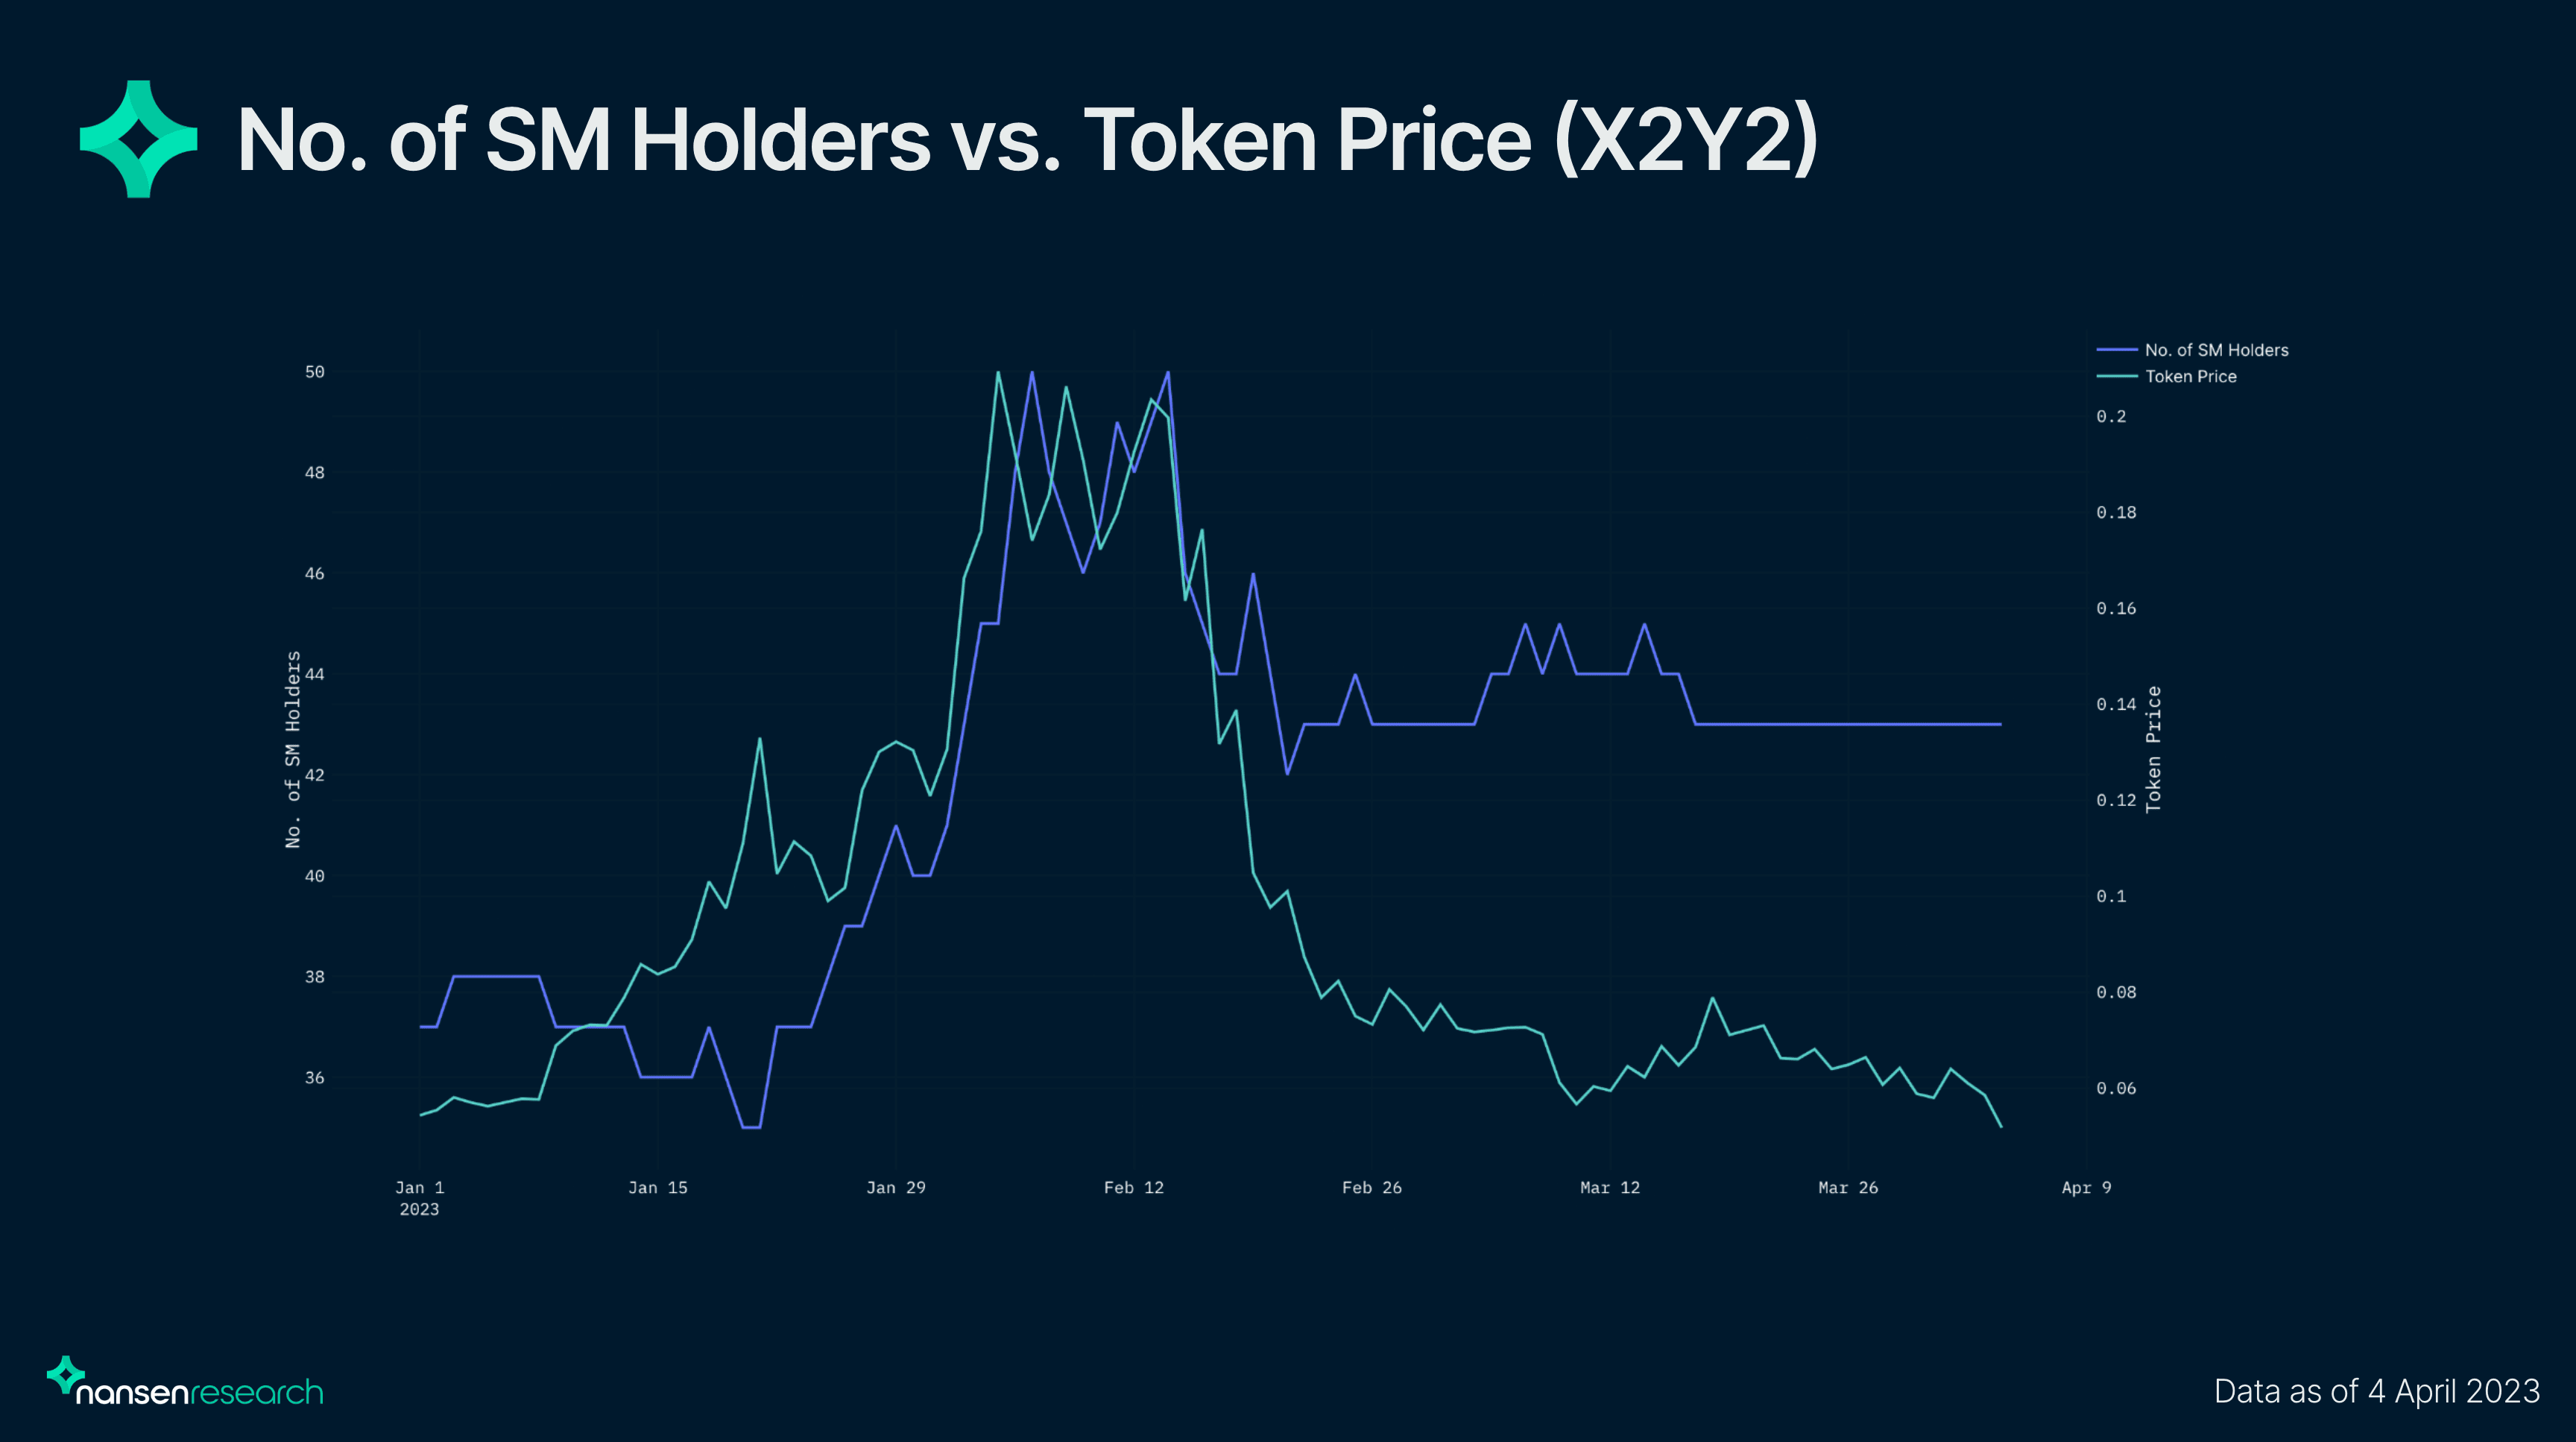
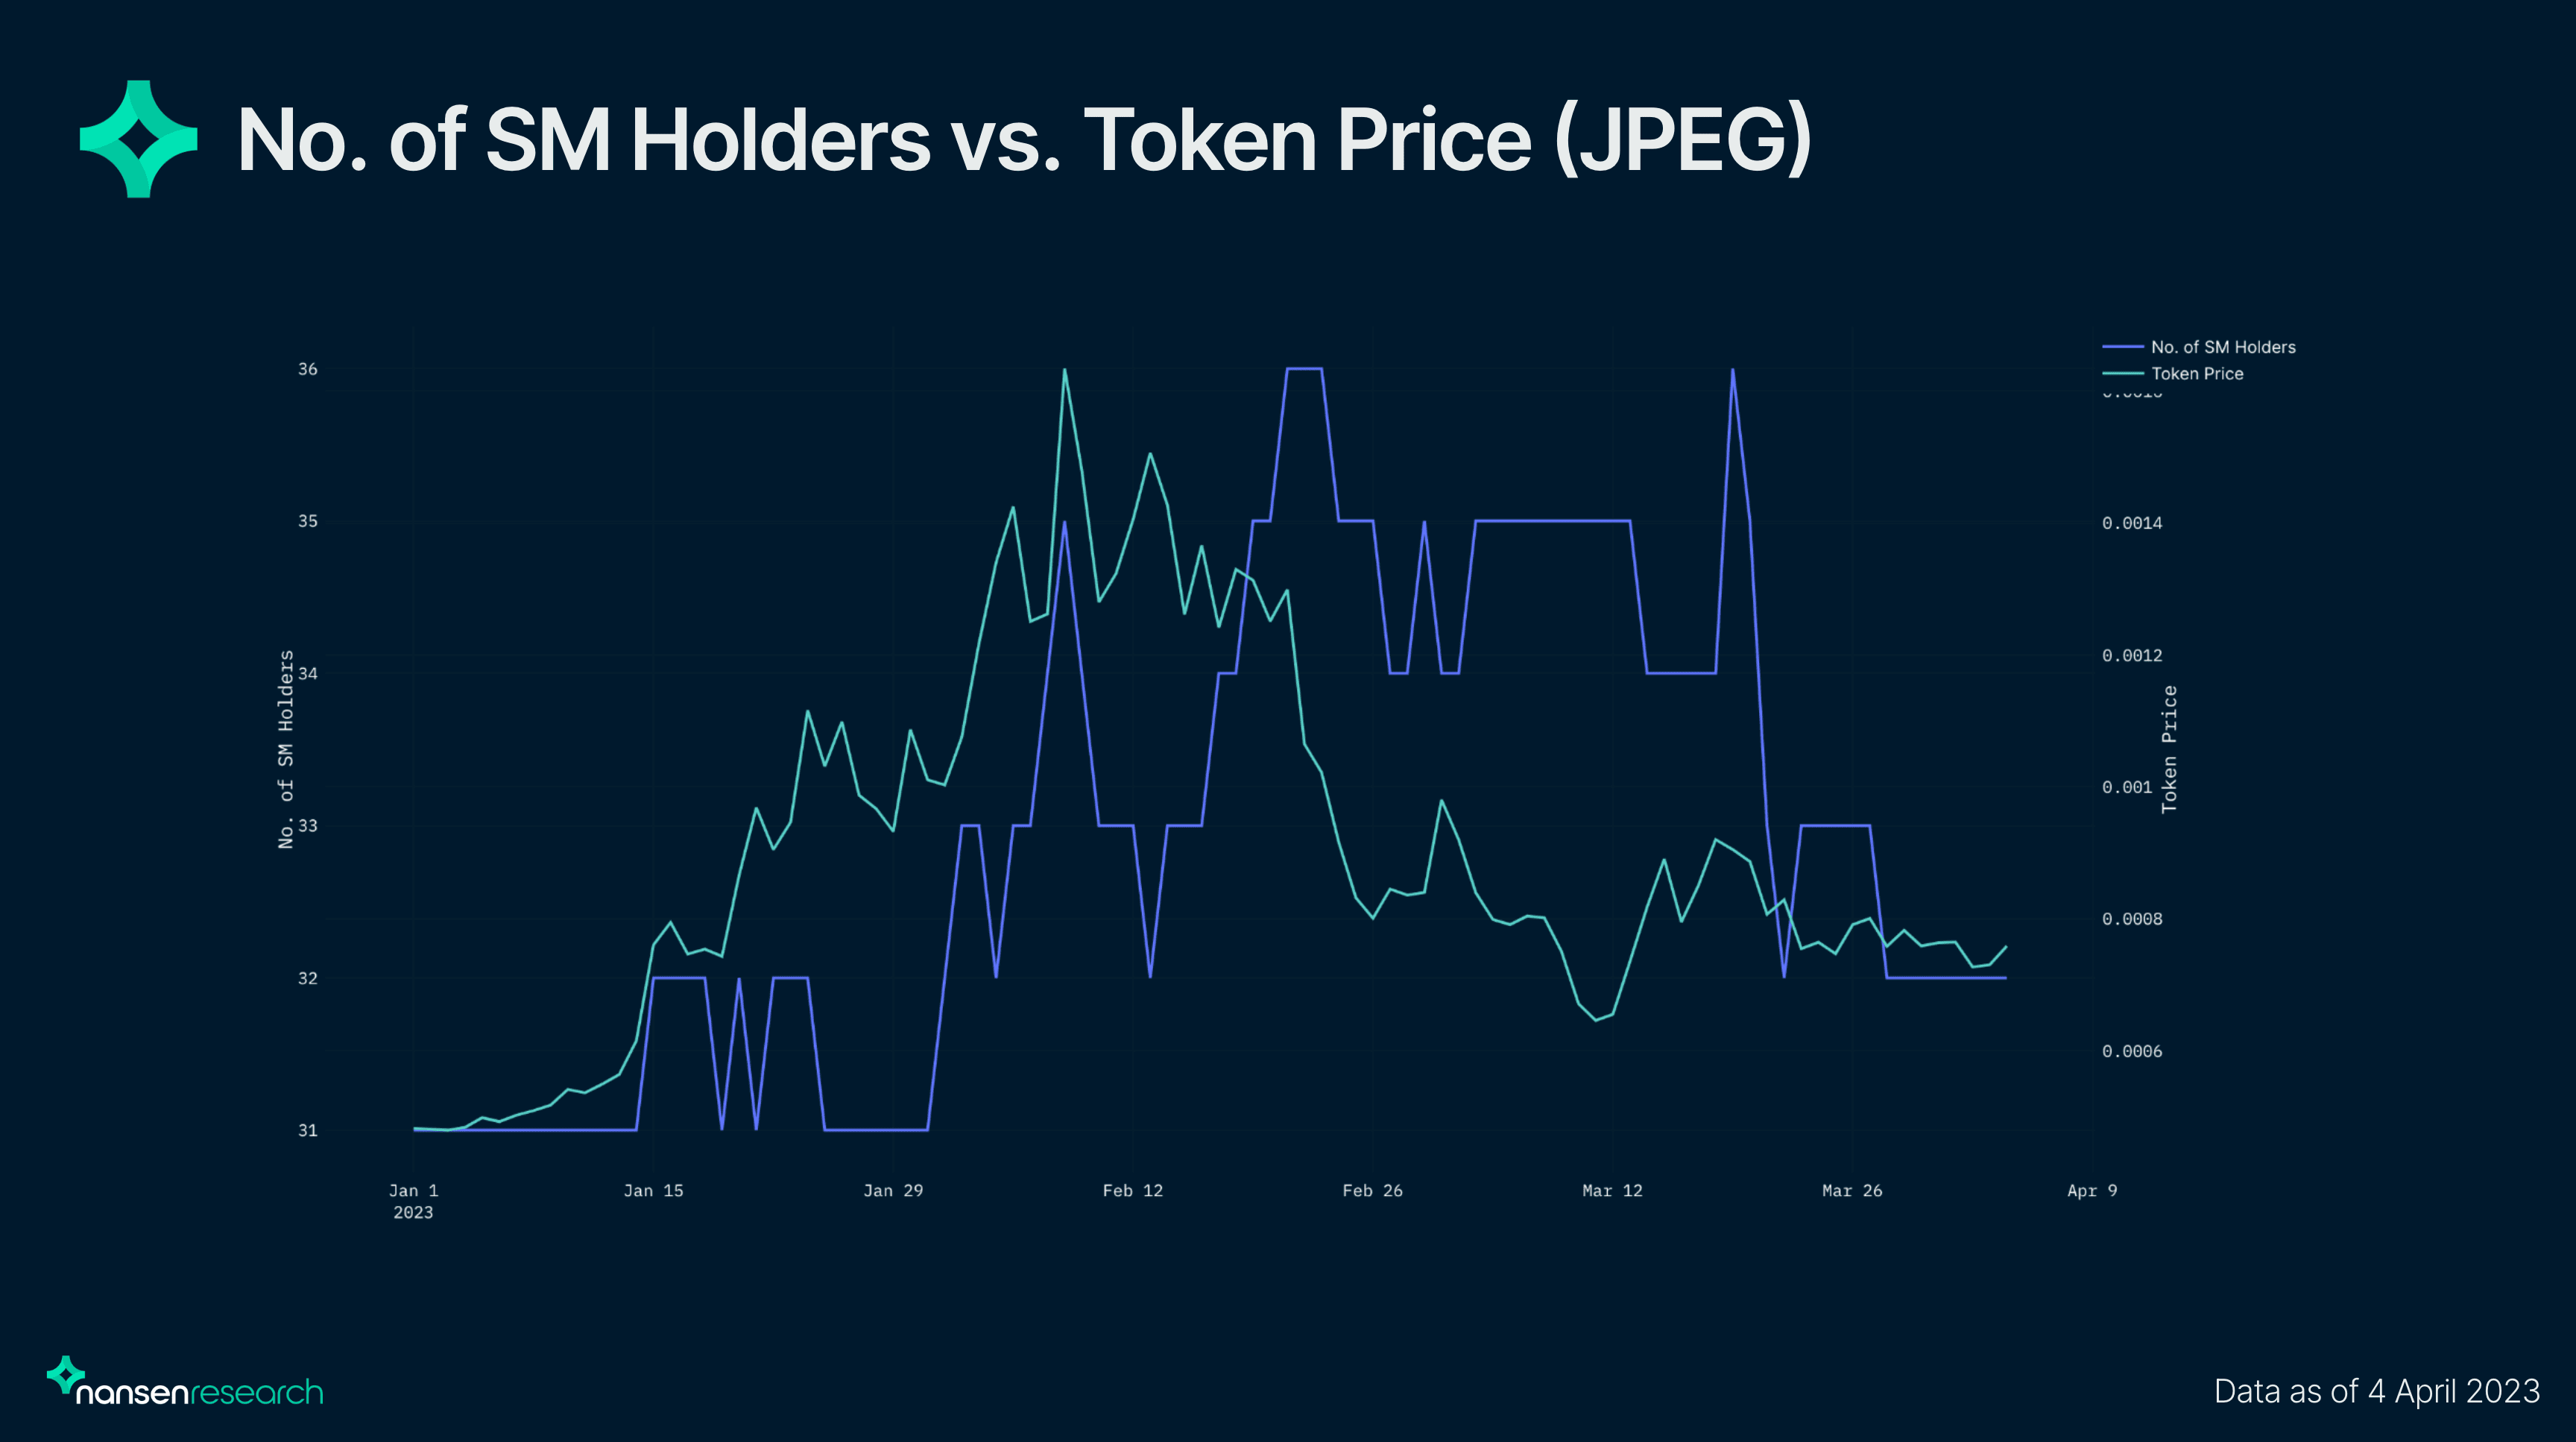
For X2Y2 and JPEG, changes in the number of Smart Money holders week on week were mostly in line with price changes probably because they were part of the NFT narrative during the period of Blur’s airdrop. Interestingly, the inflow/outflow value per Smart Money holder for JPEG is significantly higher than X2Y2 even though JPEG has a lower average number of Smart Money holders. This means that Smart Money movement will have a greater impact on the price of JPEG when there is movement from these holders. While Smart Money was able to identify the NFT narrative, subsequent movements after the Blur airdrop did not seem to be very profitable for Smart Money.
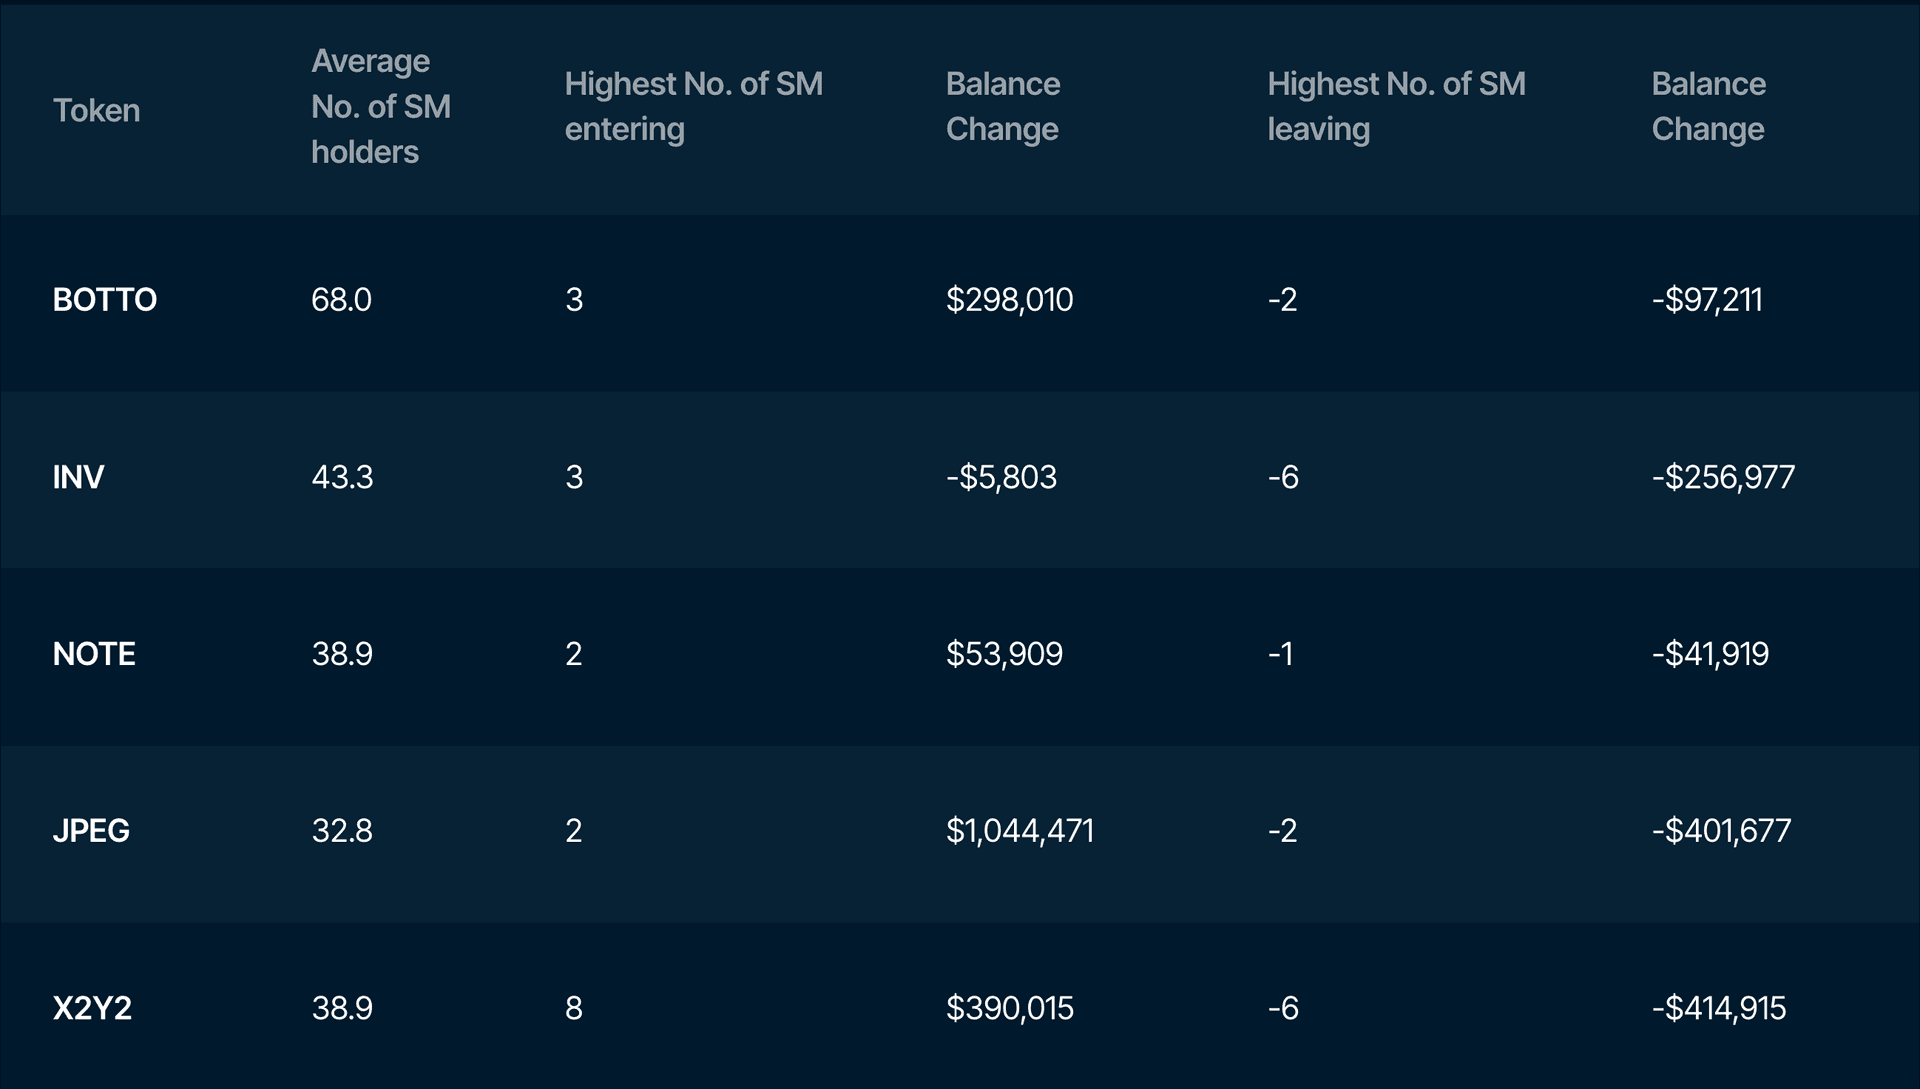
For small-cap tokens, the tokens were generally unprofitable in the next week when following in Smart Money’s footsteps. This could be attributed to the fact small-caps are more volatile and Smart Money holders are holding these tokens for a shorter period of time. This could explain the negative balance change for INV even though the number of Smart Money holders was increasing. Shortening the timeframe for price changes for these tokens to 4 days, results show that these tokens became profitable then with the exception of NOTE. Inflow values for the tokens are quite varied - whereby the average inflow value per holder ranged between $26k to $522k. NOTE had the lowest inflow value per holder at $26k and saw a price decrease of 2.9% even with the 4 days timeframe. X2Y2 which had an inflow value per holder of ~$48k, had a price increase of 2.7%. While BOTTO and JPEG both saw price increases, BOTTO saw a greater price increase of 60.8% as compared to JPEG price increase of 21.7% after 4 days, despite JPEG having 5x the inflow value per holder as compared to JPEG. Therefore, when looking at movements for small-cap tokens, inflow value should be of a larger value to signify Smart Money’s conviction in these tokens.
Overall, small-cap tokens would be more sensitive to any kind of movement from big holders, and movements from Smart Money mirror that, as holding time for these tokens are shorter than for mid cap tokens.
Summing up the results from all three categories of tokens, looking at the increase in Smart Money holders for mid and small-cap tokens could be indicative of potential positive performance. A caveat would be that tokens with a low number of Smart Money holders would not be sufficiently representative of Smart Money behavior. It would also be important to look at inflow value to determine Smart Money’s conviction in a certain token as smaller values may just be an investment that can be written off for them. Narrative-driven tokens are more unpredictable as they are traded on sentiments and hence, it is hard to determine benchmarks for these tokens.
Conclusion
Overall, Smart Money has proven to be largely profitable on tokens, but the profitability of following in their footsteps depends on a variety of factors. While the number of Smart Money holders and large inflows can be an indicator of Smart Money conviction in a token, there are a variety of factors that would affect the performances of tokens. Instances of black swan events such as the Euler exploit would render these indicators ineffective. Different tokens would also have different factors such as - the percentage allocation of Smart Money in that token, intrinsic value of holding the token or whether it is a narrative-driven token, which would likely affect the performance as well.