Introduction
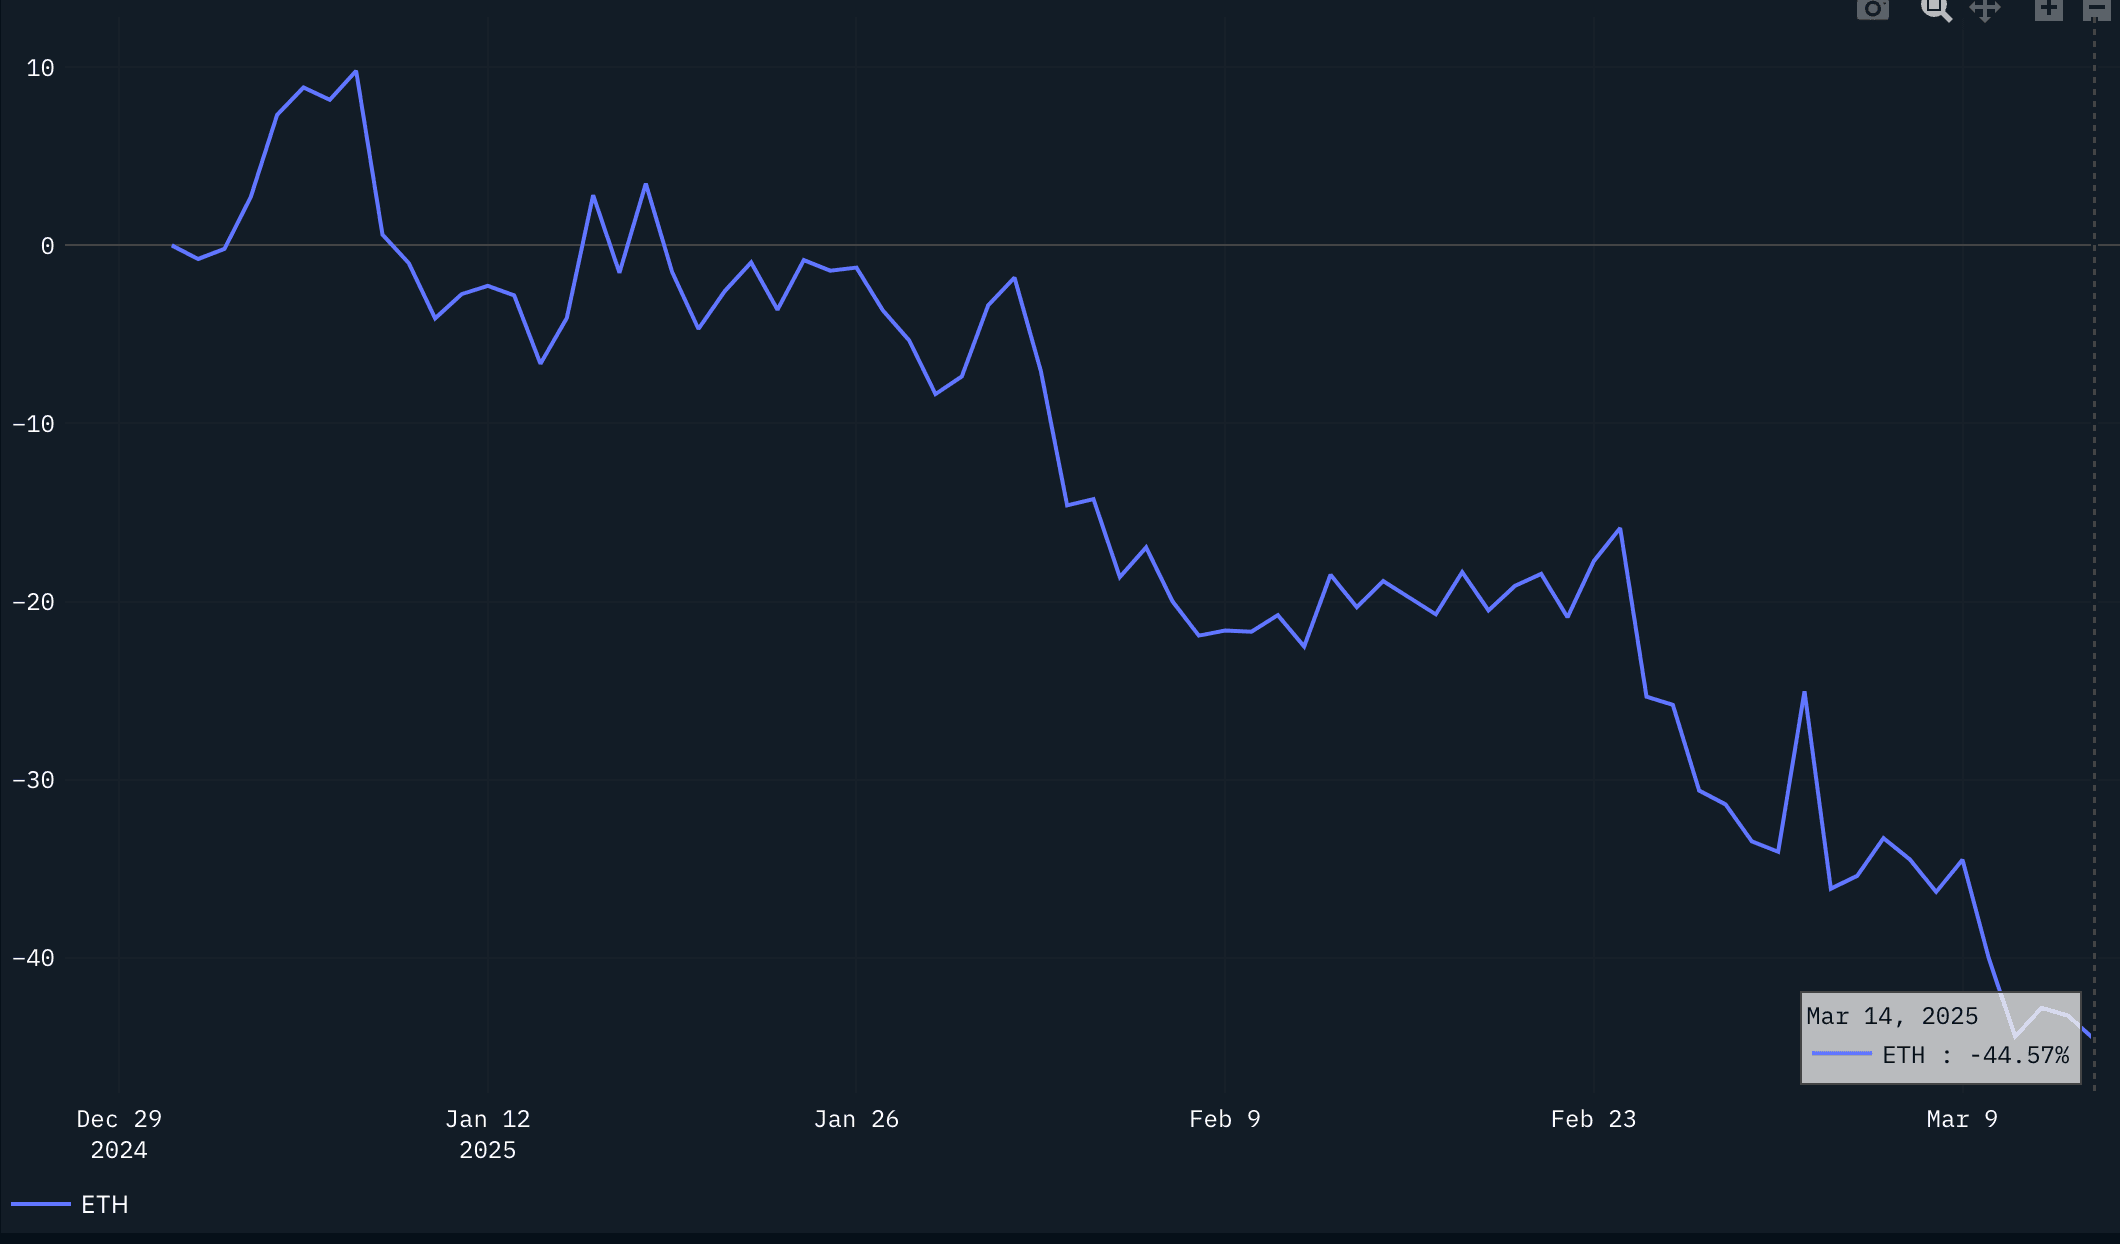
The start of 2025 has been a volatile year for crypto as a whole, with Ethereum seeing large drops in activity and most notably, down over 44% YTD and trading around $1,900 at the time of writing.
YTD Price Action
Median Gas Consumption
As for activity measured by daily median gas consumption on mainnet, gas is sitting around 1.12 GWEI, down nearly 50x from just a year ago when ETH was trading at $4,007 on March 14th 2024.
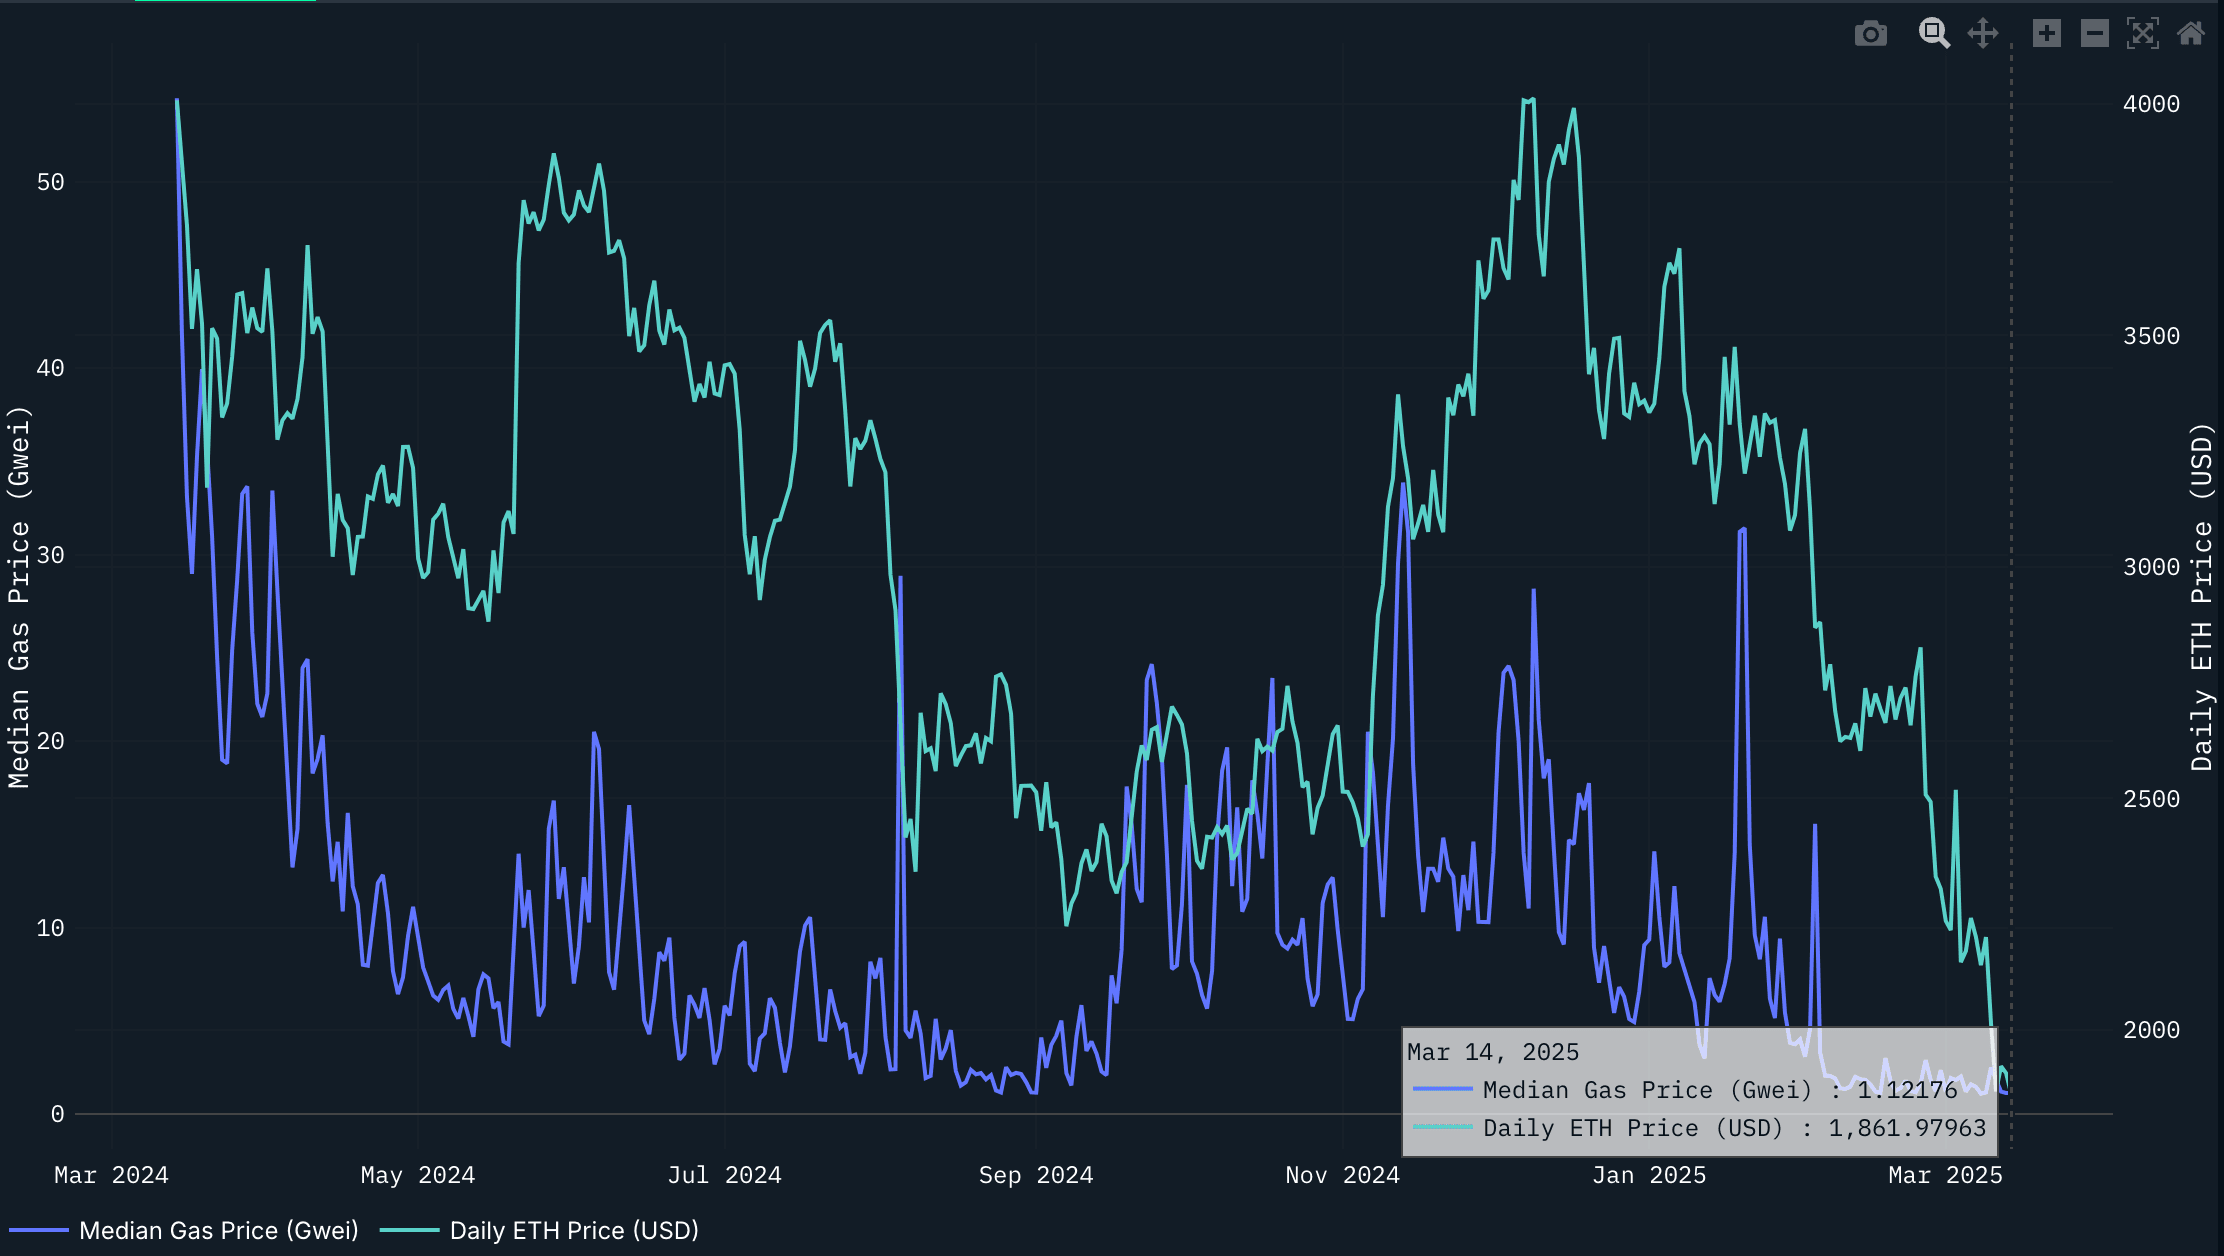
Despite the second rally of ETH price into 2024 year end, activity on mainnet as measured by gas consumption never fully recovered. This is downstream of a few things but much of the activity has shifted to Solana and L2s over 2024. The issue is this doesn't directly translate to ETH being market beta for a majority of speculation/onchain activity and is not always the base asset that traders need to trade said altcoins- rather, other liquid alts on these chains become the default proxy such as SOL, VIRTUAL, AERO and others. In prior cycles, ETH was the beneficiary of altcoin trading due to the constant bid and narrative around ETH.
With ETH experiencing a 50% decline over the past calendar year, who are the marginal new buyers of ETH? Even further, what is a fair value for ETH with it sitting at $232b market cap?
- If for sound money, BTC wins.
- If for performance, SOL wins.
- If for DA and restaking, TIA and Babylon are large contenders in the making.
It feels like Jon Charb's report on the Ethereum’s Northstar for ETH is very pressing, despite ETH maybe being oversold. The gist of the report is that Ethereum is competing on all fronts and risks being a “jack of all trades but master of none” when compared with BTC, SOL and TIA. Now with rollups settling to BTC (i.e Starkware and Celestia-powered rollups on BTC) it even puts its lead of rollups into question given the potential liquidity and network effects around untapped BTC and interoperability/cheaper valuations for some of the above verticals.
Despite the bearish sentiment around ETH based on price action, activity and a lack of a north star, are things as bad as they seem for ETH the asset? Let’s take a look from the lens of ETH whales to see if they’re bullish or bearish ETH based on their ETH holdings over time.
Methodology
Before diving into their holdings and address counts, let us very briefly explain how we can better surface the signal into real whales using Nansen data to:
- Filter out all bridges, exchanges, contracts, protocols, DAOs etc.
- Filter out high frequency traders and market makers
- We keep public figures, influencers, funds/VCs and other entities that belong to individuals or funds
- We aggregate ETH balances for addresses in a cross-chain manner, starting with mainnet and the two highest TVL rollups - Arbitrum and Base.
Finally, we are left with a much more accurate look at ETH whales and less noise. Let’s dive in.
ETH Balances Over Time
Grouping addresses by their ETH balances, we are left with the following cohorts:
- 1 - 10 ETH
- 10 - 100 ETH
- 100 - 1k ETH
- 1k - 10k ETH
- 10k - 100k ETH
- 100k+ ETH
We will look at the power users and whales respectively to see their ETH balance trends. Despite this being a good insight into onchain holdings, there are limitations. To name a few, this doesn't capture staked balances via ETH2, liquid staking token (LST) balances or balances on CEXs that may belong to said addresses.
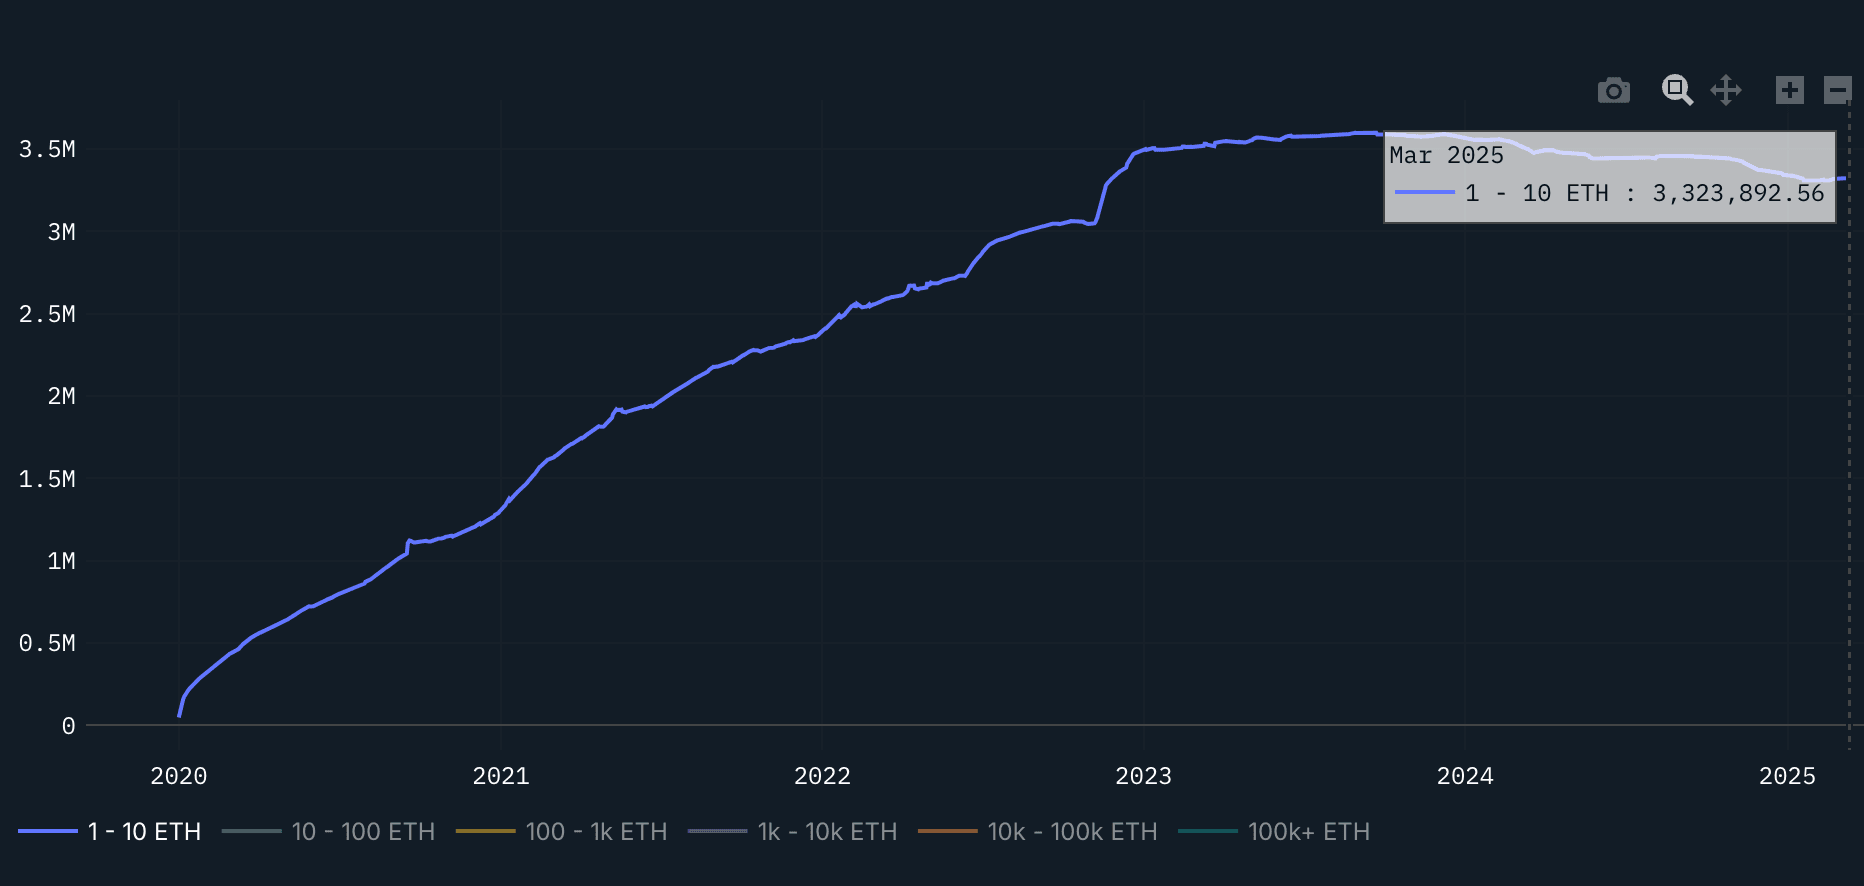
Retail (1-10 ETH)
We call our lowest denomination of ETH holders ‘retail’ and forgo holders with less than 1 ETH.
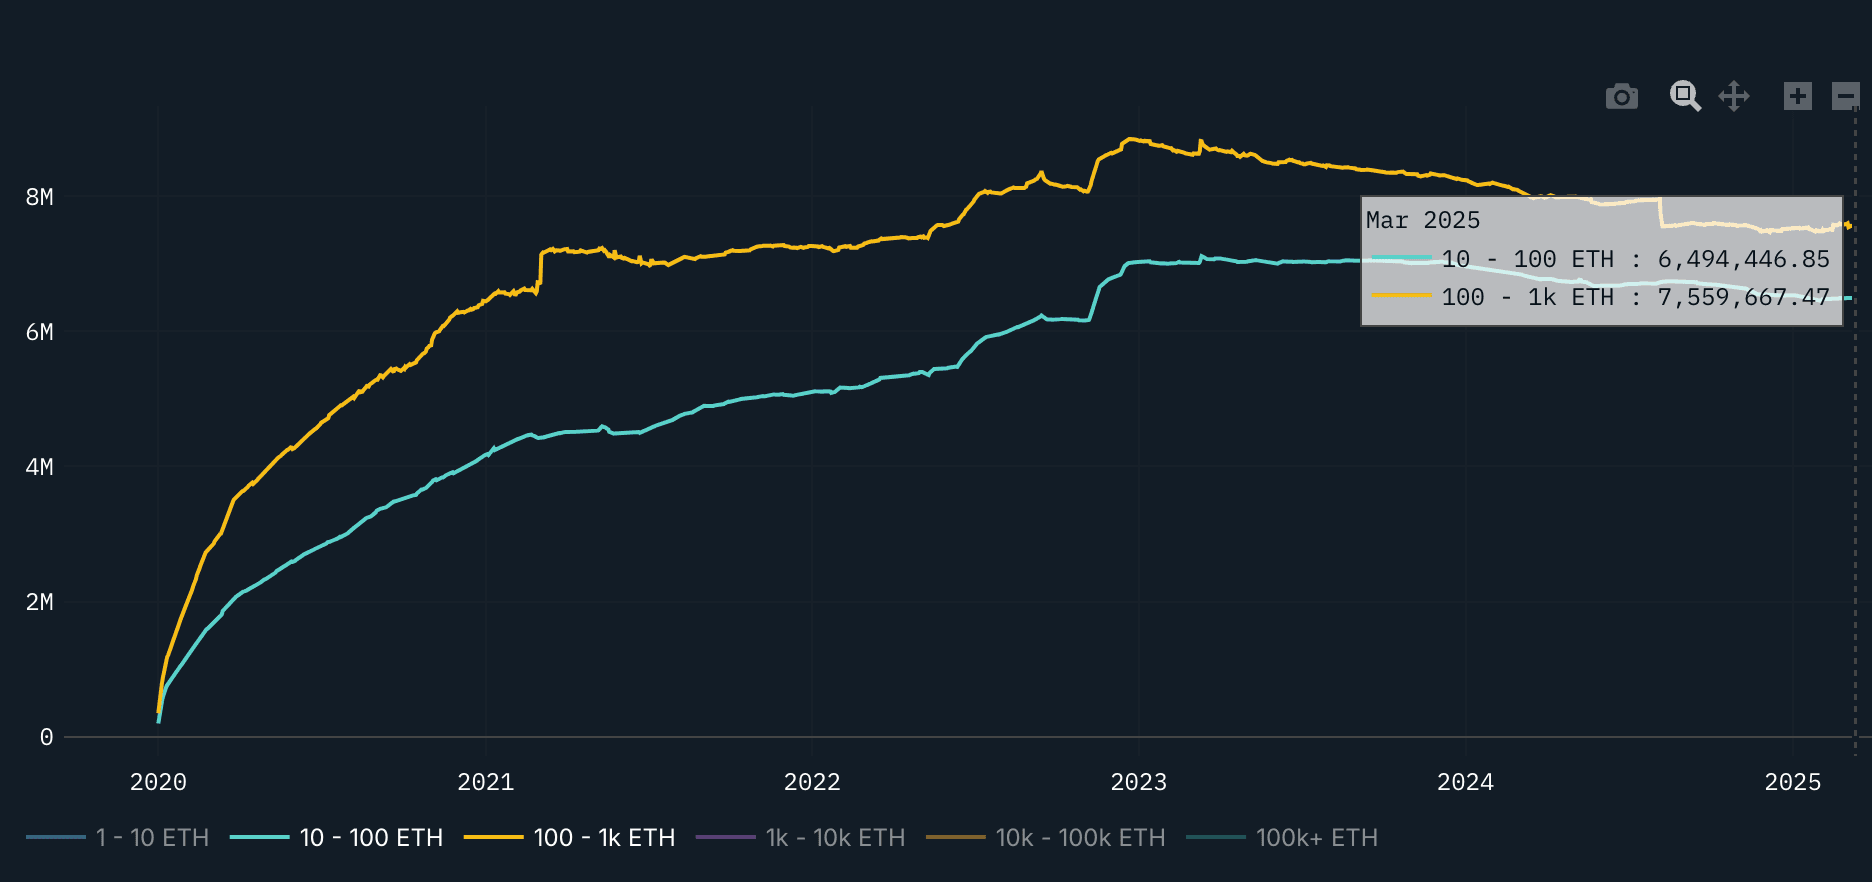
Power Users (10-1k ETH)
Addresses within this range hold anywhere between multiple thousands to a few millions dollars worth of ETH.
Whales
Only looking at addresses with 1k or more ETH (~$20m at the time of writing)
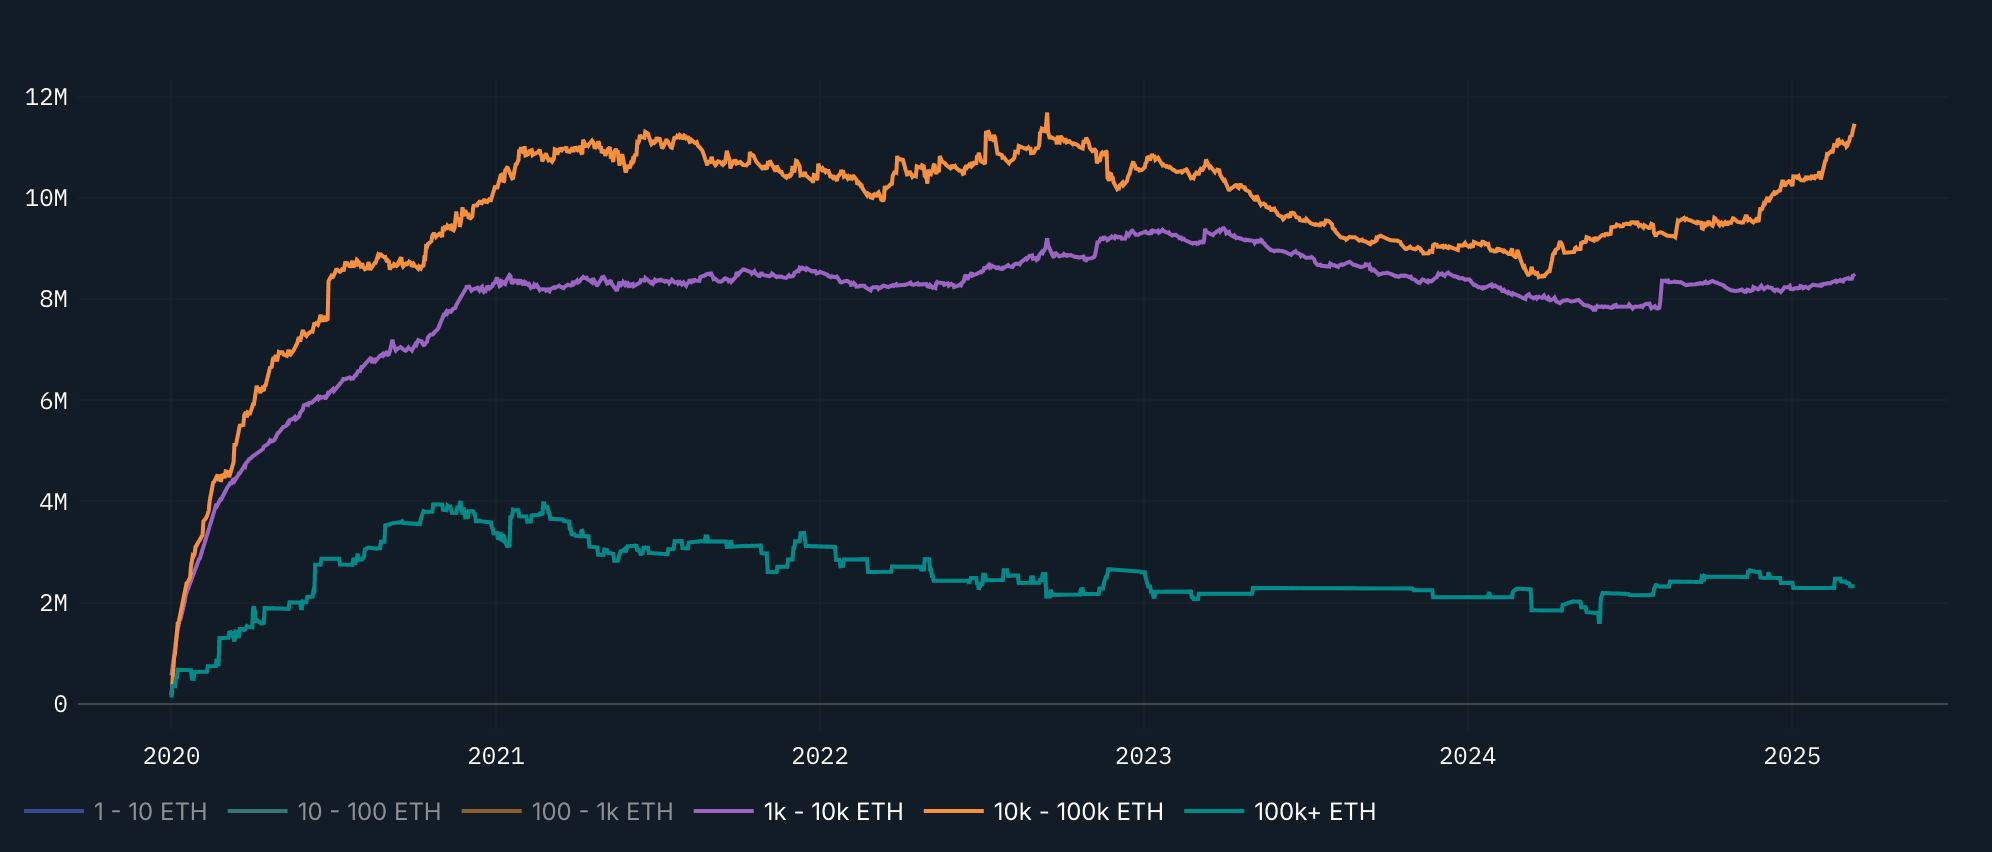
It is very clear that the retail and power user segments balances started their consistent downward/sideways trend starting in 2023 onward. As for the whales, we most notably see a large uptick in the 10k-100k cohort at the end of 2024 into 2025. The 10k-100k segment saw over a 12% growth in 2025 alone on their total ETH balances whereas the 1k-10k segment saw a 3% increase in their holdings YTD.
To contextualize the balances over time, we will also show the address counts across each segment to get a better sense of distribution of ETH.
Addresses Over Time
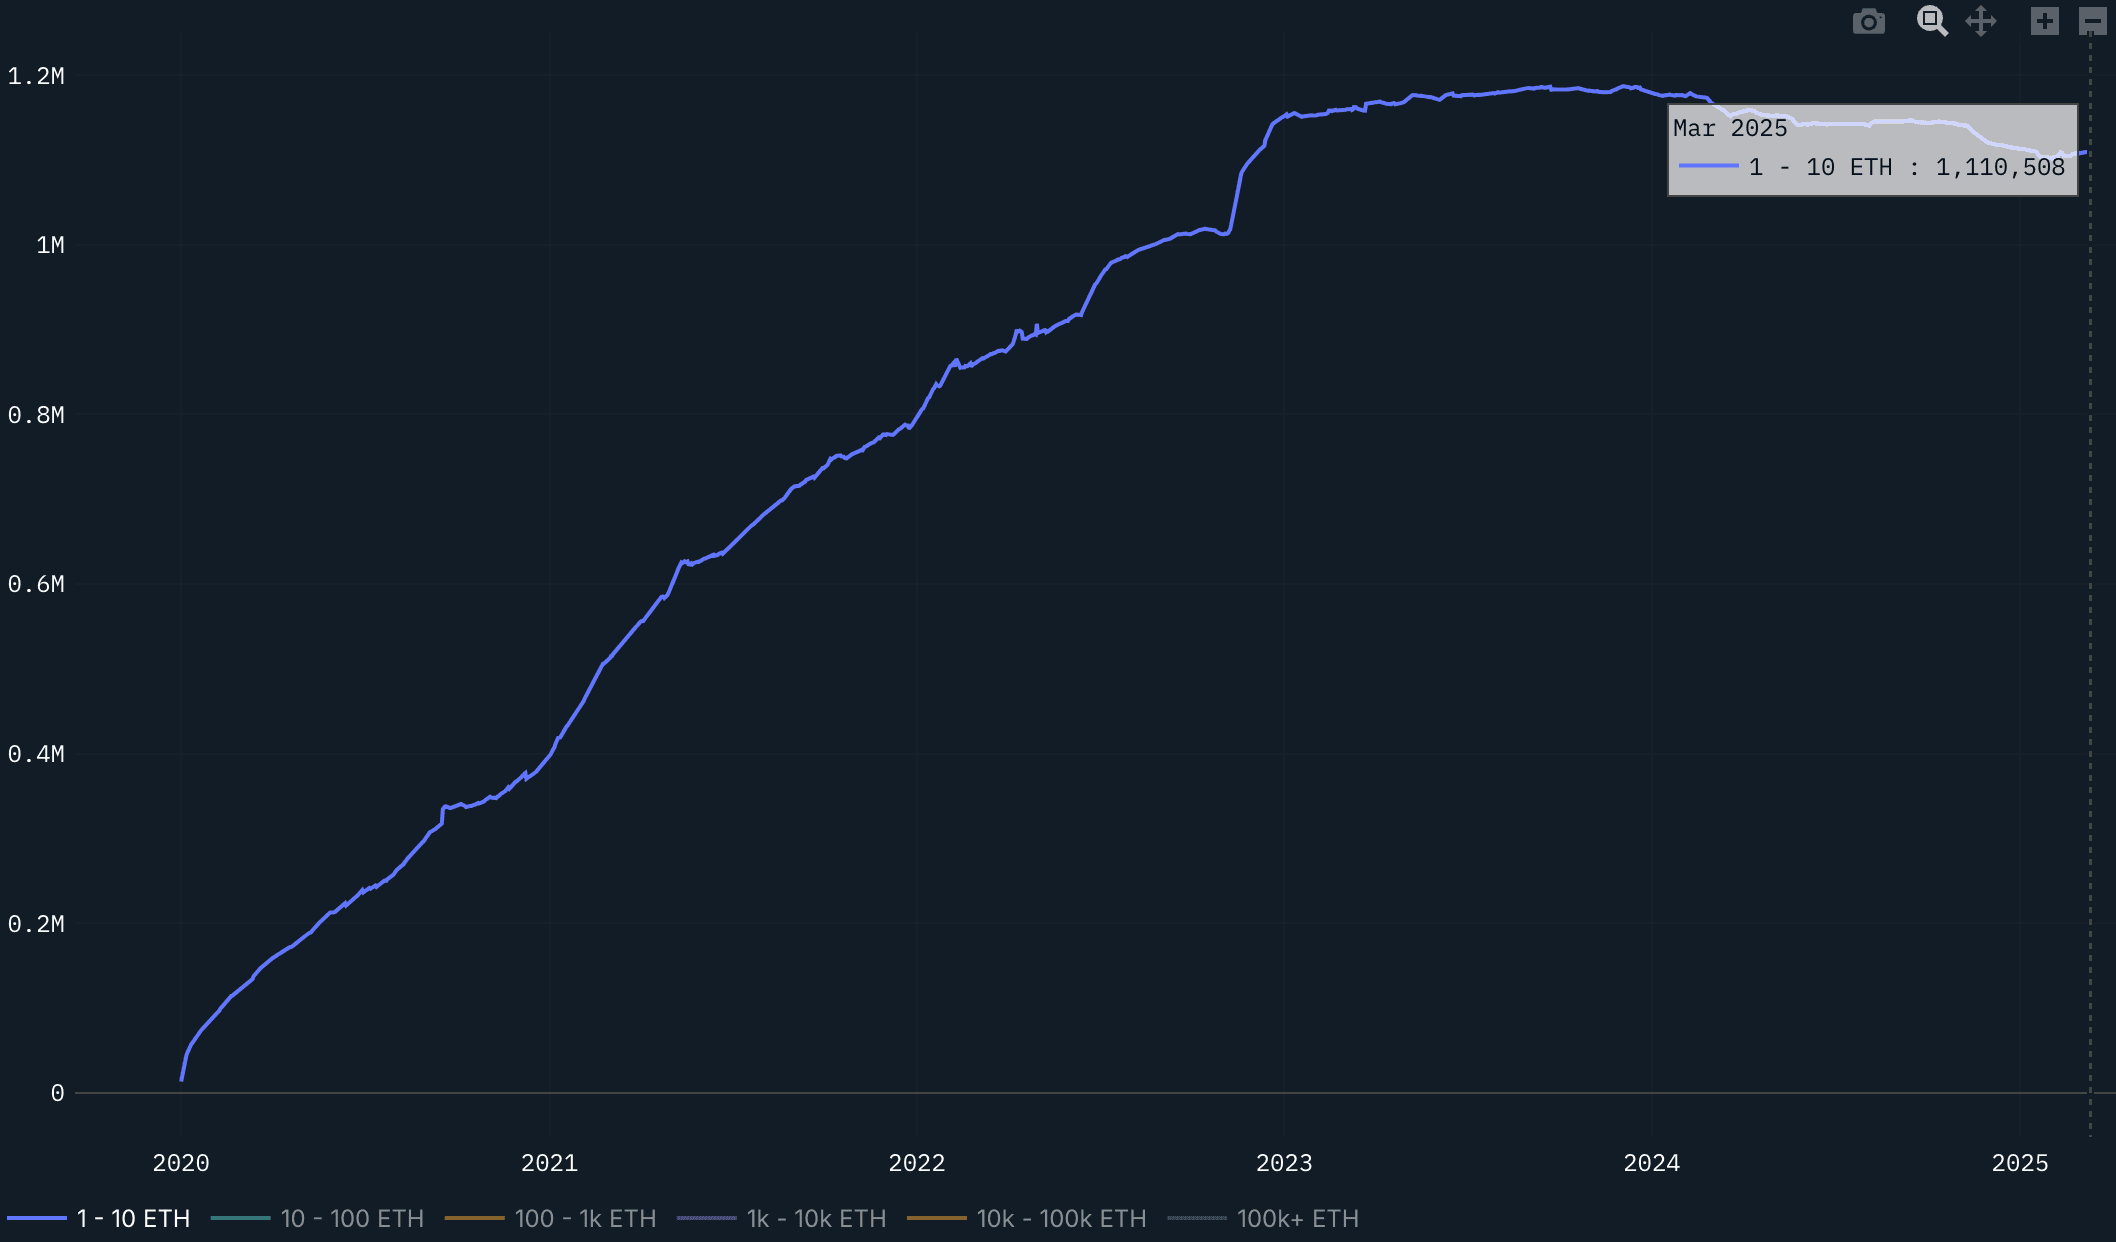
Retail (1-10 ETH)
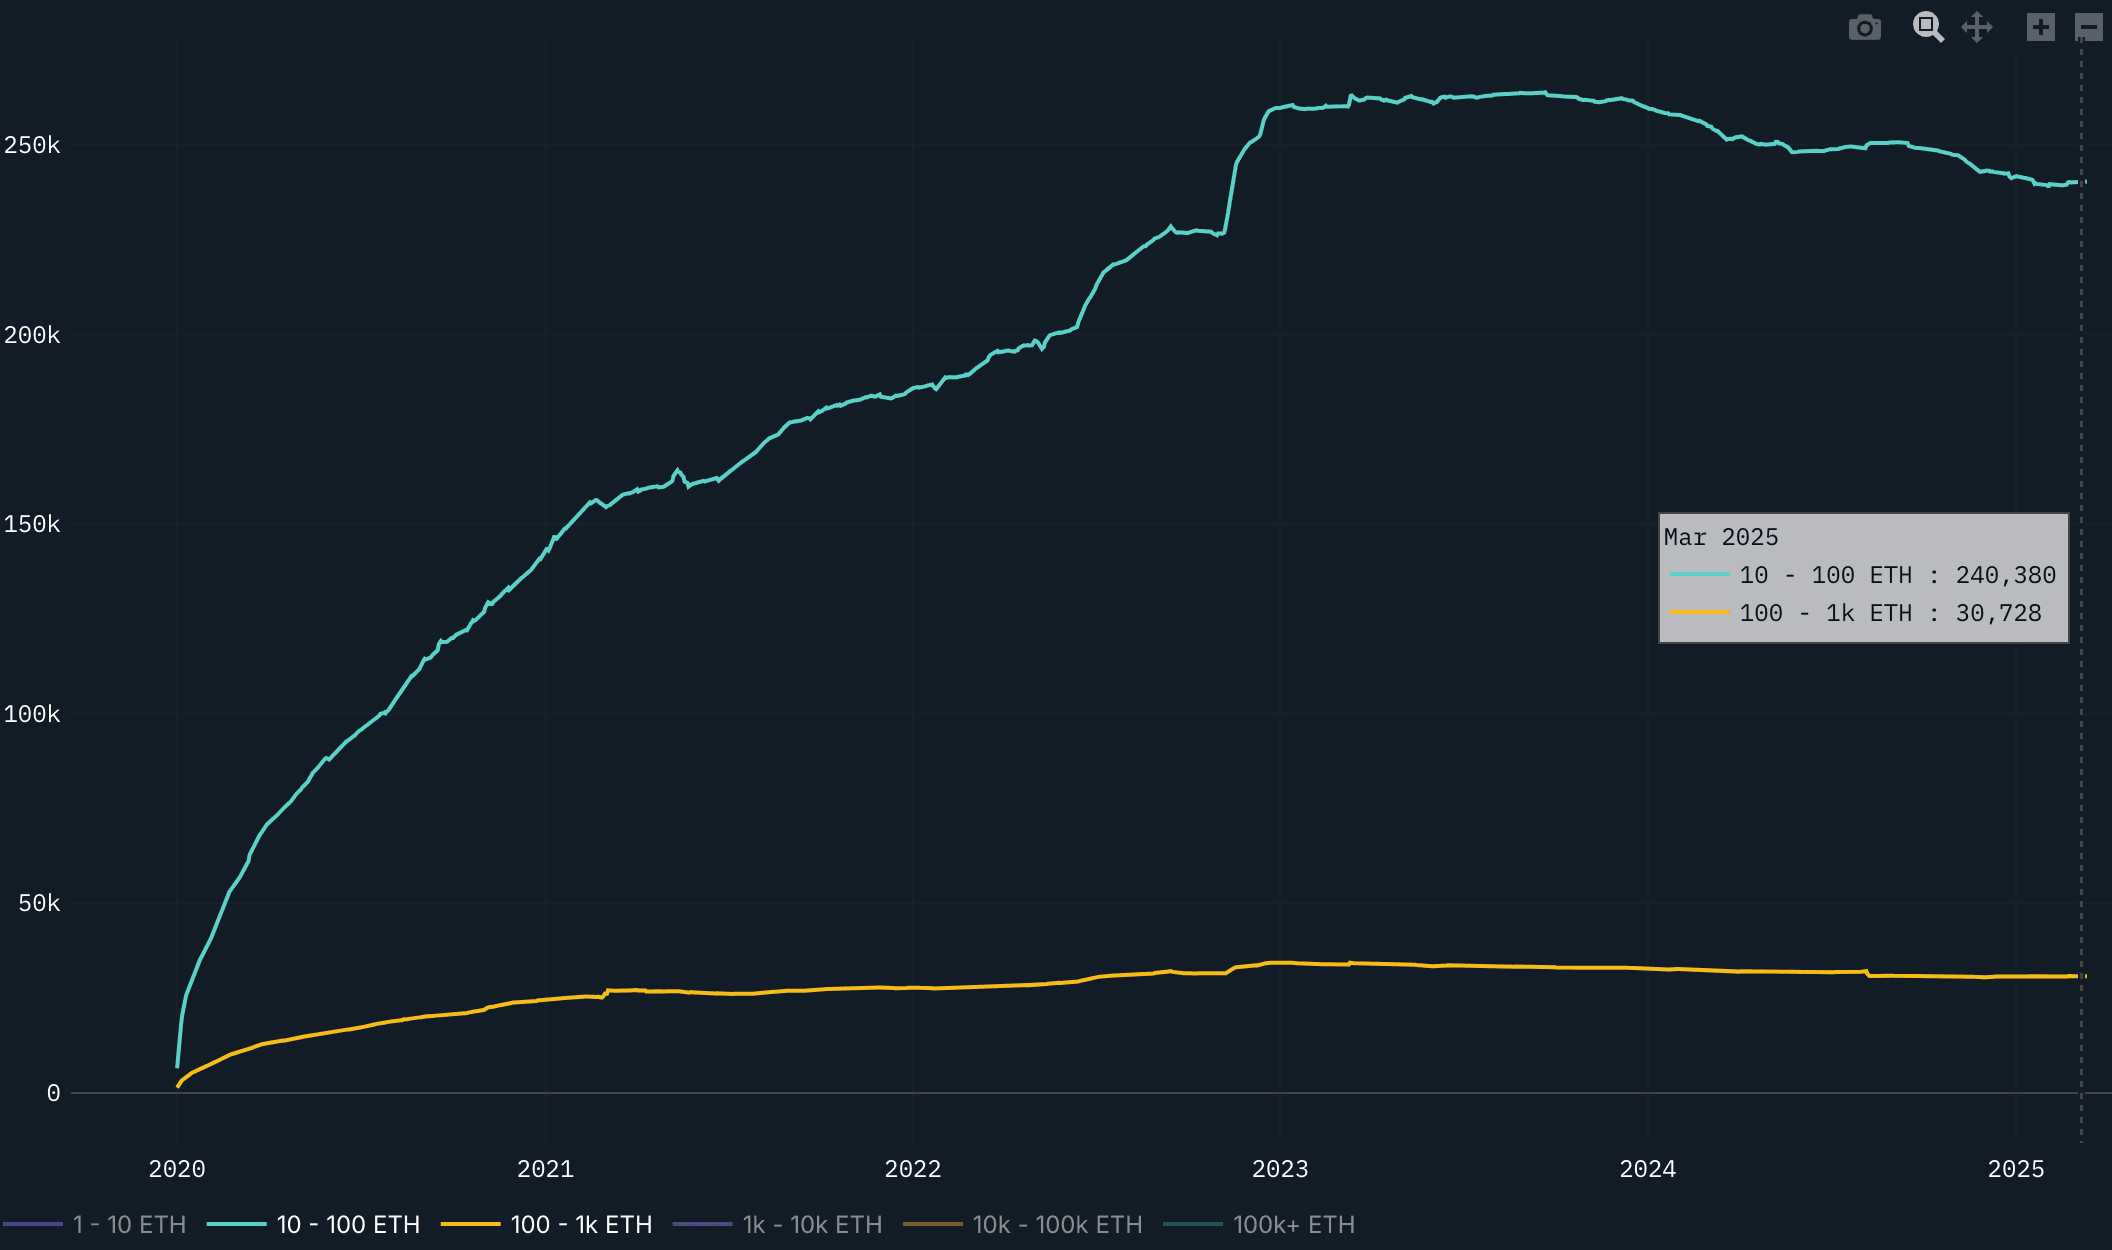
Power Users (10-1k ETH)
Whales
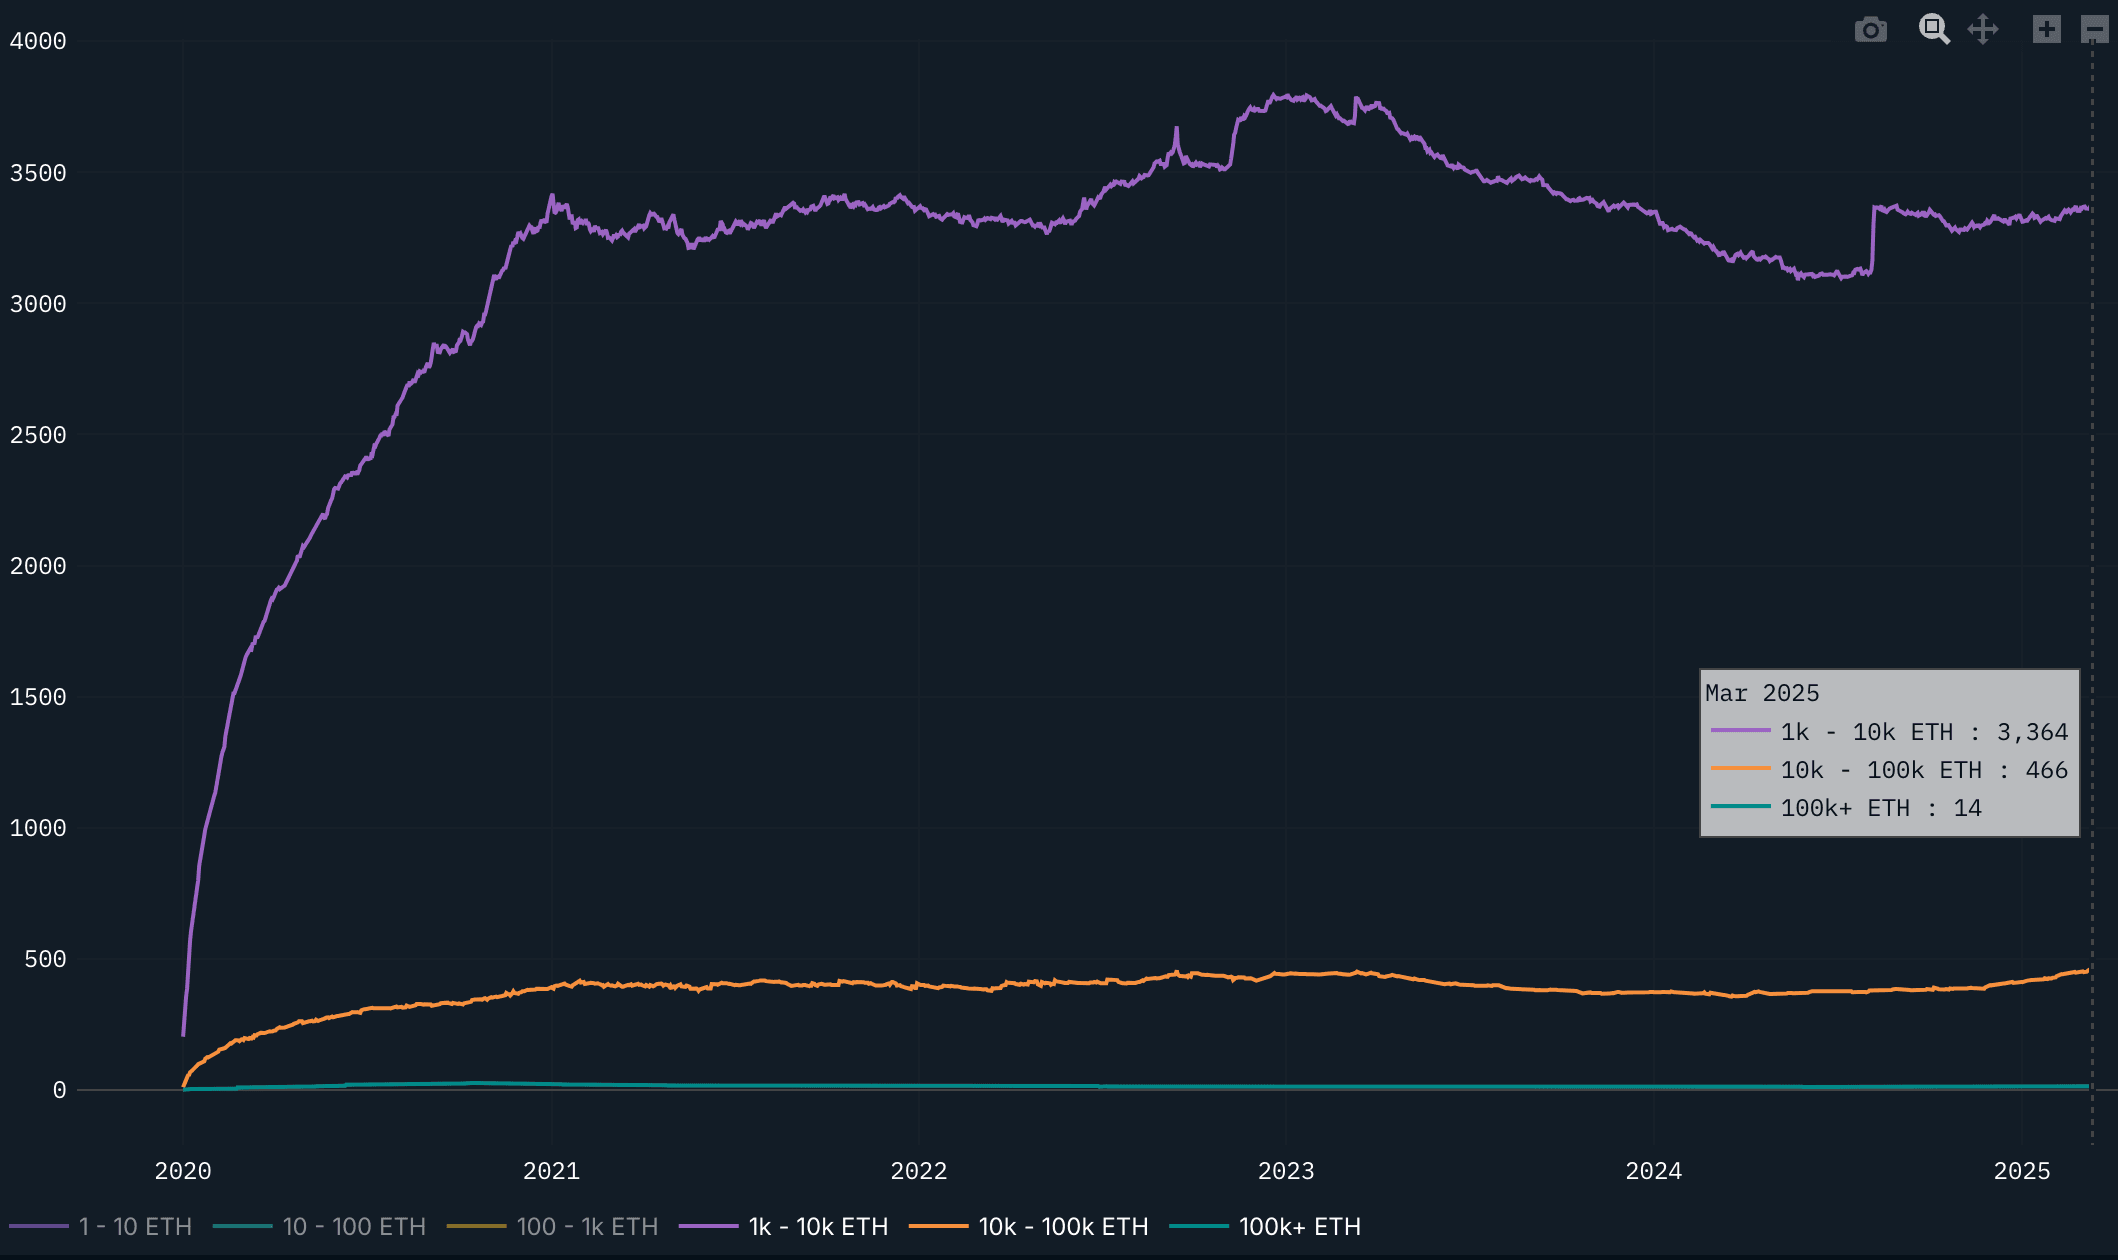
Most address counts are stagnant or declining since 2023, but we have seen an uptick in the whale cohorts. The 1k-10k ETH cohort grew 5.65% and the 10k-100k cohort grew by 28.73% since March 12th, 2024 - 1 calendar year prior to this report snapshot. The 100k+ cohort is very small and displays no noticeable trends to make note of.
Conclusion
Despite the downtrend in price action and the current absence of strong market activity and cohesive narratives surrounding ETH, there are bullish signs within the whale segment, showing decent accumulation as we enter the new year. While this segment has seen significant inflows throughout late 2024 and into 2025, metrics such as balances and address counts have shown a gradual decline across other segments.
Despite being potentially oversold, ETH leaves much to be desired across many of the onchain metrics. To reverse the multi-year trend of ETH/BTC trading lower, significant changes would need to occur and we are skeptical that any catalyst can be reflected in the near-term price action. Currently, we maintain a cautiously bearish stance on ETH, considering the risk/reward compared to BTC and “cheaper” altcoins targeting specific niches. Given its severe underperformance on both the way up and the way down, it is hard to argue why ETH against BTC and other out-performers of this cycle.