Yesterday we finally got the first tentative break we've been waiting for over a month now.
Last week we wrote that "the biggest obstacle for crypto remains the USD - where we think the market is heavily positioned to the short side and vulnerable to a short squeeze, which could take BTC/ETH and Gold lower in response."
During US hours yesterday, a sharp USD short squeeze took place - which came in the face of bad US data this week and sharply lower US Treasury yields across the curve.
Typically when such a counter-intuitive move happens, it often signals a change in the near-term trend, and even more so when positioning is heavily one-sided and lacking conviction.
However, we say 'tentative' because the major key level for the USD's trend change confirmation has not broken yet, and recent Fridays have produced some irrational flow-driven reversals in macro markets.
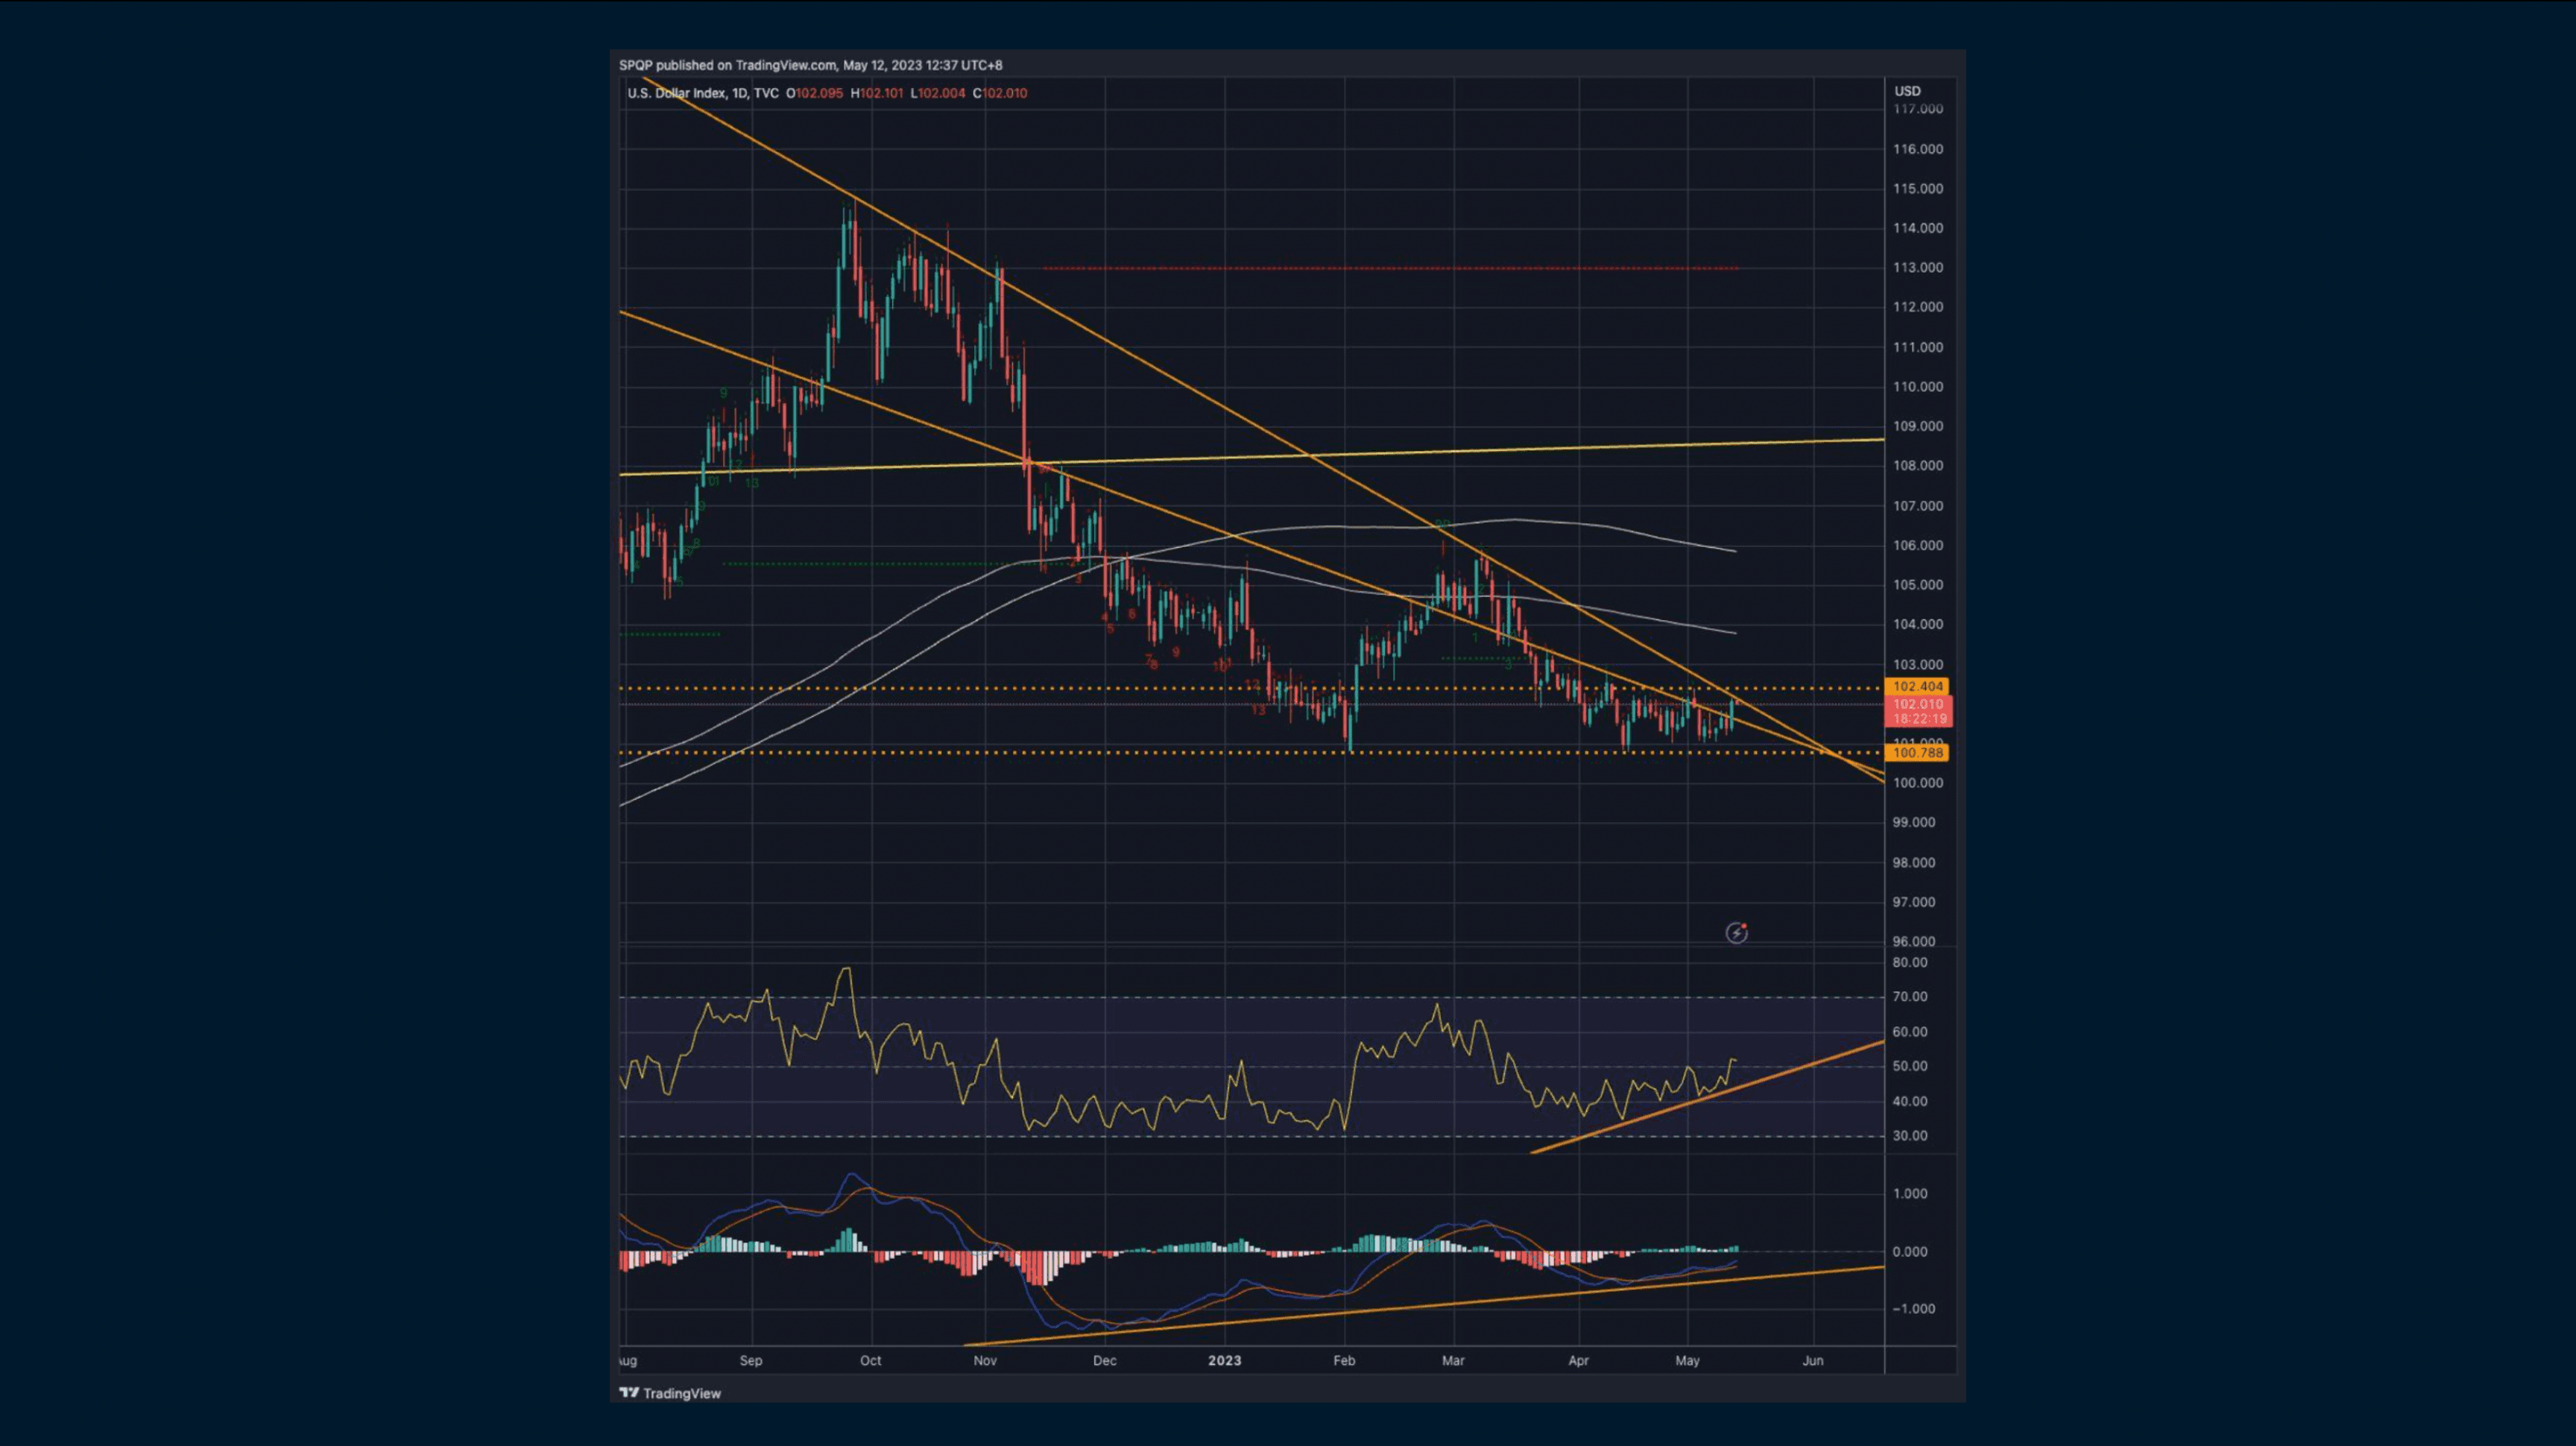
In DXY, we had a sharp breakout of the first falling wedge yesterday, and are currently testing the second falling wedge here that has capped us since the October top. We continue to be biased towards a double bottom break of 102.5. The strong positive divergence in momentum indicators argues for such a reversal, but a break of this very key level is still needed to have us focused higher.
We see USD strength as the main reason capping BTC, which has led to the market's reflexivity blaming known bearish factors such as the large upcoming supply from the US government and Mt. Gox.
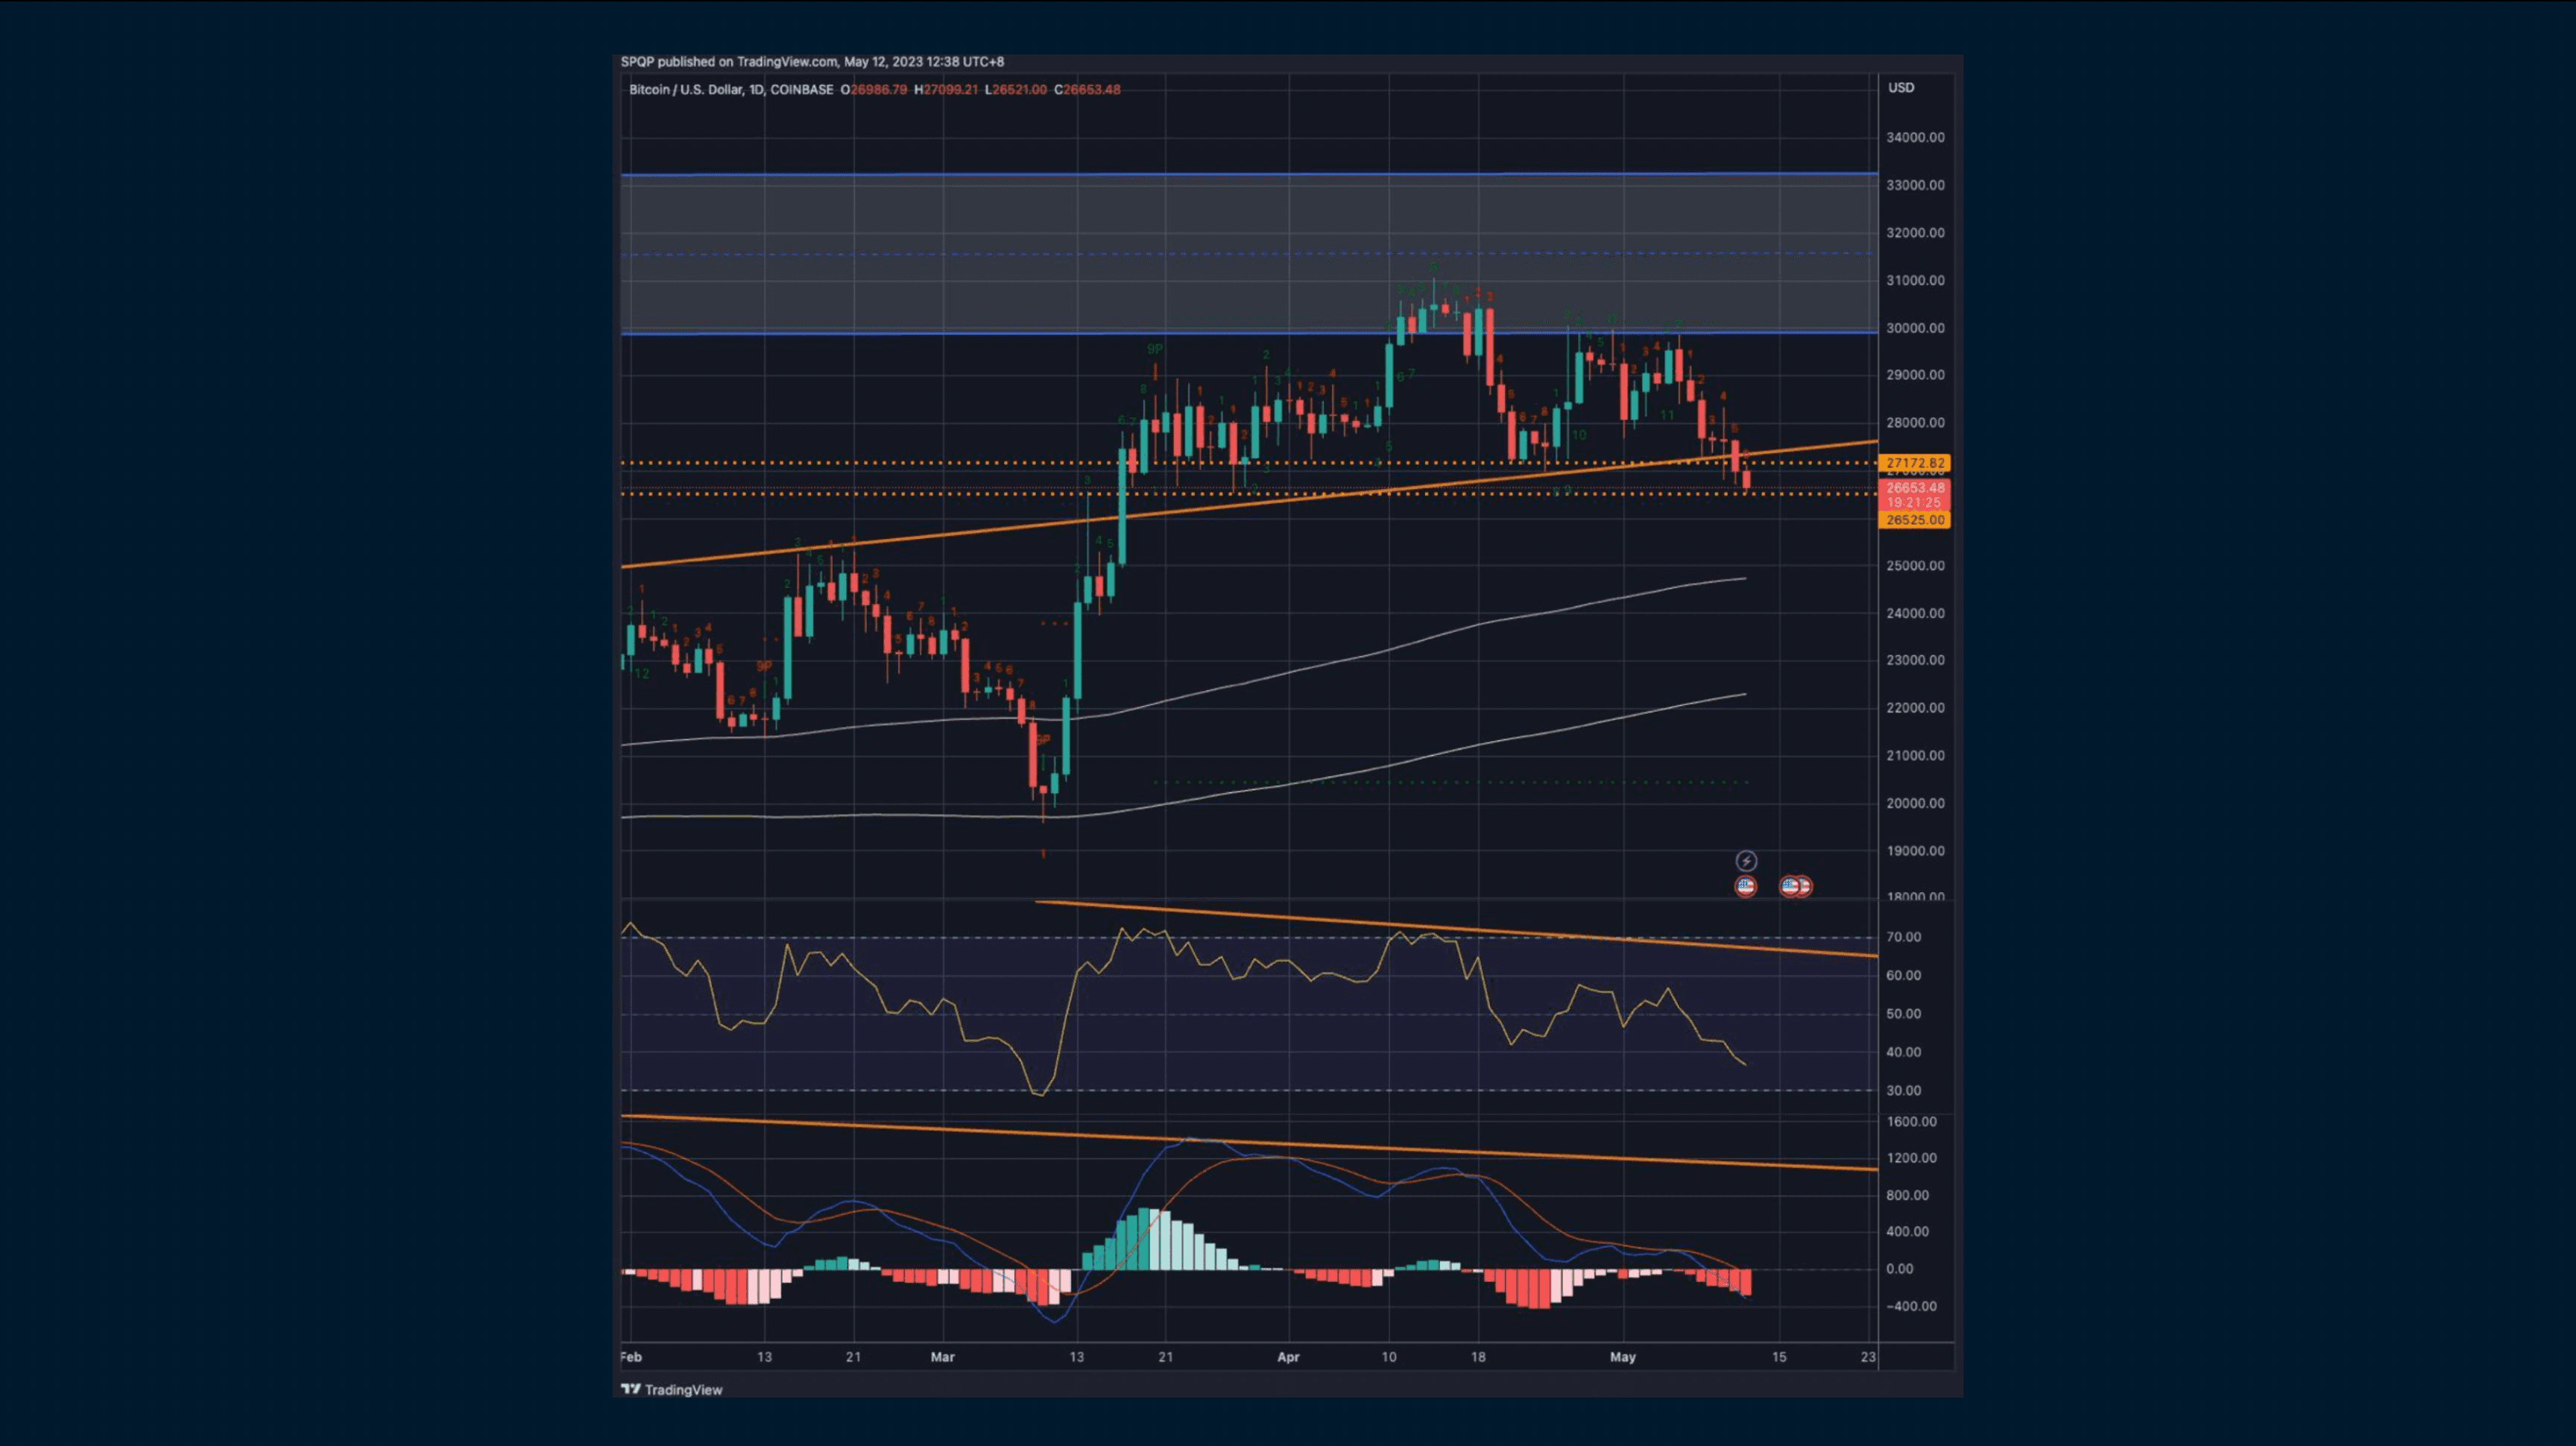
In BTC, this week's sell-off has taken us through the head and shoulders trendline, but where a close below 26.5k is still preventing a larger breakdown. BTC has a negative divergence on momentum indicators which is leading us to similarly be biased in the near-term towards a break lower, first to the 25k mark and then potentially to the 20-22k level. However we view this lower level of 20-22k as a high conviction medium-term buy zone, and a level where we have sold physically settled puts before.
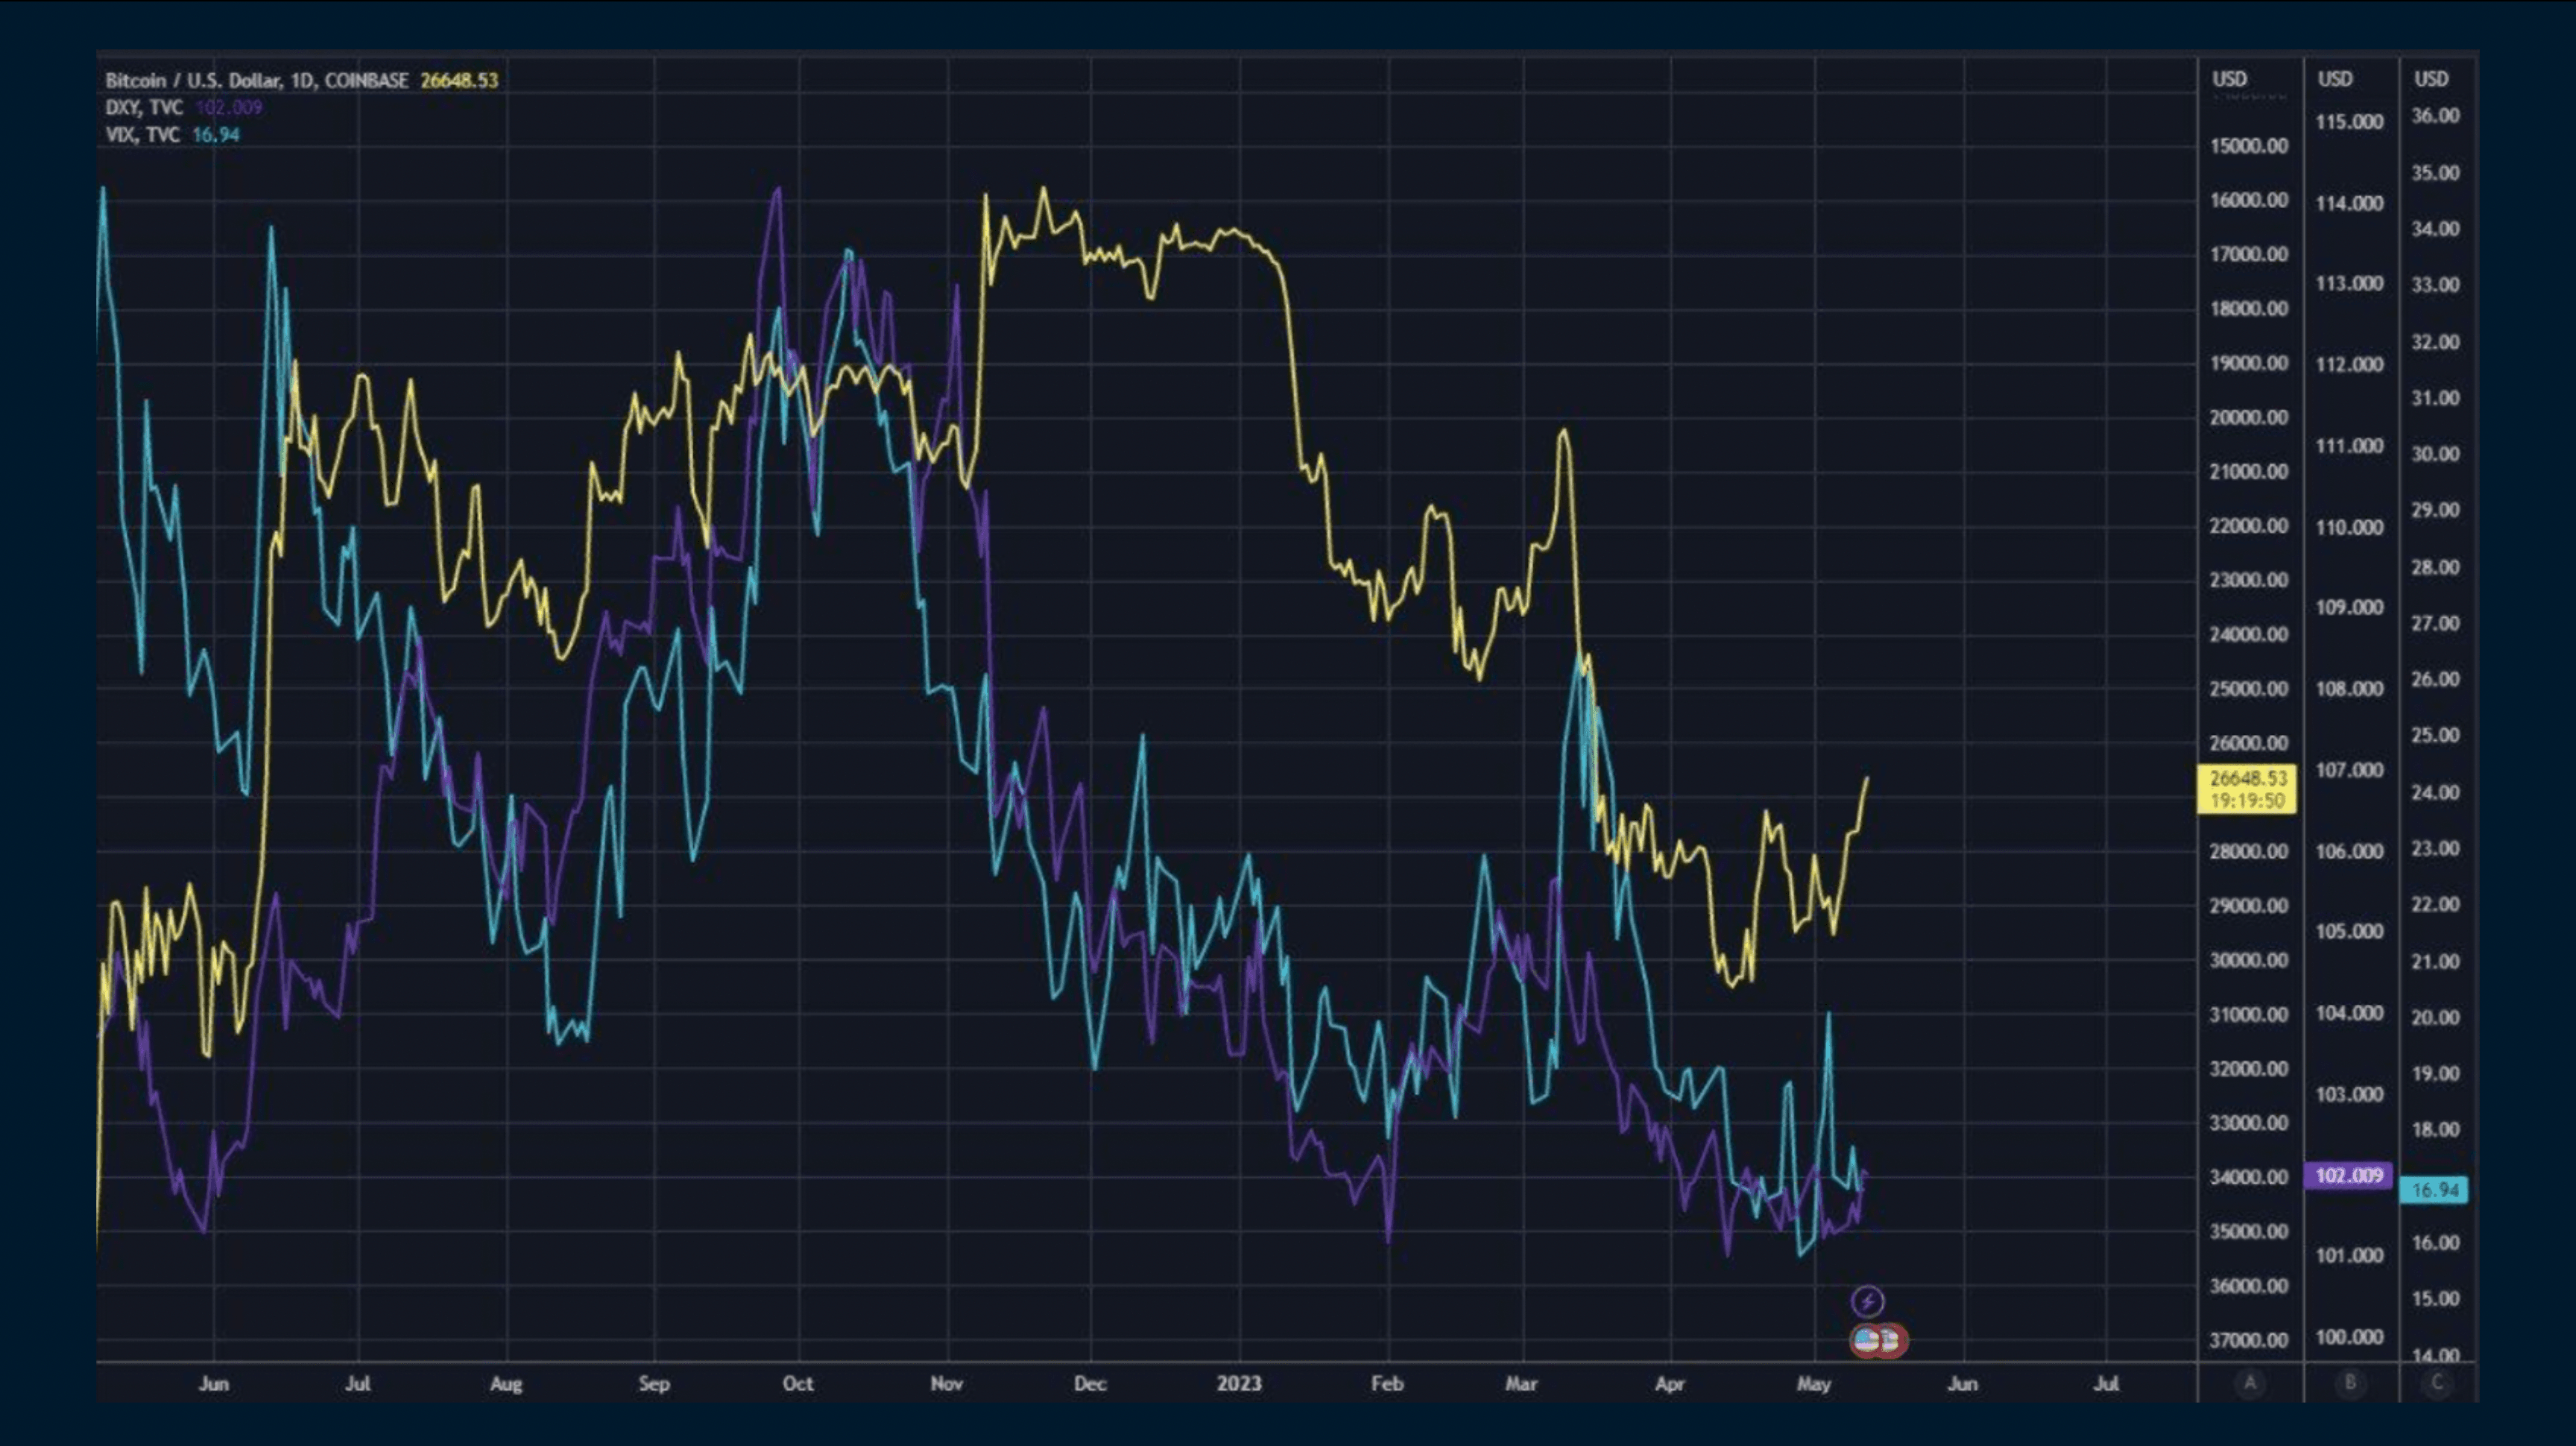
What we need for this near-term move lower to have legs to the downside however, is a sharp increase in volatility. Chart 3 shows VIX (blue) vs. USD (purple - inverted) vs. BTC (yellow - inverted), whereby an increase in volatility has driven strength in the USD and sapped risk assets such as BTC.
While the outcome of Washington's political drama is impossible to predict, we will be following the market's reflexive function - especially in relation to implied volatility across assets. This now holds the key for us in determining the next trend direction.