1. Markets
Risk assets ended November at the highs, having staged the most impressive recovery / short squeeze since the October lows. This 2 month gain of 16.89% in the S&P futures from October's low to the close last month is the biggest 2-month rally since the April/May 2020 Covid bottom!
More than anything, momentum has been driving this rally - on the back of the extremely high short base that we've been warning about since the August Crypto Circular: What the fork.
In fact momentum across the board has been so strong, that it has even been able to drag crypto (somewhat) back from the dead - with BTC up 12.75% from the 21 November lows, while ETH is up a whopping 21.6%! Albeit big numbers off a low base.
Fundamentally though, we have seen nothing to change the bear thesis yet, despite the positive price action seducing many commentators to quietly change their bearish stance.
However, here is where we now caution that the Santa rally has come early, and is finally reaching a turning point.
While many are saying that BTC and ETH are lagging equities and should play catch up, rather we see it as equities having overshot fundamentals and will soon be reeled back.
We say this because the 2 year yield - which has been a reliable indicator of the market's direction all year, is in fact moving in-line with BTC and ETH, while S&P and Nasdaq have rallied away. (Chart 1)
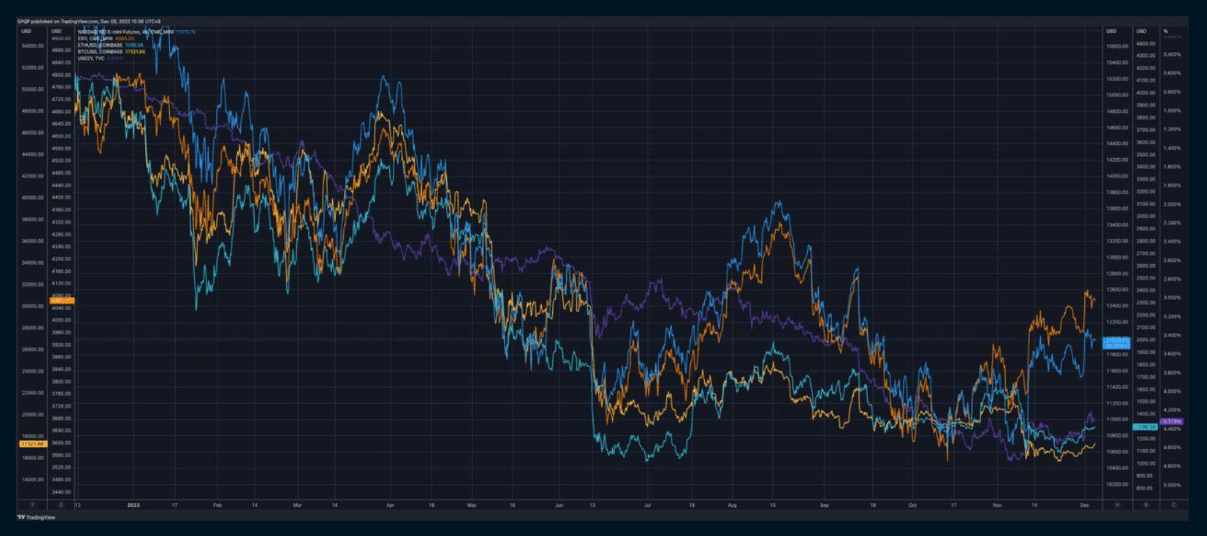
And assuming the 2-year yield is still the market's way of pricing the Fed's terminal rate next year, then we potentially still have more downside, as the Fed warns it will now hike rates past 5%!
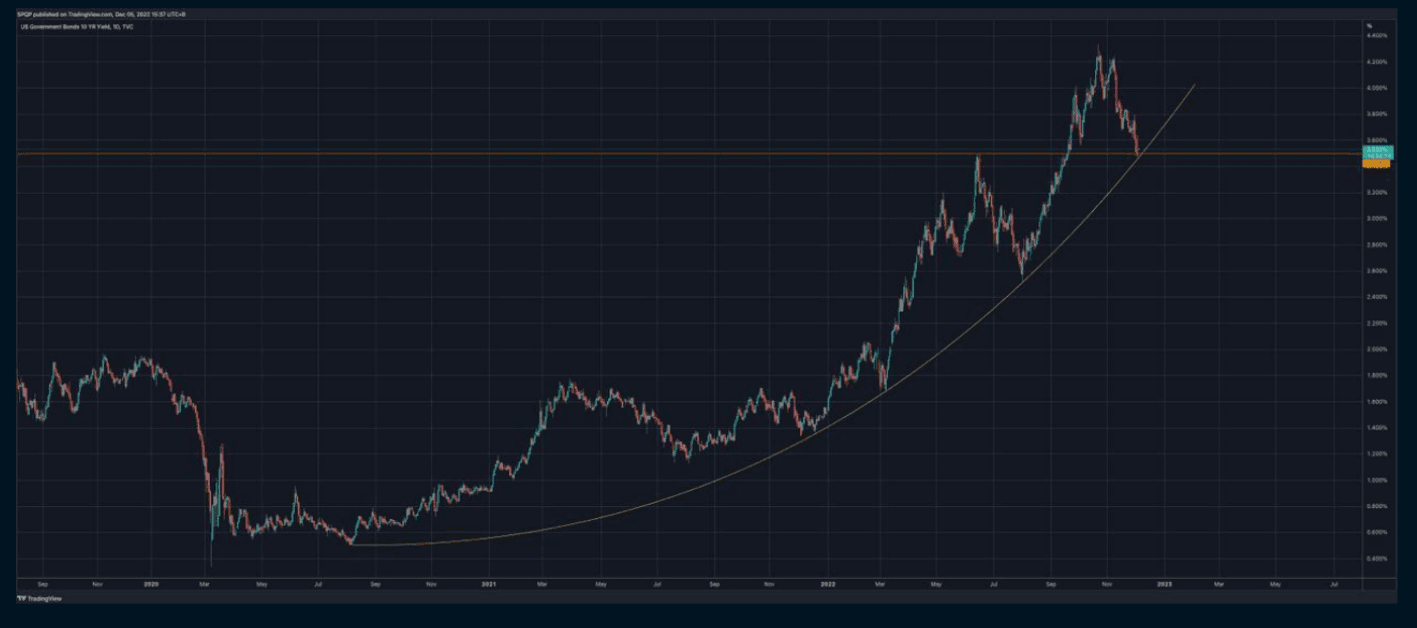
One market we're watching closely is the 10-year yield, which is trading back at its parabolic trendline that has supported the entire rally since the Aug 2020 lows! (Chart 2)
Is this yet another false dawn for markets? The price action here will lead the way to answering that.
2. Macro
Having said all that, it will once again come down to next week's CPI on 13 Dec. And perhaps data will be on the side of markets here.
With retailers struggling with inventory all year due to the consumer slowdown, it is likely they have used Black Friday/Cyber Monday to offer eye-popping discounts in order to clear stock, which would factor into the November CPI print released next week.
Outside of that, we thought last week's Powell speech and NFP data should have been market negative events, but we clearly underestimated the market's momentum.
Fundamentally, we can only think of 2 possible reasons for the market to be so sanguine (even optimistic) about last week's developments:
- On Powell - Saying that they will be moderating the pace of hikes in Dec while raising the terminal rate.
Since the bar to cutting rates are much higher than ending hikes, perhaps the market sees it that by slowing here, hopefully the economic data will turn down fast enough to force them to pause early before they reach their terminal target.
For us we saw it as a huge negative - that next week's FOMC on 14 Dec will again have a higher terminal dot projection, which could even go above 5% for the first time since the GFC!
- On NFP - The earnings blowout of 0.6% m/m vs. 0.3% m/m expected.
This would have naturally put a huge dent in the market as wages are the most fundamental variable for inflation and the main thing the Fed have been trying to slow with their rate hikes.
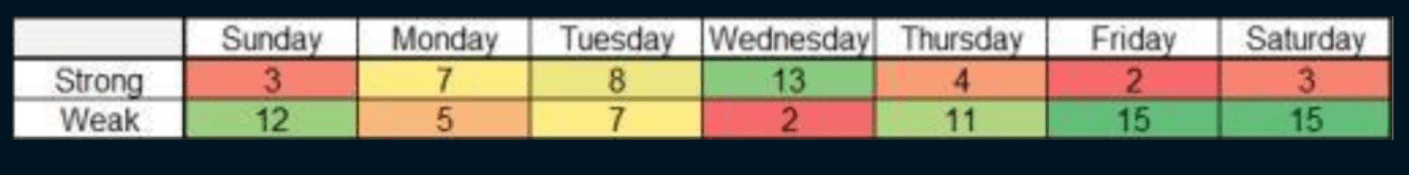
And this even came despite the statistical advantage of the 12th of November (the day they do their monthly survey) falling on a Saturday, meaning that most workers would not have been paid yet, and leading to a downside bias. The statistical skew to the day of the month the 12th falls on has been very significant in recent years (Chart 3).
However this time, there could have been an anomaly where tens of thousands of retrenched high-paying tech workers received their severance in the month, which could have artificially boosted the earnings number.
Nonetheless for us, we saw the huge beat on jobs and earnings as another reason the blinkered Fed will use to justify a terminal rate above 5%.
3. Micro
For us in crypto, the next big catalyst is any news surrounding the lender Genesis and a potential Chapter 11 bankruptcy filing.
This is the biggest known unknown for markets right now, and will definitely be treated as a case of no news is good news.
As we wrote in our latest Crypto Circular: 50 Shades of Gray, an official filing will be taken very negatively by markets.https://qcp.capital/featured-article/crypto-circular-8-50-shades-of-gray/
And because the market, rightly or wrongly, will extrapolate directly to GBTC & ETHE, the immediate knee-jerk will be to sell BTC and ETH.
And for BTC and ETH, despite the massive percentage gains in the last 2 weeks, their respective rallies still just look like blips on the longer-term charts.
- On the weekly BTC chart (Chart 4), we are in the process of forming an ending diagonal - where a topside breakout has often marked the end of the 5th wave downtrend.
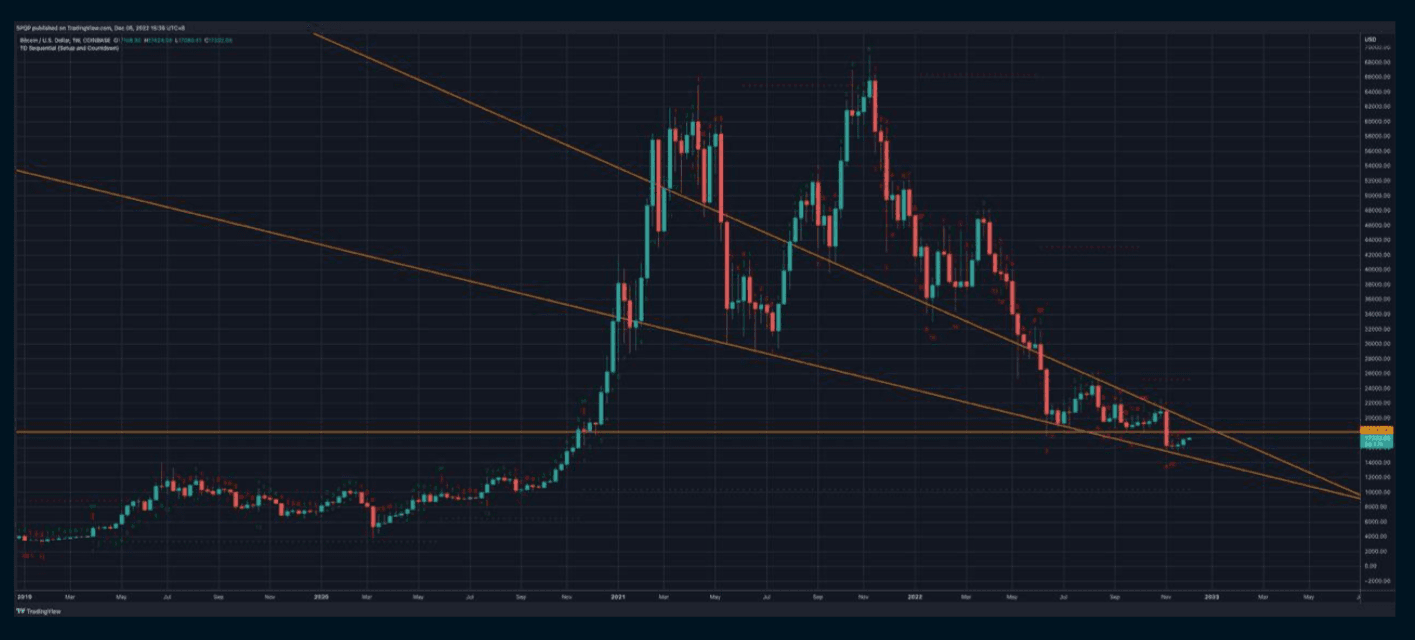
However it is premature to call the bottom here as we still have 1 more down leg to go to satisfy the textbook conditions for the termination of this diagonal. On the topside, we see 18.5k as the big resistance level consisting of the top of the diagonal, together with the prior Q2 and Q3 lows. On the downside, the 10k weekly TDST level should provide a very good base should we breakdown again. We recommend selling physically-settled strangles against these respective levels.
- On the ETH daily chart (Chart 5), charting the decline from the 4867 highs last November really puts the "massive" 22% rally this November into perspective.
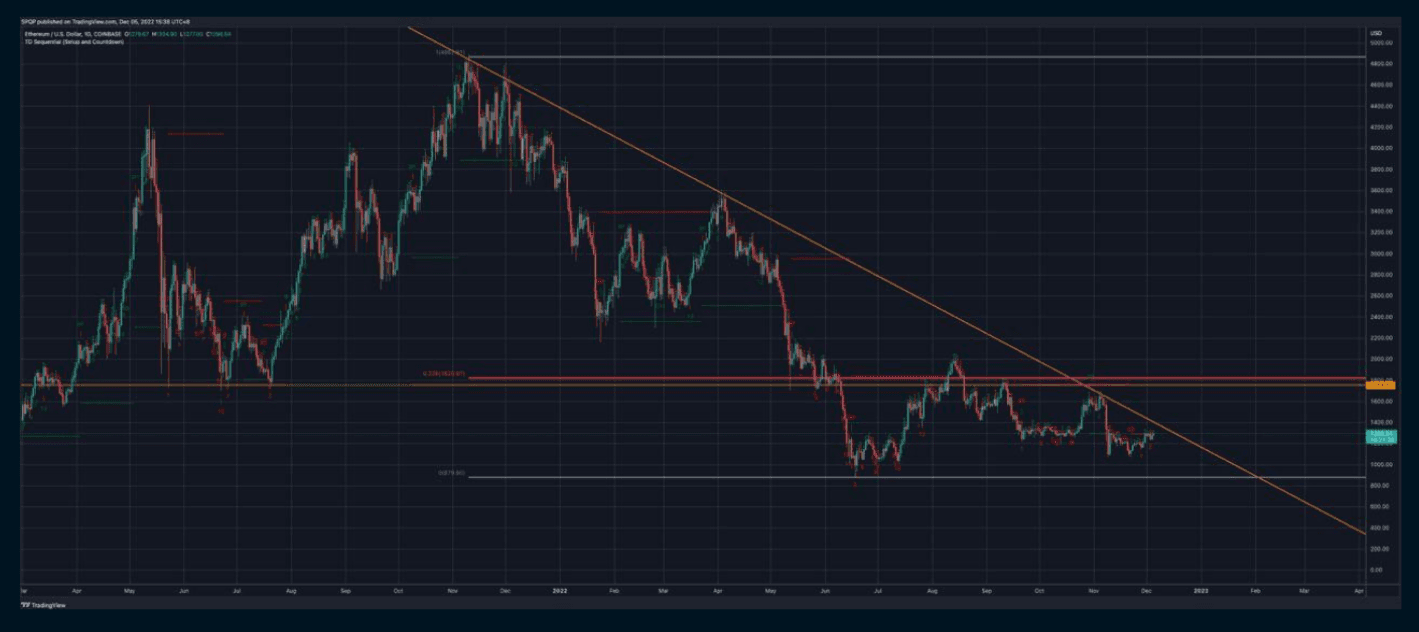
On the topside we see 1750-1850 as huge resistance that should hold, and recommend selling calls against this level. 1820 is the 23.6% Fibonacci retracement of the Nov-21 high to Nov-22 low.
Before we get there though, 1400 is the immediate resistance from the trendline that has marked all the tops in the past year. We really need to see this level break convincingly before we turn bullish on anything crypto.
The beta of BTC to ETH has been much lower in this rally, and we expect the same of any selloff as well.
Overall though we maintain our structurally bearish stance, believing that there will be much selling pressure as institutions look to take advantage of any rally to sell crypto assets and raise much needed liquidity.
Disclaimer
QCP Capital is an exempt payment services provider pending licensing by the Monetary Authority of Singapore as an MPI for Digital Payment Token Services under the Payment Services Act (2019).
This information contained in this document is intended as a general introduction to QCP Capital and its activities as a Digital Payment Token (DPT) service provider and is for informational purposes only. QCP Capital is not acting and does not purport to act in any way as an advisor or in a fiduciary capacity vis-a-vis any counterparty. Therefore, it is strongly suggested that any prospective counterparty obtain independent advice in relation to any trading investment, financial, legal, tax, accounting or regulatory issues discussed herein. This document is only directed at informed and qualified investors. By reading this material attests that you are fully aware that trading of DPTs is not suitable for the general public and that you are an informed and qualified investor, and are also fully cognisant of all technological and financial risk(s) associated with trading Digital Payment Tokens.
Before you engage us or any of our services, you should be aware of the following:
Please note that this does not mean you will be able to recover all the money or DPTs you paid to your DPT service provider if your DPT Service Provider’s business fails.
You should be aware that the value of DPTs may fluctuate greatly. You should buy DPTs only if you are prepared to accept the risk of losing all of the money you put into such tokens. your DPT service provider if your DPT service provider’s business fails.
You should not transact in the DPT if you are not familiar with this DPT. This includes how the DPT is created, and how the DPT you intend to transact is transferred or held by your DPT service provider.
You should be aware that your DPT service provider, as part of its licence to provide DPT services, may offer services related to DPTs which are promoted as having a stable value, commonly known as “stablecoin”.