
In this newsletter, we analyse the recent sell-off in Tech stocks and what it signals for crypto prices. We review our Quant and Technical Signals and also follow the behavior, cross-chain, of wallets, according to ETH and ETH derivative balances.
Macro and Markets
The adjustment higher in US rates seems largely baked in asset prices for now, at least in government bond future and swap prices (the jury is still out on equities and crypto in our view). US rate futures are now pricing that only one Fed rate cut is likely by December 2024. The assessment of this repricing's "damages" on risk assets, peak-to-trough, is -14.2% for BTC, 34bps spread-widening for US credit High Yield, -7.2% for the Nasdaq, -5.4% for the S&P 500 and -8.2% for US small caps.
Fed Chair Powell and other Fed speakers verbally validated the rate market adjustment in the past few days: “Recent data have clearly not given us greater confidence” that inflation is under control and “instead indicate that it’s likely to take longer than expected to achieve that confidence. [...]. If higher inflation does persist,” Powell said, “we can maintain the current level of (interest rates) for as long as needed.
And now the question is, to paraphrase Peggy Lee, "Is that all there is"?
We tackle this question with macro scenarios first and then turn to technical analysis and quantitative indicators.
Fundamental Scenarios
Fundamentally, we see markets oscillating between two macro scenarios for the US: A. Inflation sticky/ strong growth vs B. Disinflation with some growth weakness, with the steady state being the C. "No landing" scenario (e.g. high rates but resilient economy). December 2023 marked the high point of the "Disinflation scenario", with the Fed operating its (in hindsight hasty) "pivot", on the back of encouraging Q4 2023 inflation prints. Data dependency has for trade-off rate volatility, which, in turn, leads to volatility in risk assets (as we write the VIX remains stuck above 17). This macro scenario "pendulum" has just swung in the opposite direction: now markets are focused on sticky inflation and resilient growth. We expect the swing to reverse, driven by some likely disappointing US growth data in the coming months. Indeed, there appears to be reflexivity operating between growth and market pricing of Fed rates. It goes like this: inflation prints lower -> Fed is encouraged and guides rate market pricing lower -> financing conditions loosen and stimulate growth (and risk asset prices)-> growth data come in strong + inflation sticky -> Fed takes note of the data and dials back its rate cut guidance -> financing conditions tighten and weigh on growth -> etc.
We are now in the latter stage of that dynamic: US mortgage rates have climbed back above 7%, and this will very likely put a stop to the revival in residential real estate activity visible since the beginning of 2024 (see US Case-Schiller for example).
Additionally, the US growth has lately diverged from the perfect picture of health that it presented in 2023: services consumption seems to be doing ok still (United Airlines delivered an upbeat guidance for Q2 air travel), but spending on discretionary goods has weakened, which has been visible in retail sales' composition, but also in the Q1 earnings reported by US domestic retailers so far. To complete the picture of the US economy, let's quote its bottom-up district surveys of corporates and institutions, the Fed's Beige Book: "Ten out of twelve Districts experienced either slight or modest economic growth [...] while the other two reported no changes in activity. Consumer spending barely increased overall, but reports were quite mixed across Districts and spending categories. Several reports mentioned weakness in discretionary spending, as consumers’ price sensitivity remained elevated."
We also learn that wage growth is perceived as slowly declining and that short-term upside risks exist in inflation: "Contacts expected that labor demand and supply would remain relatively stable, with modest further job gains and continued moderation of wage growth back to pre-pandemic levels [... and that] inflation would hold steady at a slow pace moving forward. At the same time, contacts in a few Districts —mostly manufacturers— perceived upside risks to near-term inflation in both input prices and output prices."
The Beige Book seems to validate the "pendulum" theory: we might be heading towards lower-than-expected growth and potentially inflation data.
This will likely be supportive of Crypto prices, as long as growth is not contracting but merely slowing.
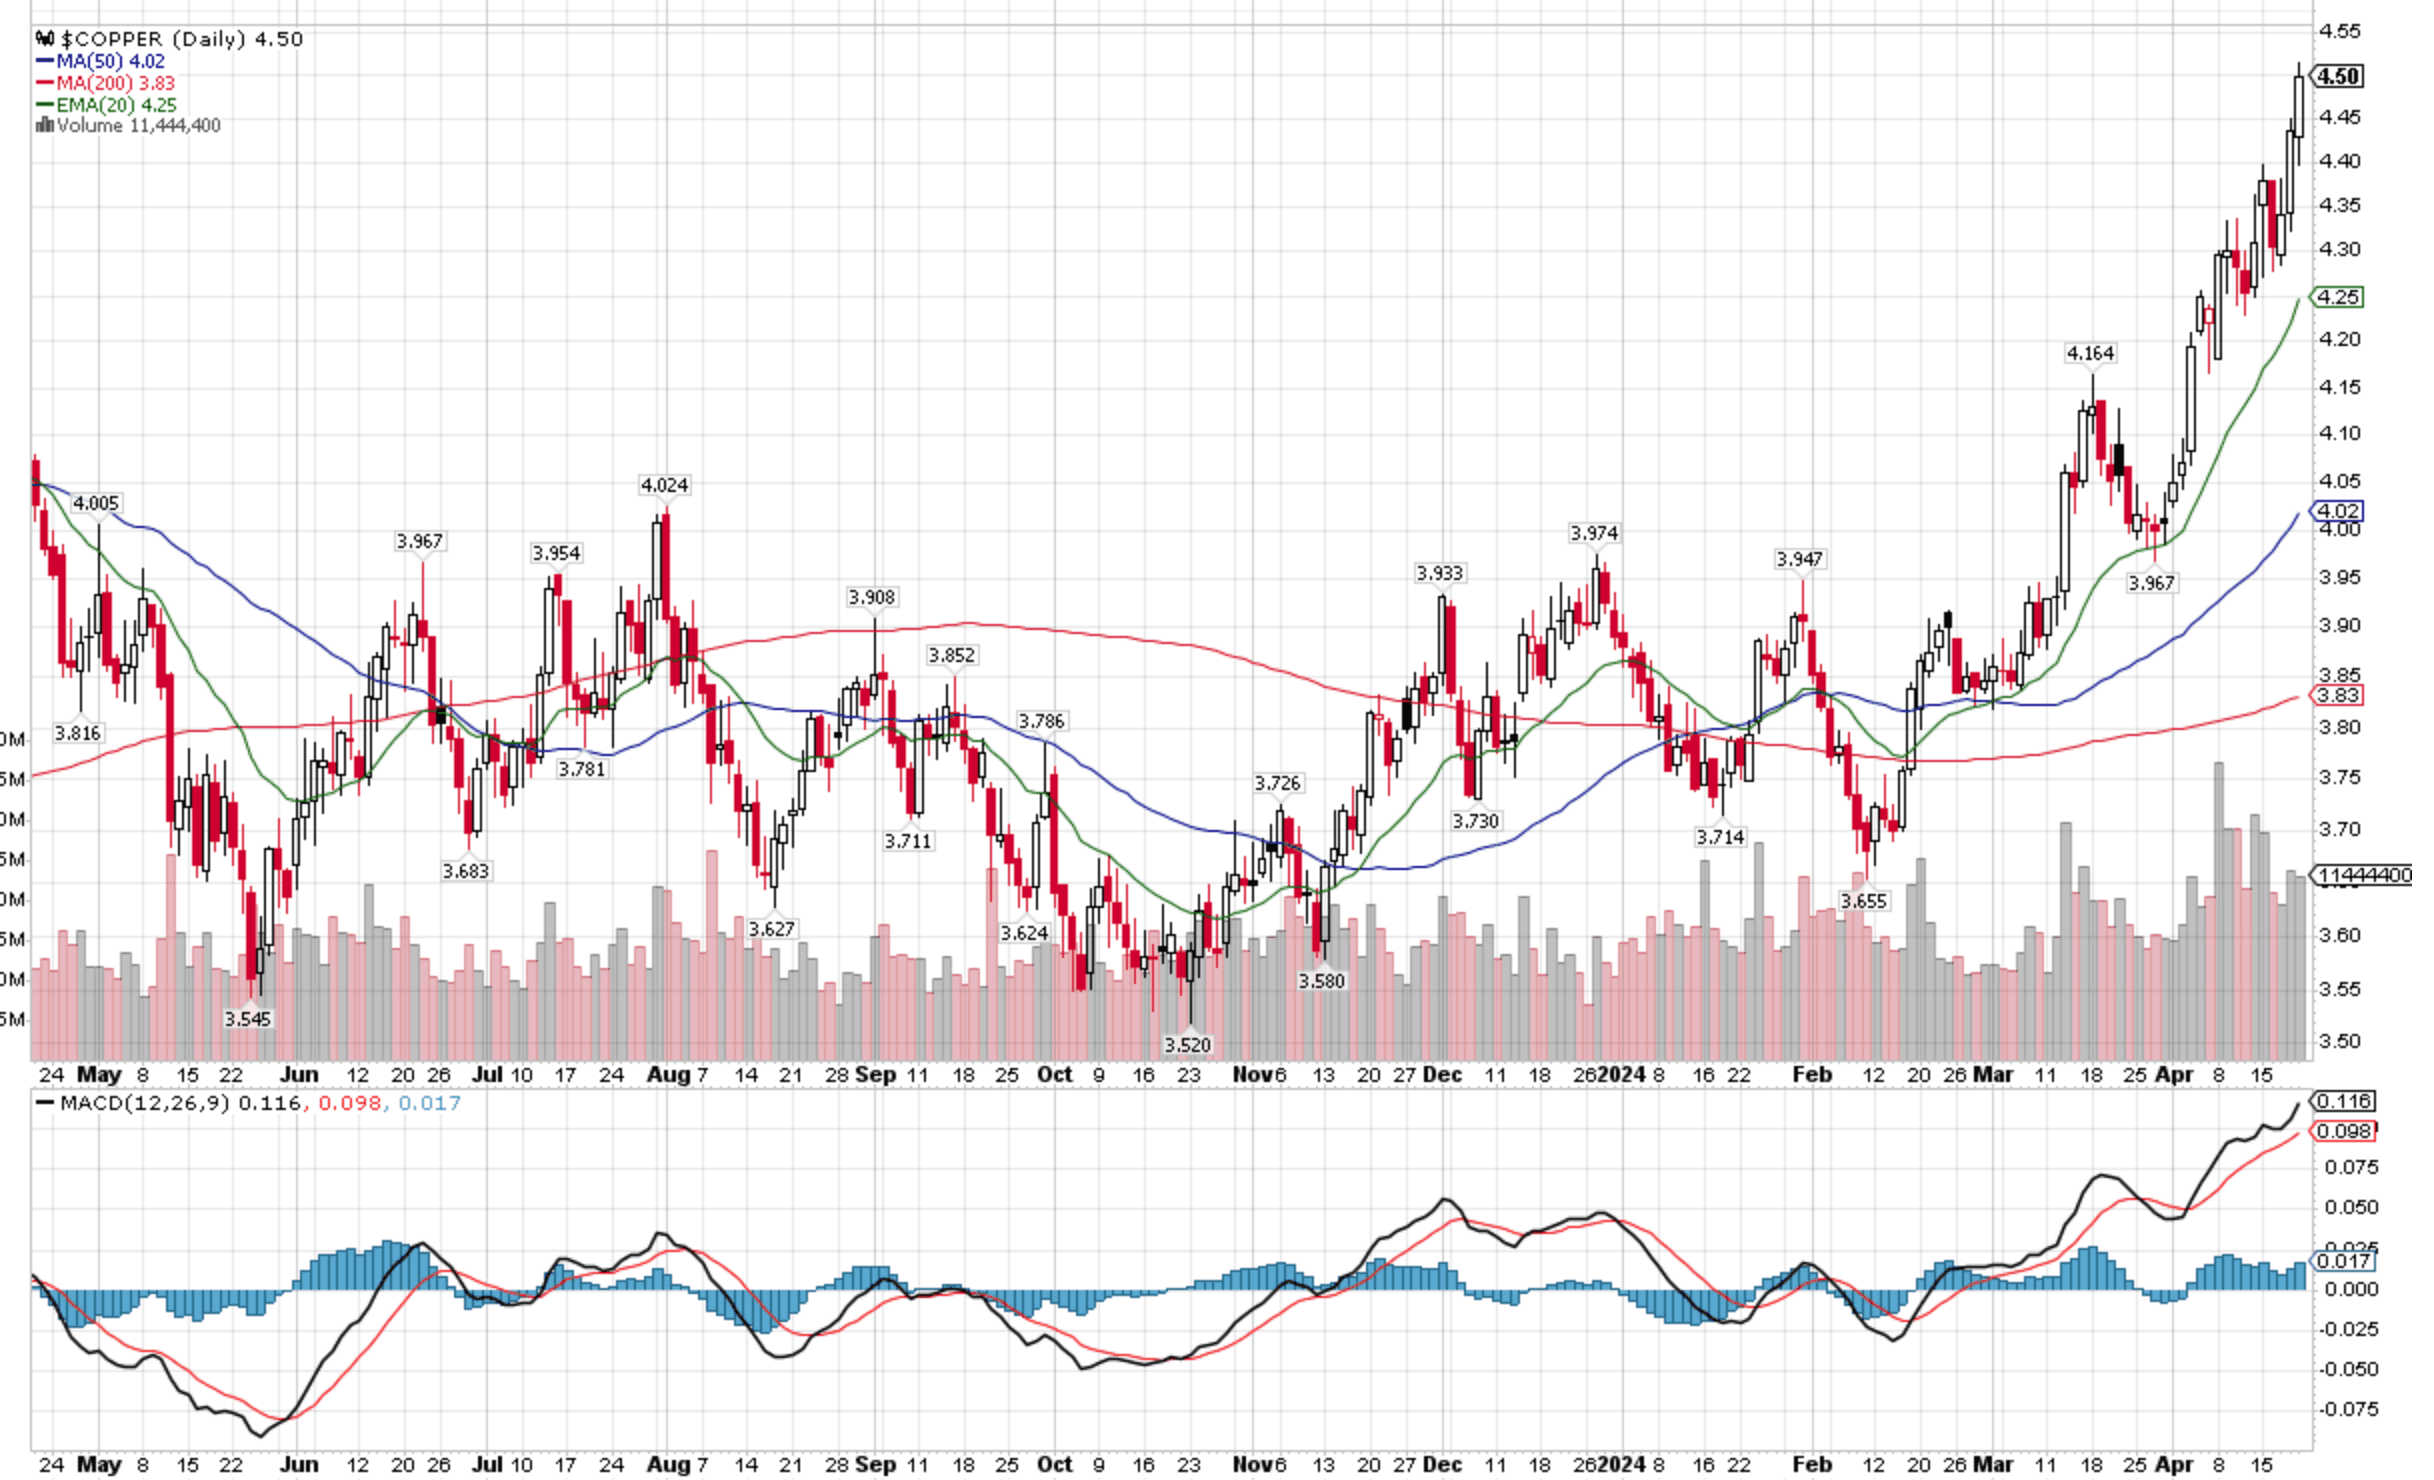
We want to leave the US for now and turn to China: growth data (ex-housing) have been improving overall, a trend that copper markets have already detected (see chart below, more upside likely in our view). This comforts our intuition that global growth is not yet at the edge of a recession (a recession would be bearish crypto prices).
Quant and Technical Signals
Crypto prices have sold off with equity prices. We therefore have to look into the latter to understand the former better.
The weak names in the recent sell-off have been Micron, TSMC, ASML, Tesla, and Apple, with the two latter clearly entering a downward momentum. If we review the earnings published by these companies so far, we can spot a few trends: weaker guidance has been given for commercial orders of chips and products associated with smartphones and PCs in 2024. This is especially the case in the US (again, it says something about the state of the consumer's finances) not so in China. AI chip demand is reported as still growing (how much vs expectations we will find out more during Nvidia's earnings call on May 12th).
We would like to show three charts around equity markets: the combination of the first two is somewhat encouraging, the third one less so.
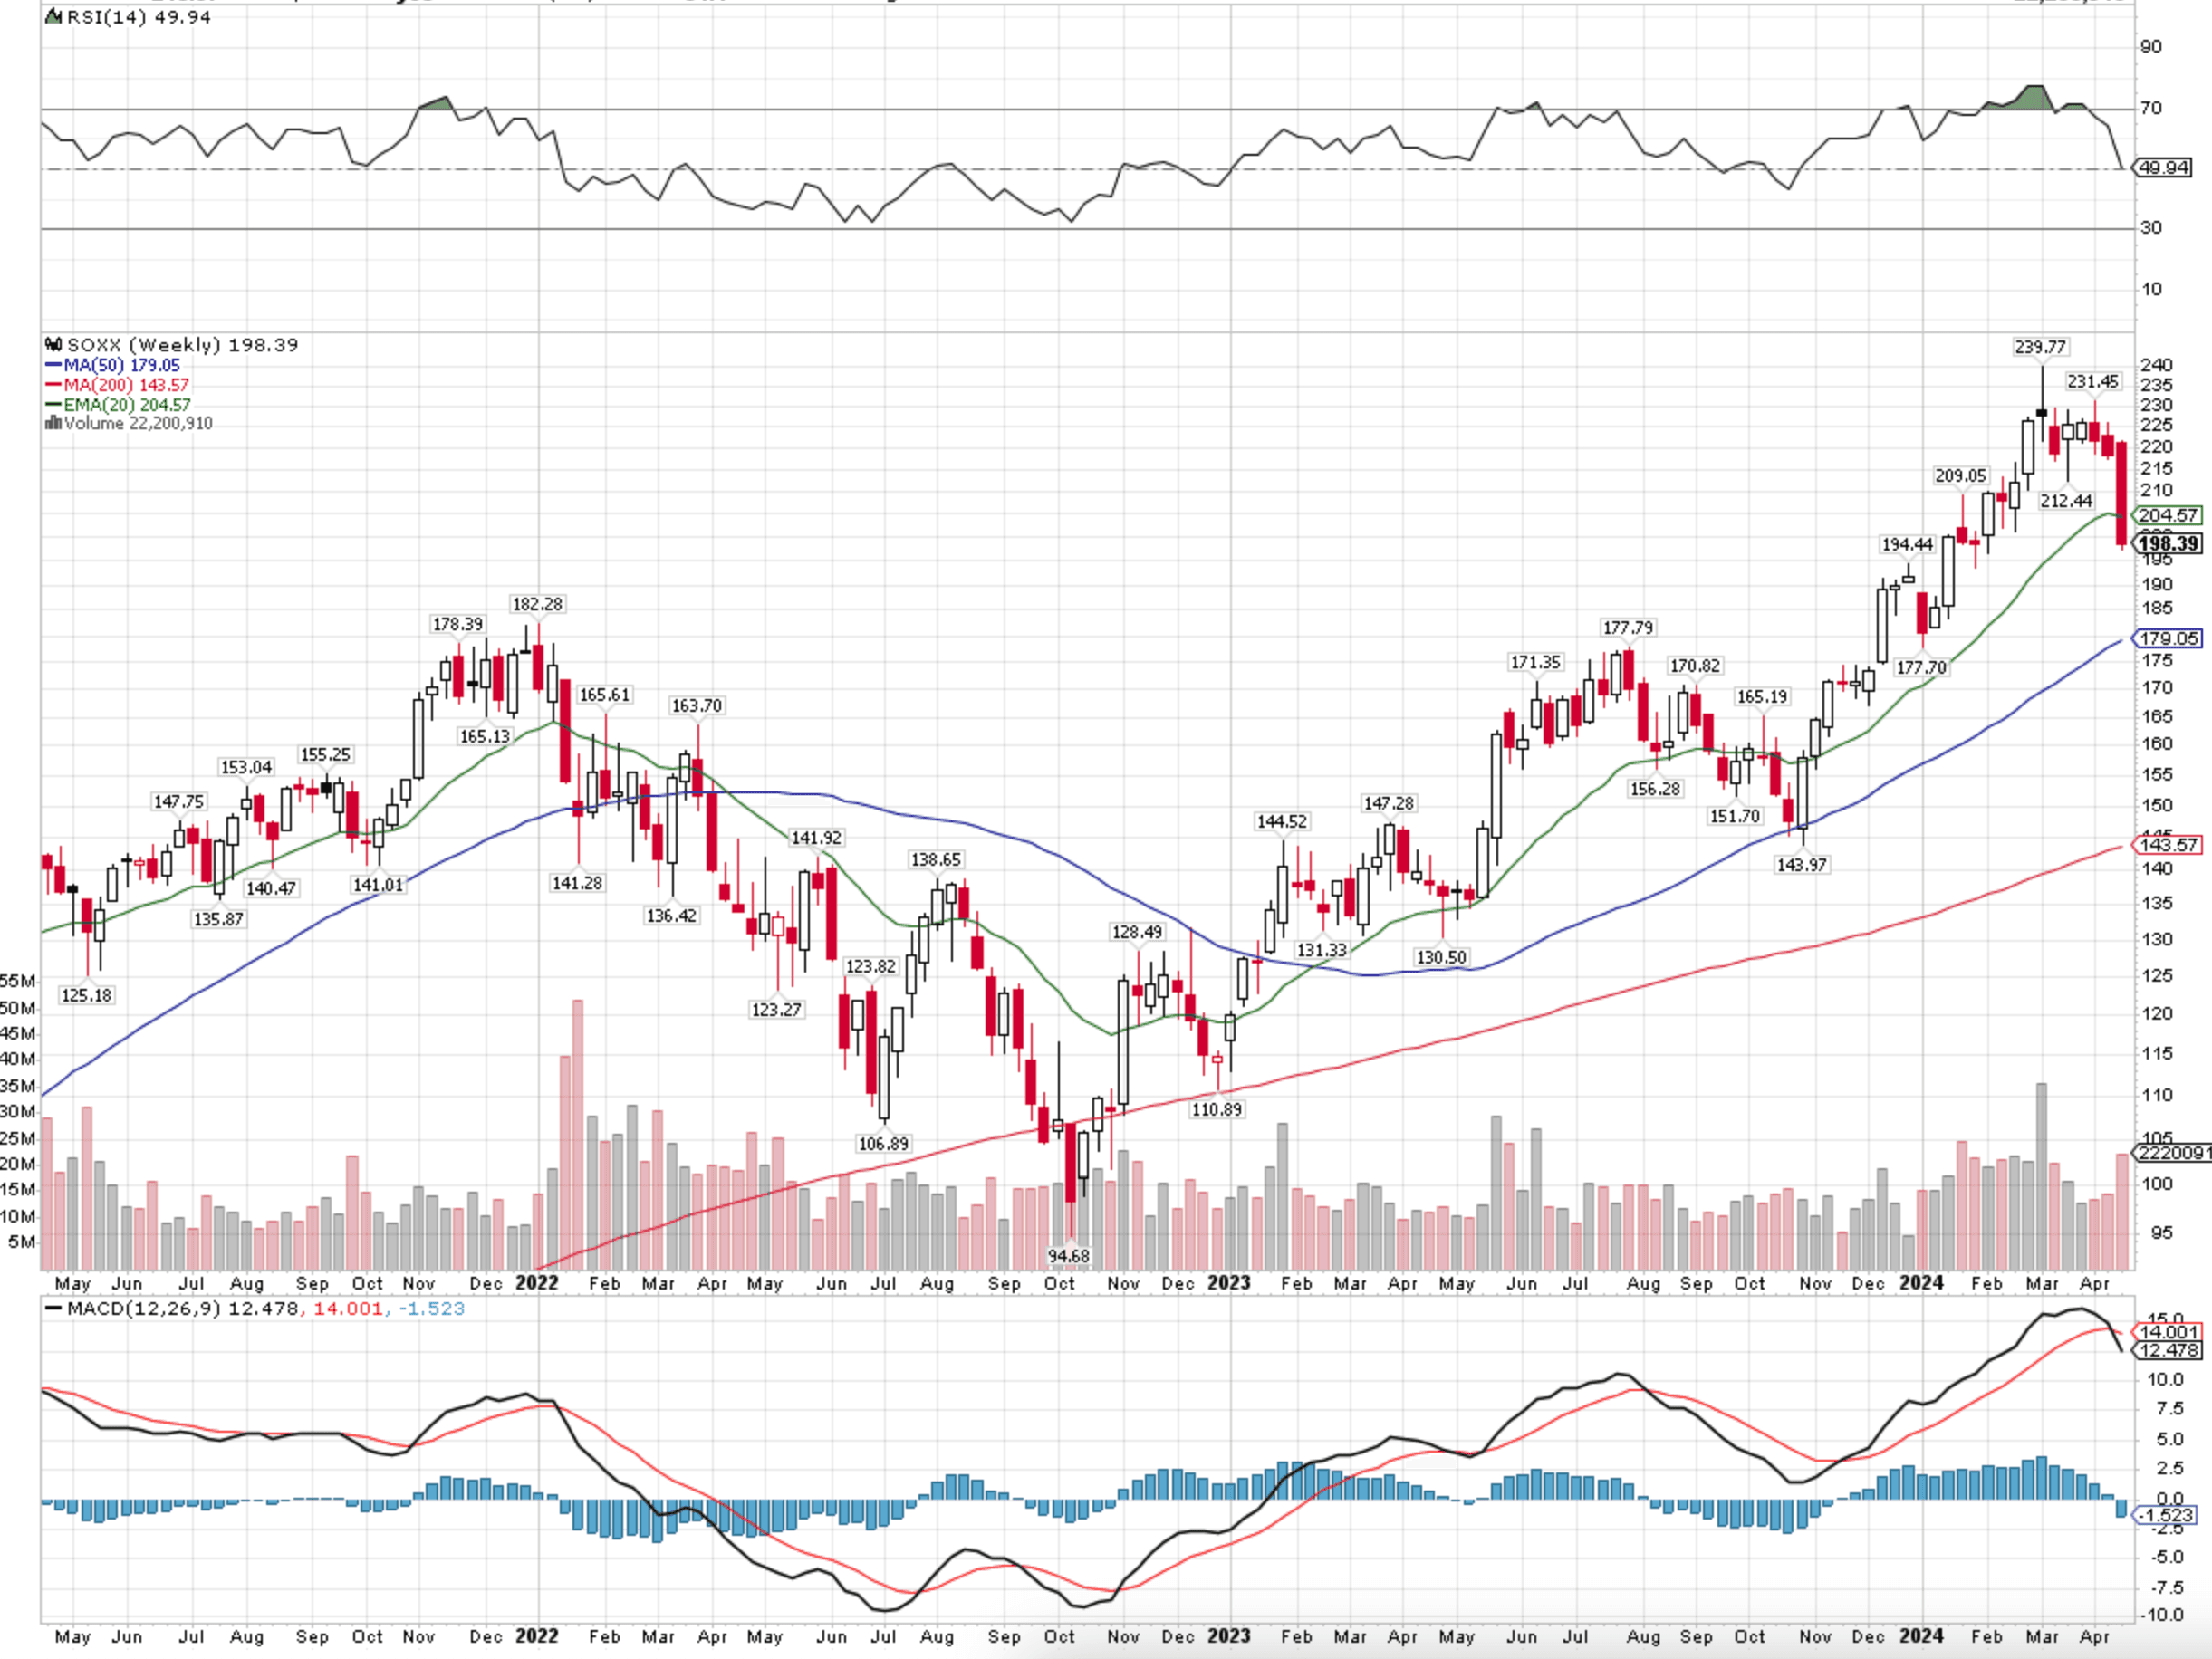
The iShares Semiconductor ETF or SOXX is experiencing a clear loss of momentum (20-day exponential moving average breaking below the 50-day), but zooming out to the weekly granularity, the uptrend appears intact (price break below the 20-week average needs confirmation).

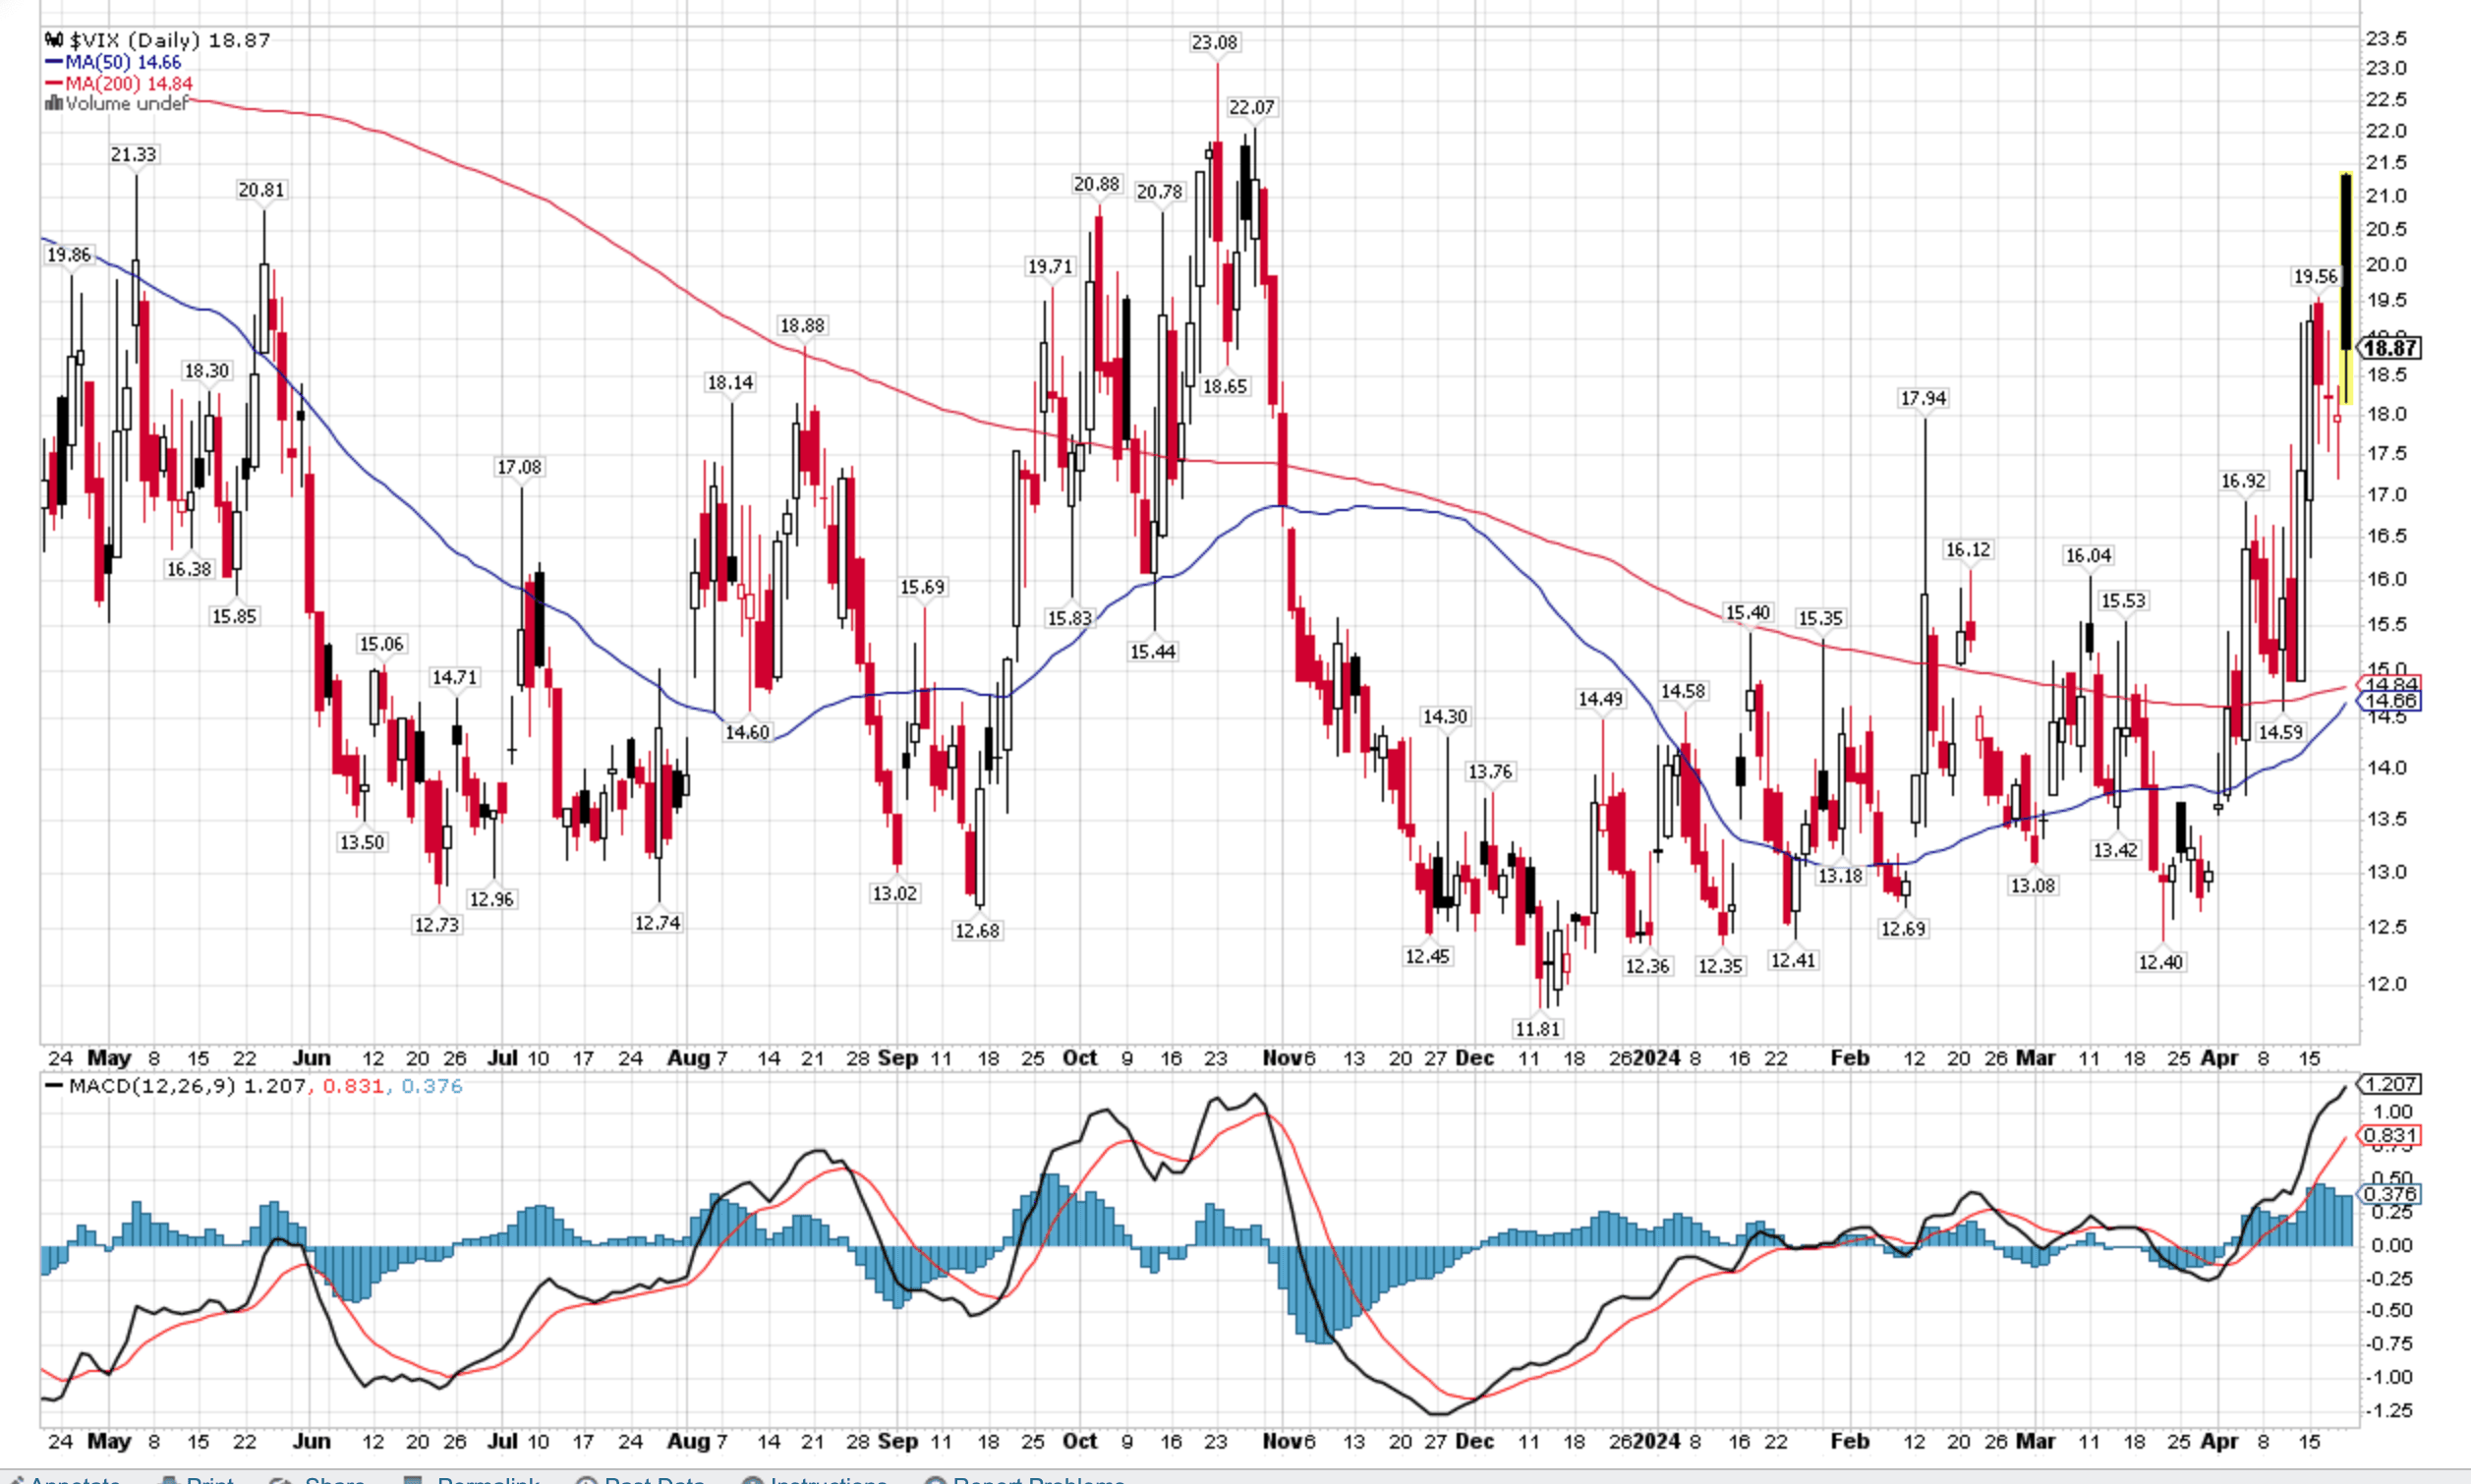
Moving on to the VIX, it just registered a sizeable daily candle as we write. It has not been this high for that long since Q4 2023. This warrants caution and tells us that the correction in equities (and crypto) may not be over yet.
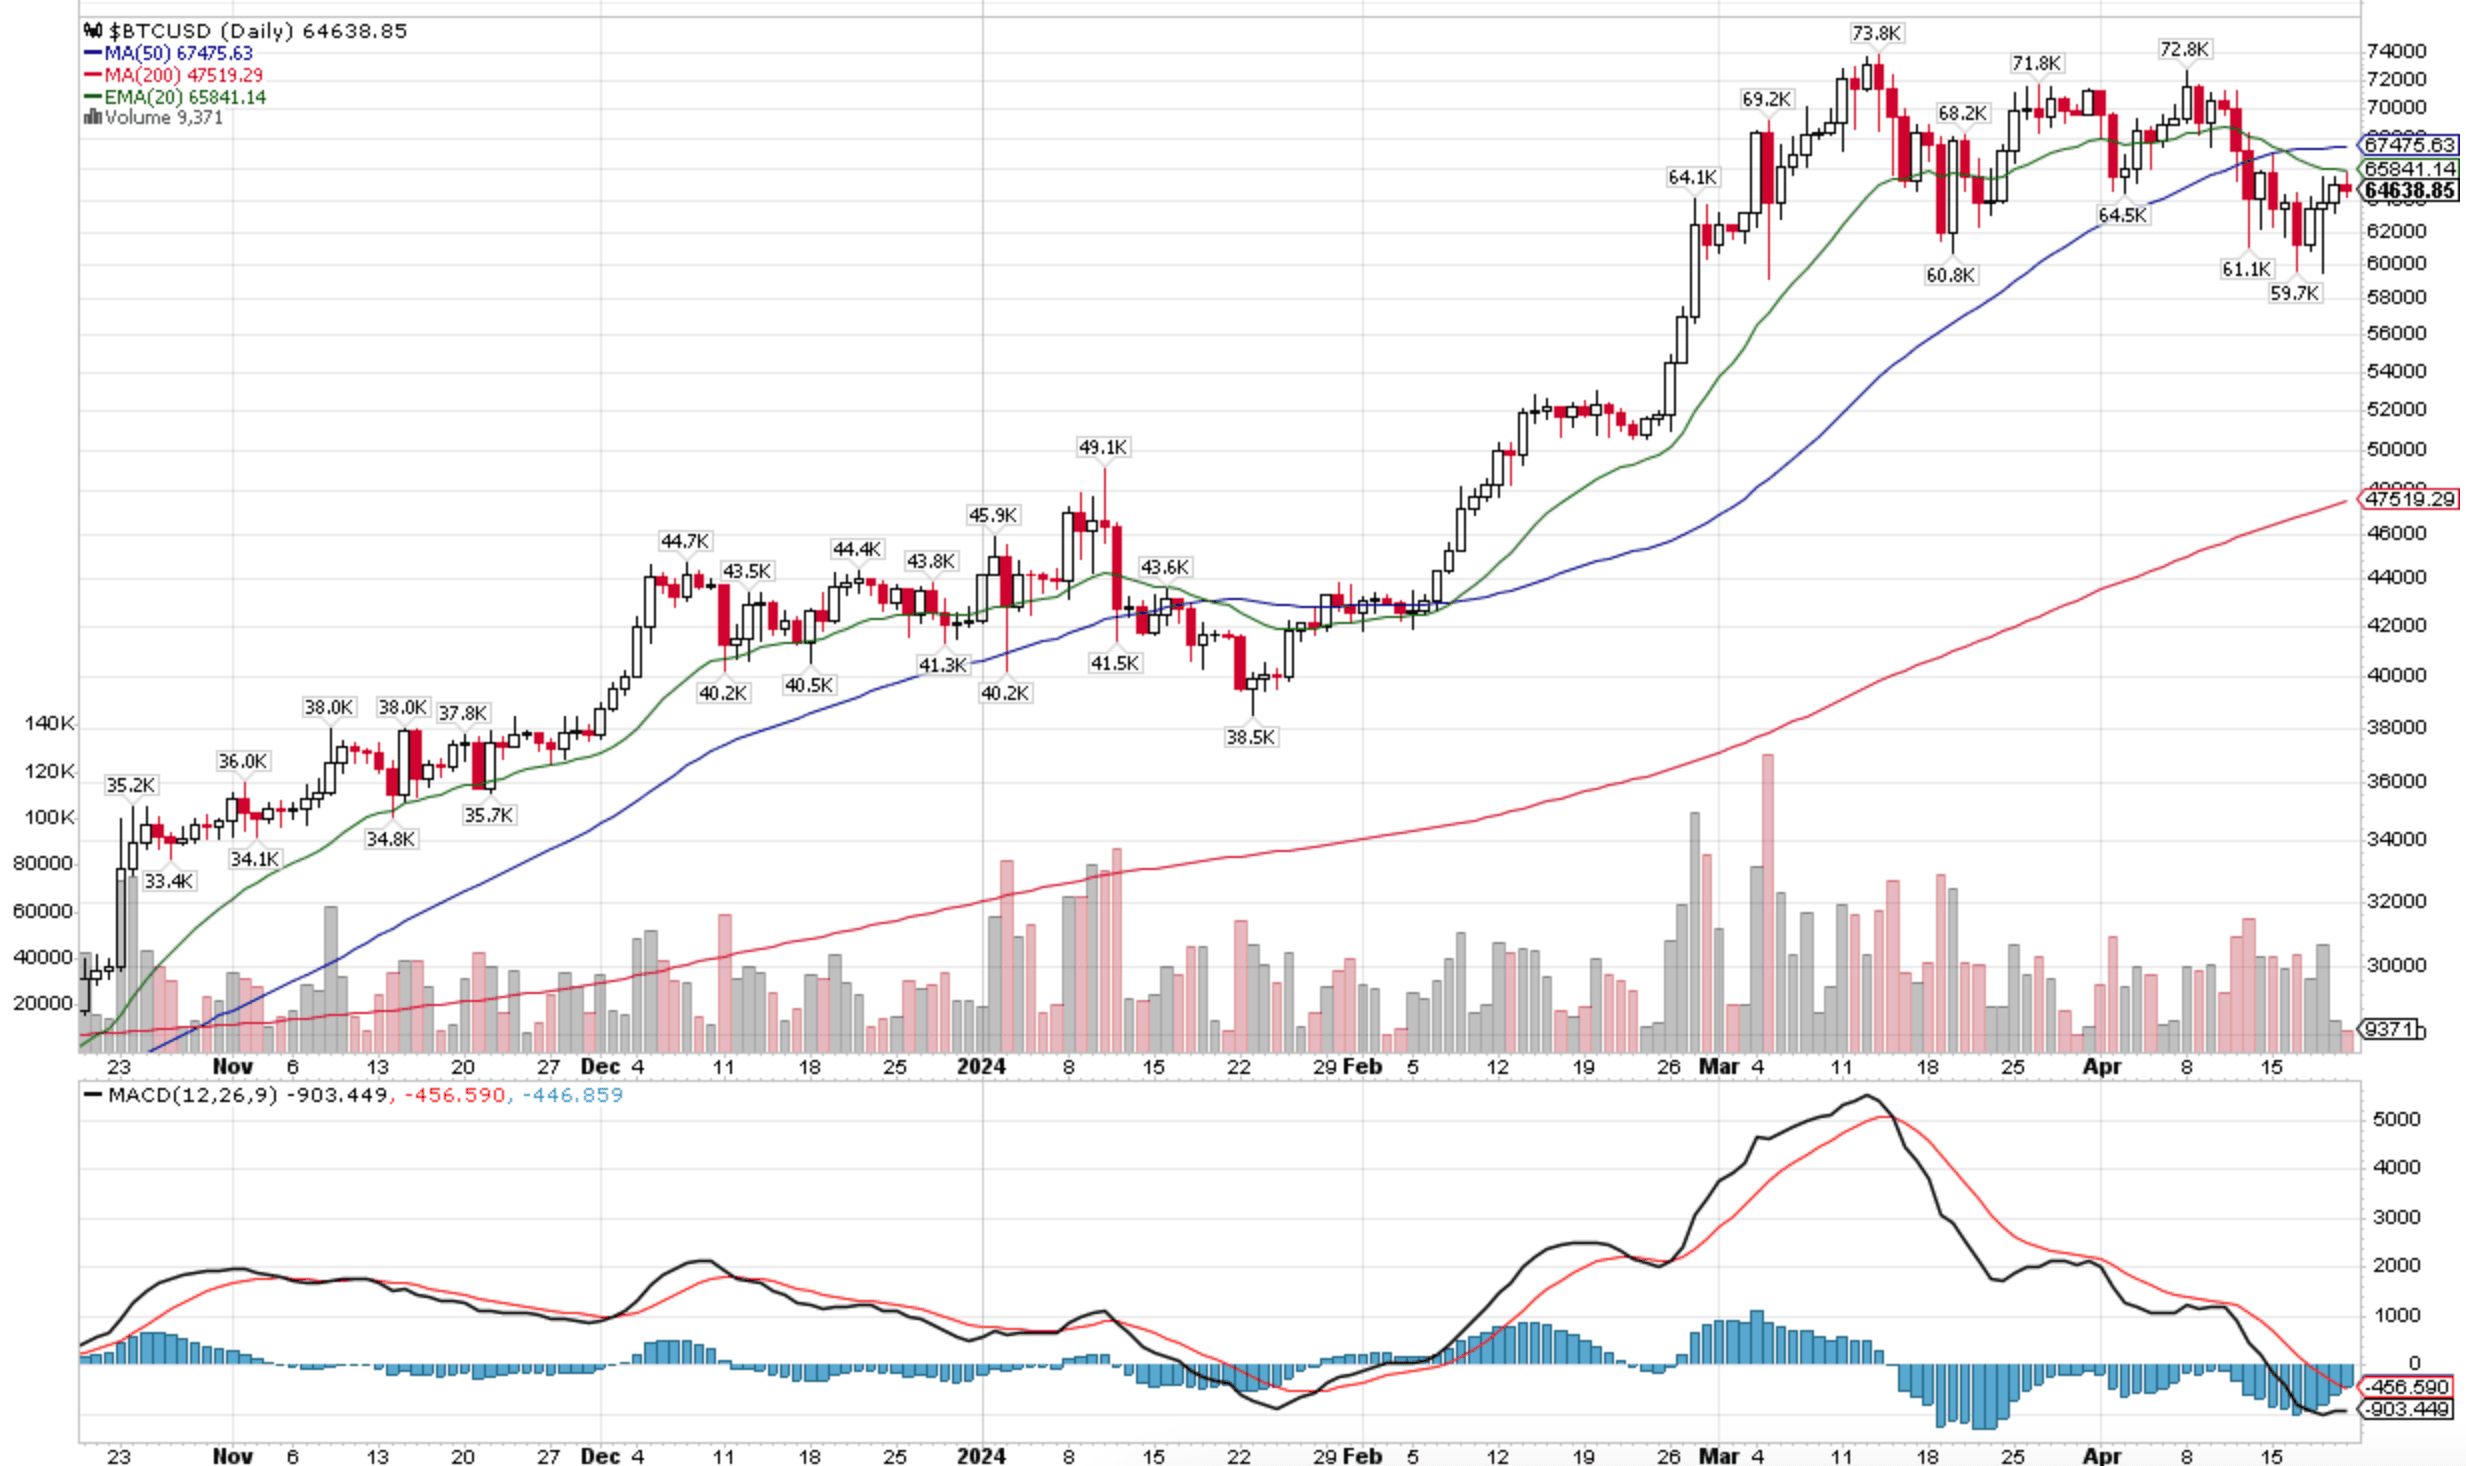
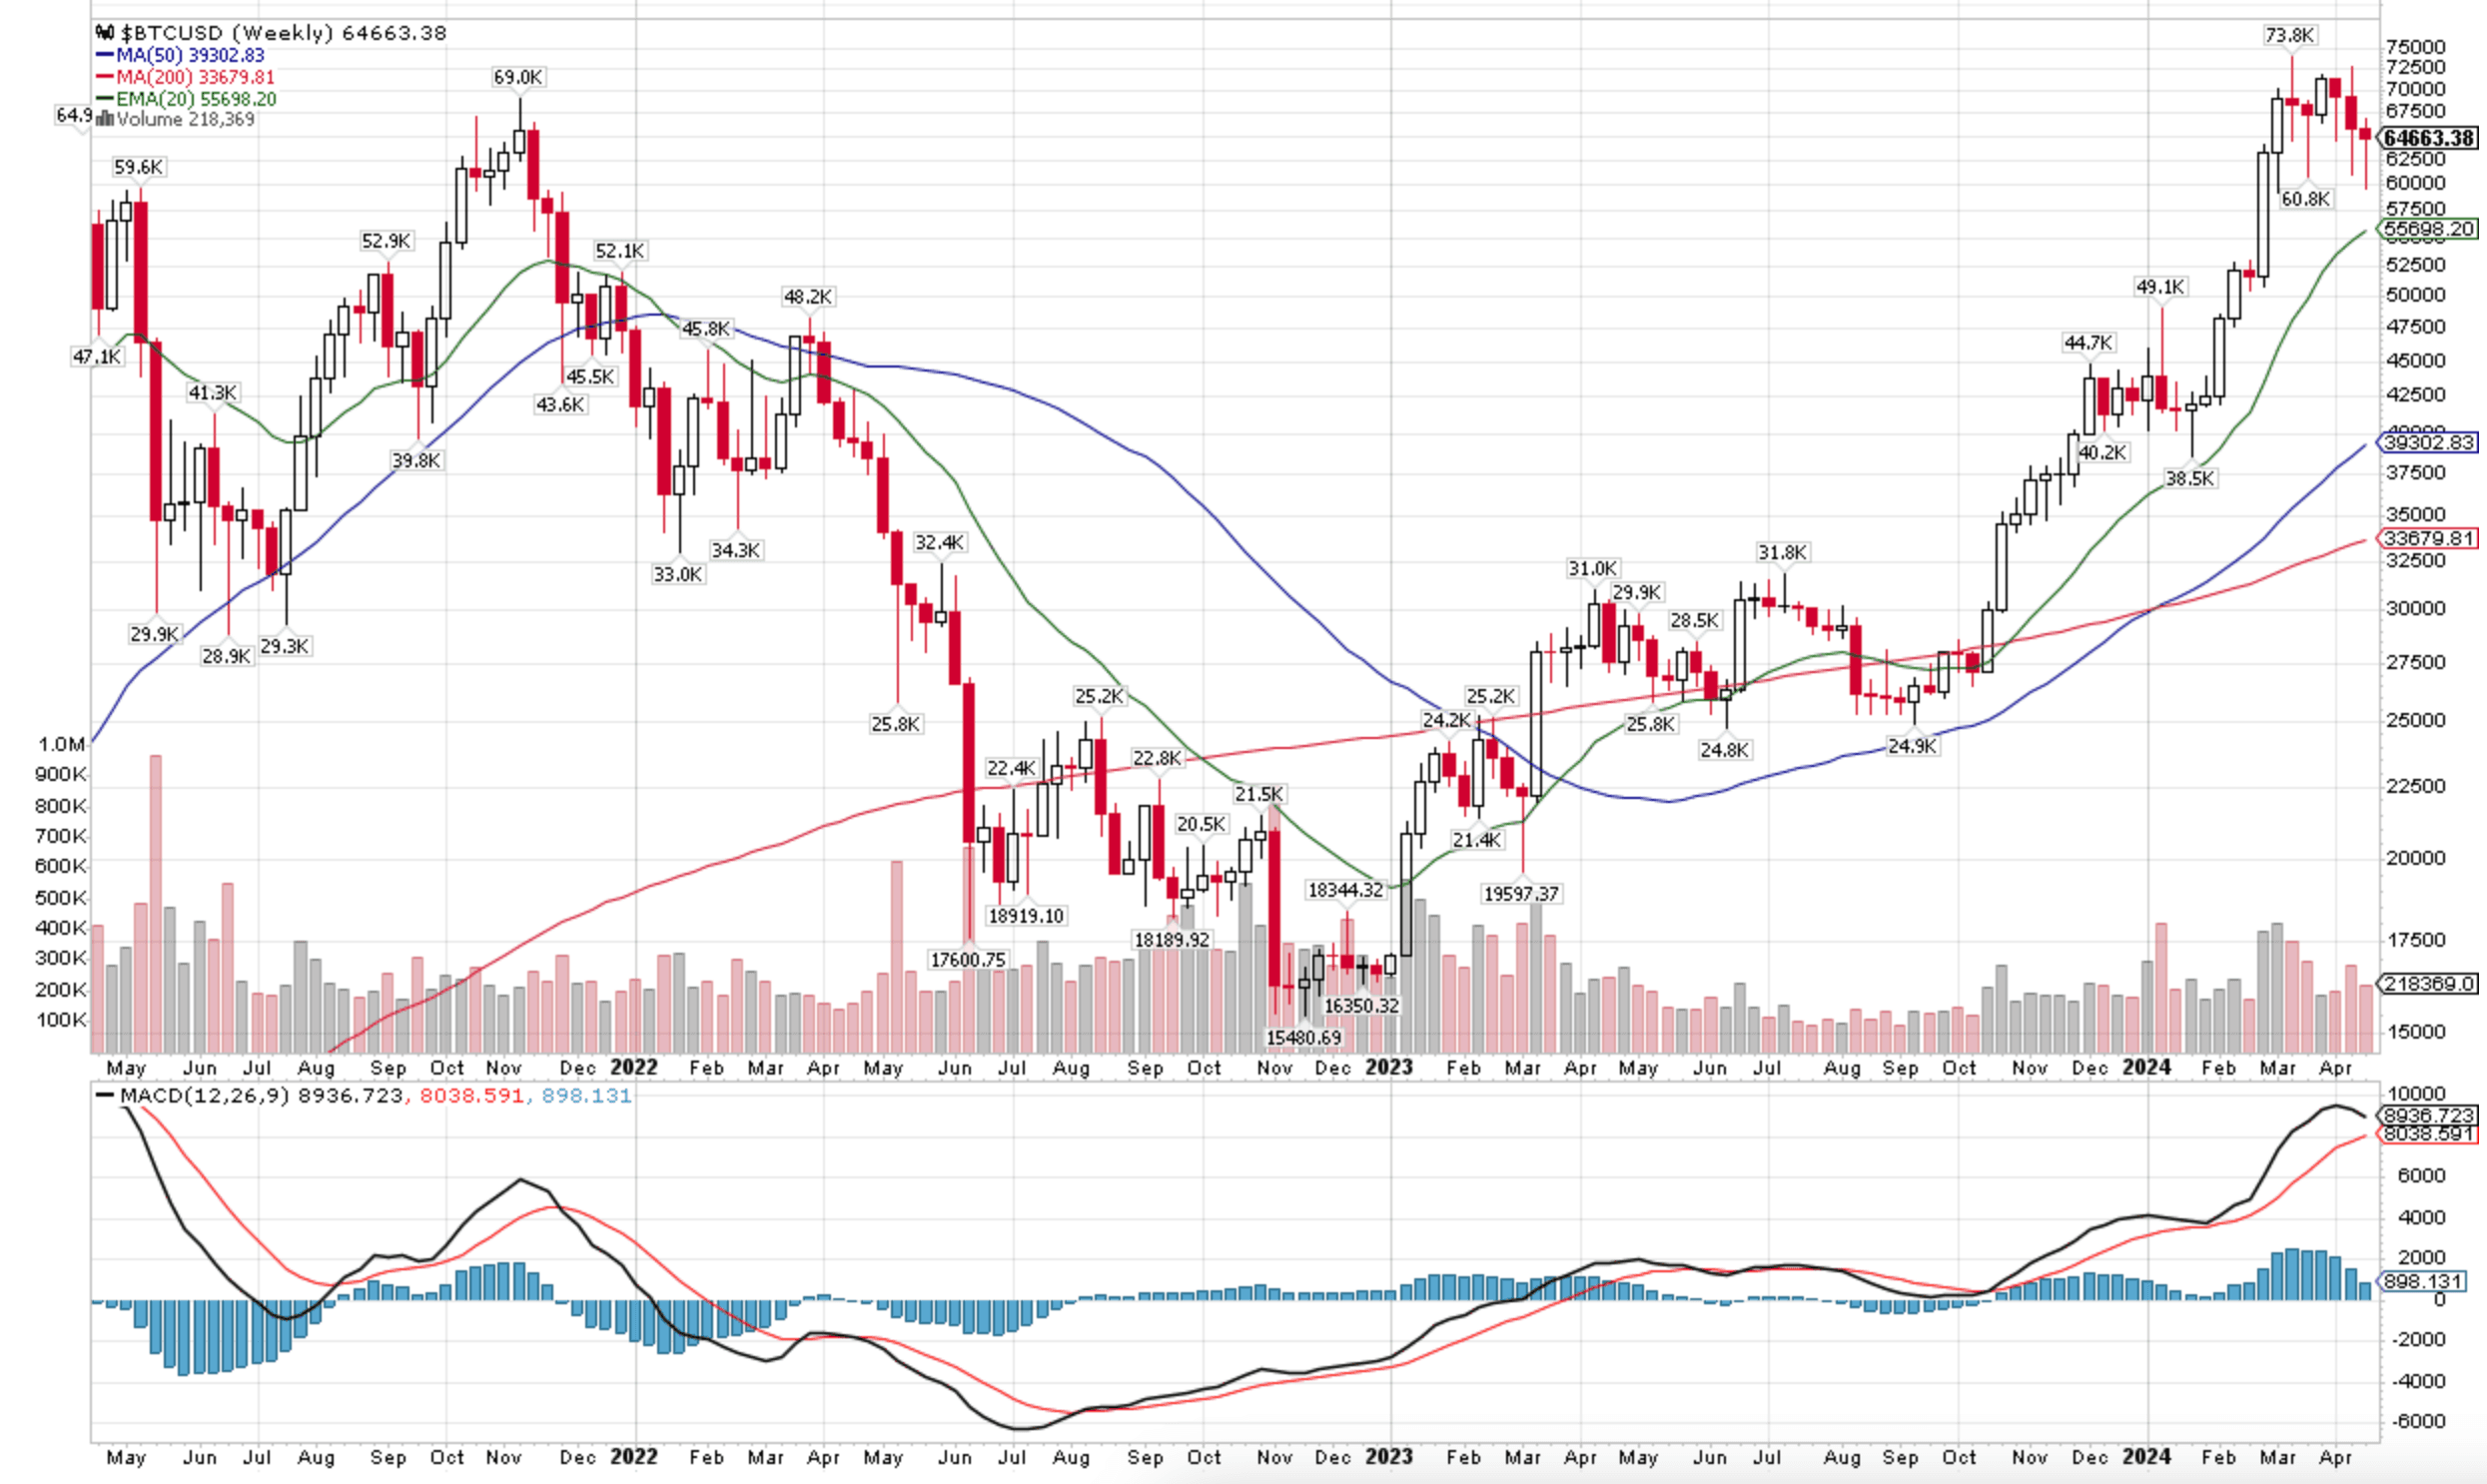
Finally, we move on to crypto. As for the SOXX index, combining daily and weekly price and volume data tells us that BTC appears to be experiencing a correction that does not question the bull market (e.g. we will likely revisit the all-time highs this year).
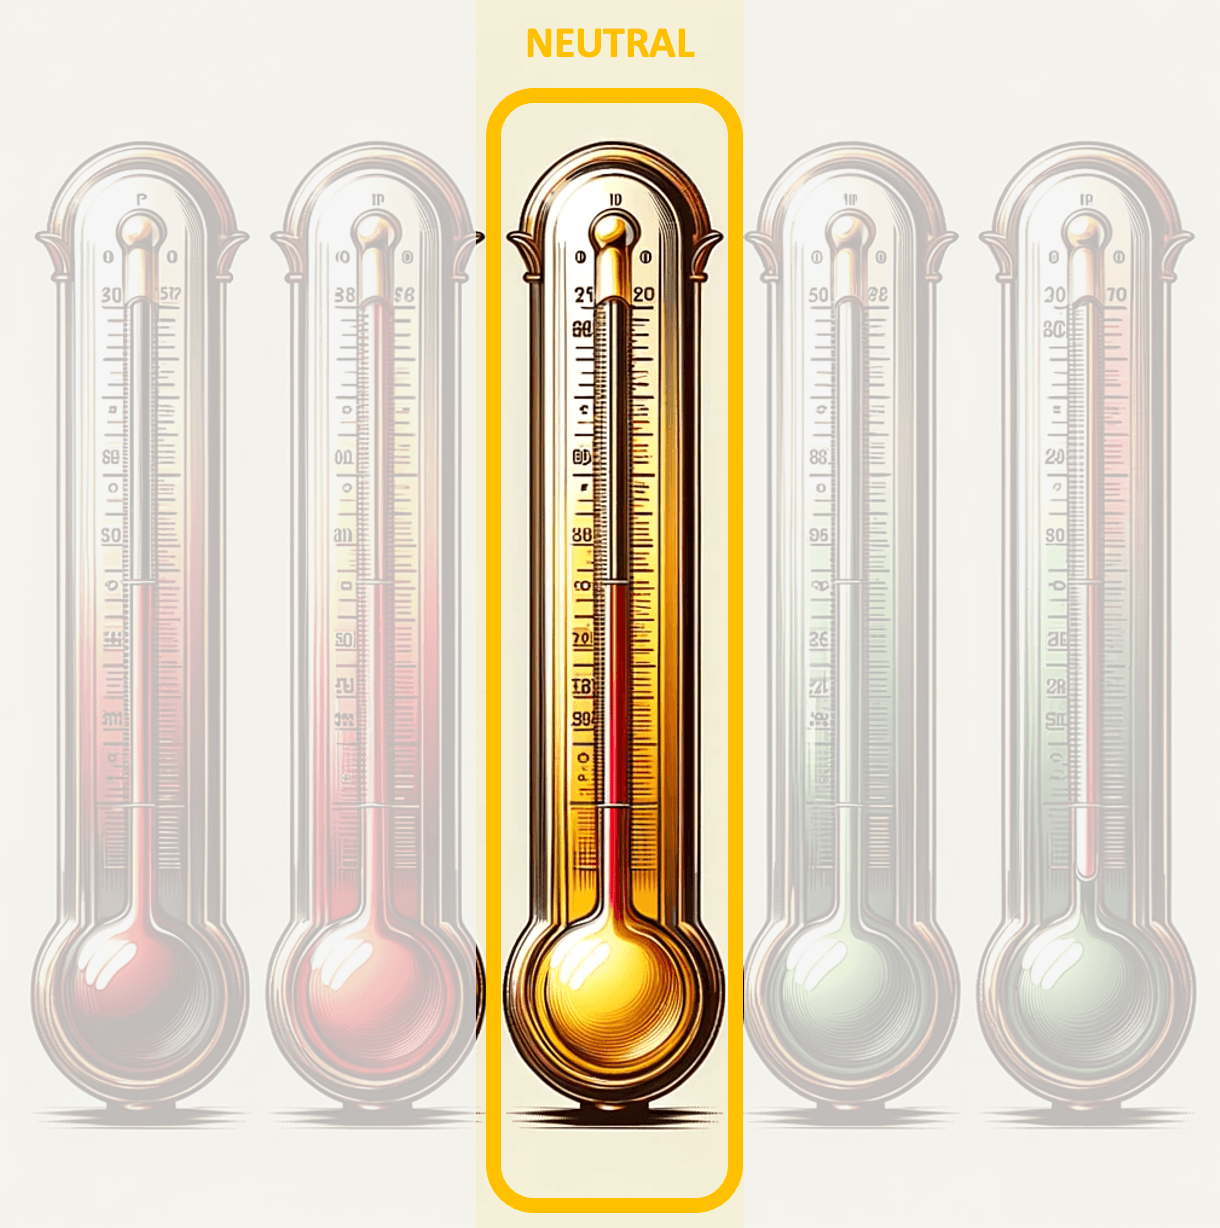
Our Crypto Barometer remains in "Neutral" territory so far, confirming a cautious stance as the best approach in the near term (BTC call-put spread still risk-off, in contradiction with BTC price momentum risk-on).
BTC ETF Flows and the Halving
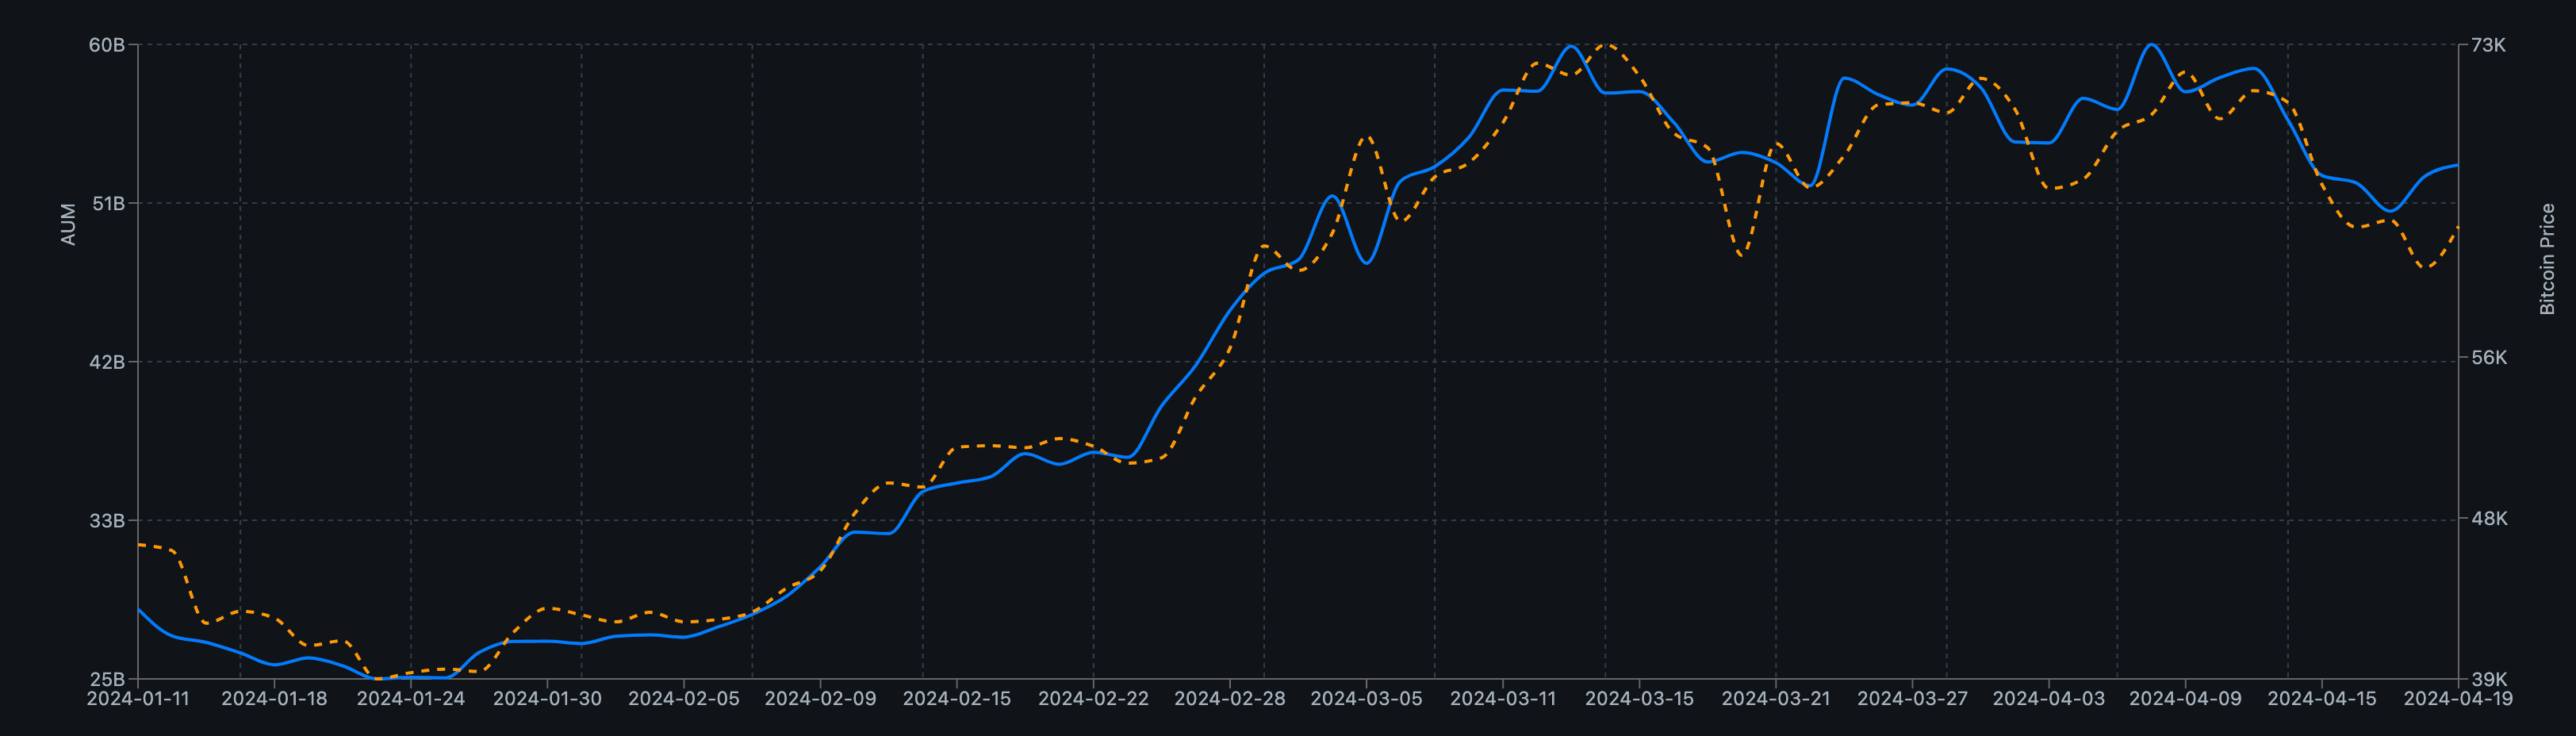
We do not see the recent move from net BTC ETF inflows to net outflows as bearish for BTC spot prices: in our view, flows are following prices and not the other way around:
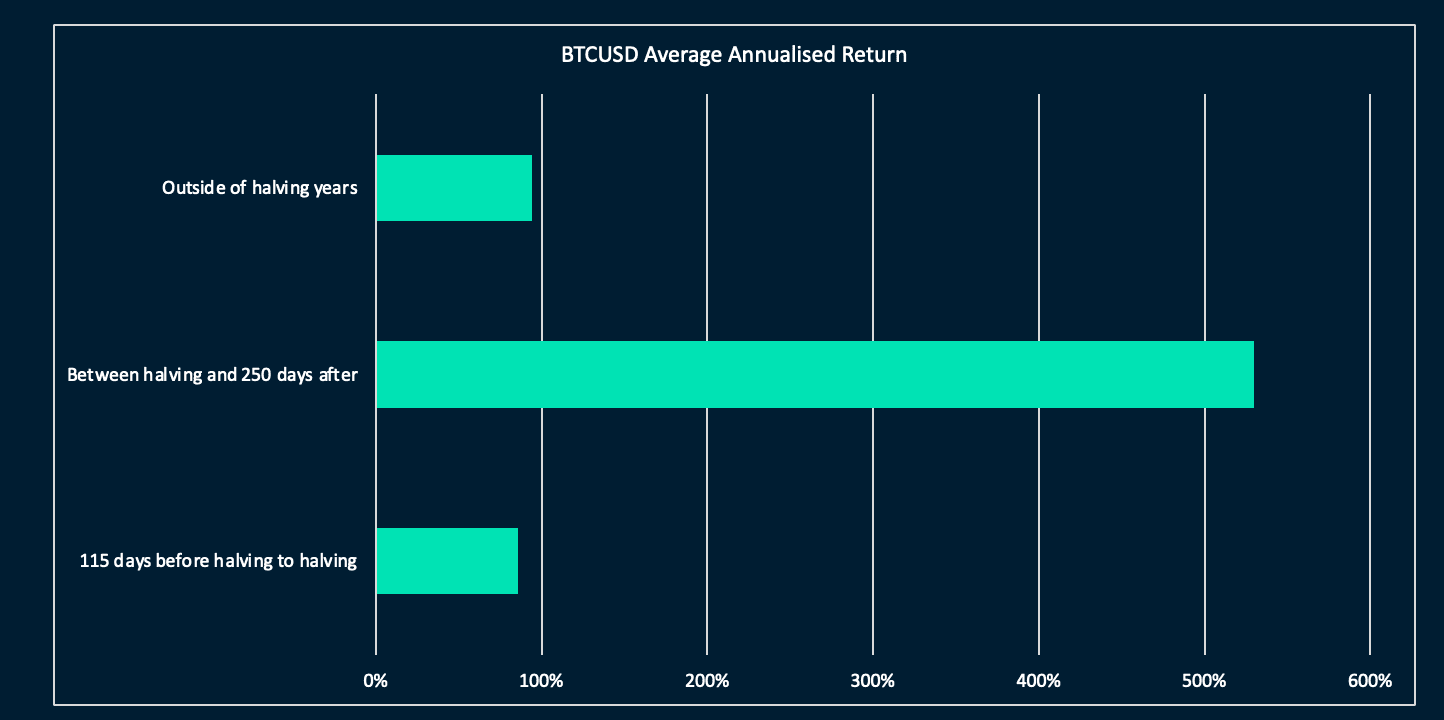
We would also add that the post-having has historically not been a bearish time for BTC prices, quite the contrary. As shown below, post-halving returns are 5 to 6 times superior to BTC returns during non-halving years. It is also worth highlighting that all bear market sell-offs have occurred outside of halving years, so far.
Tokens Ranking
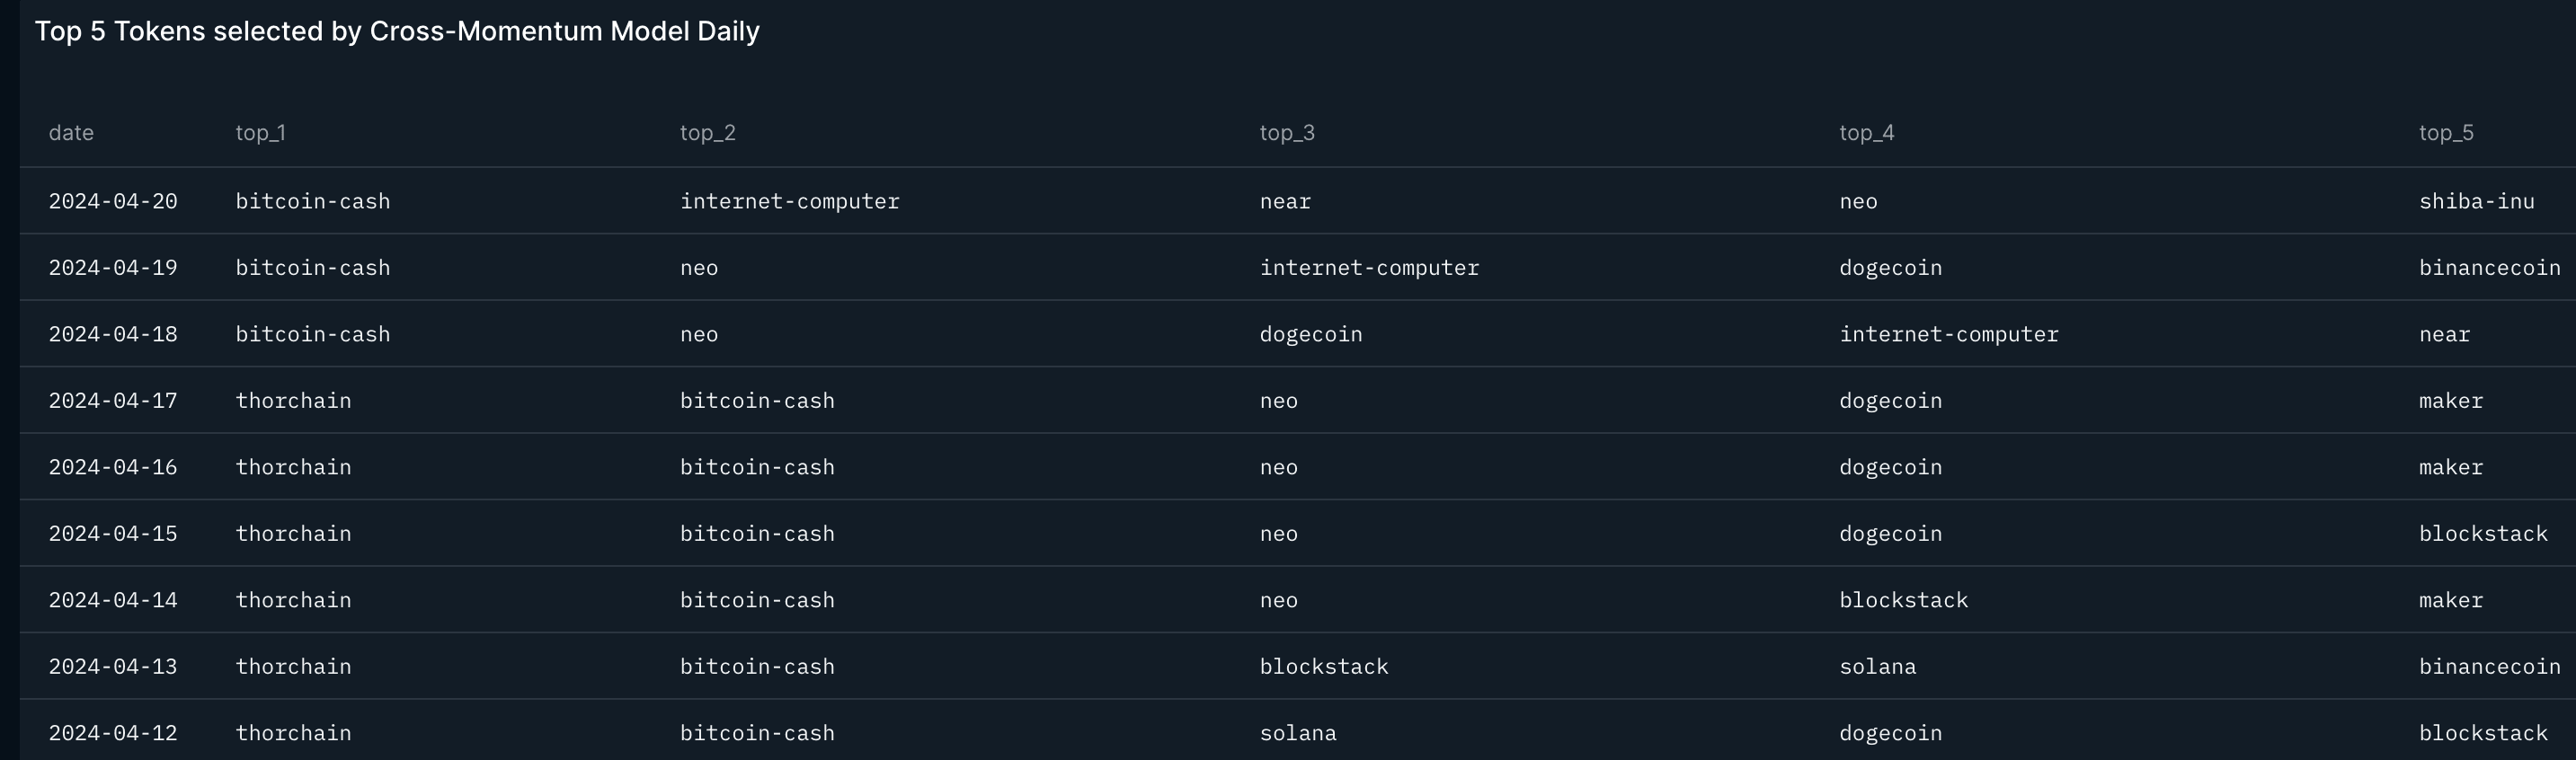
Moving away from risk-on/ risk-off considerations, this is the latest ranking by our Cross-Token Momentum signal, see here.
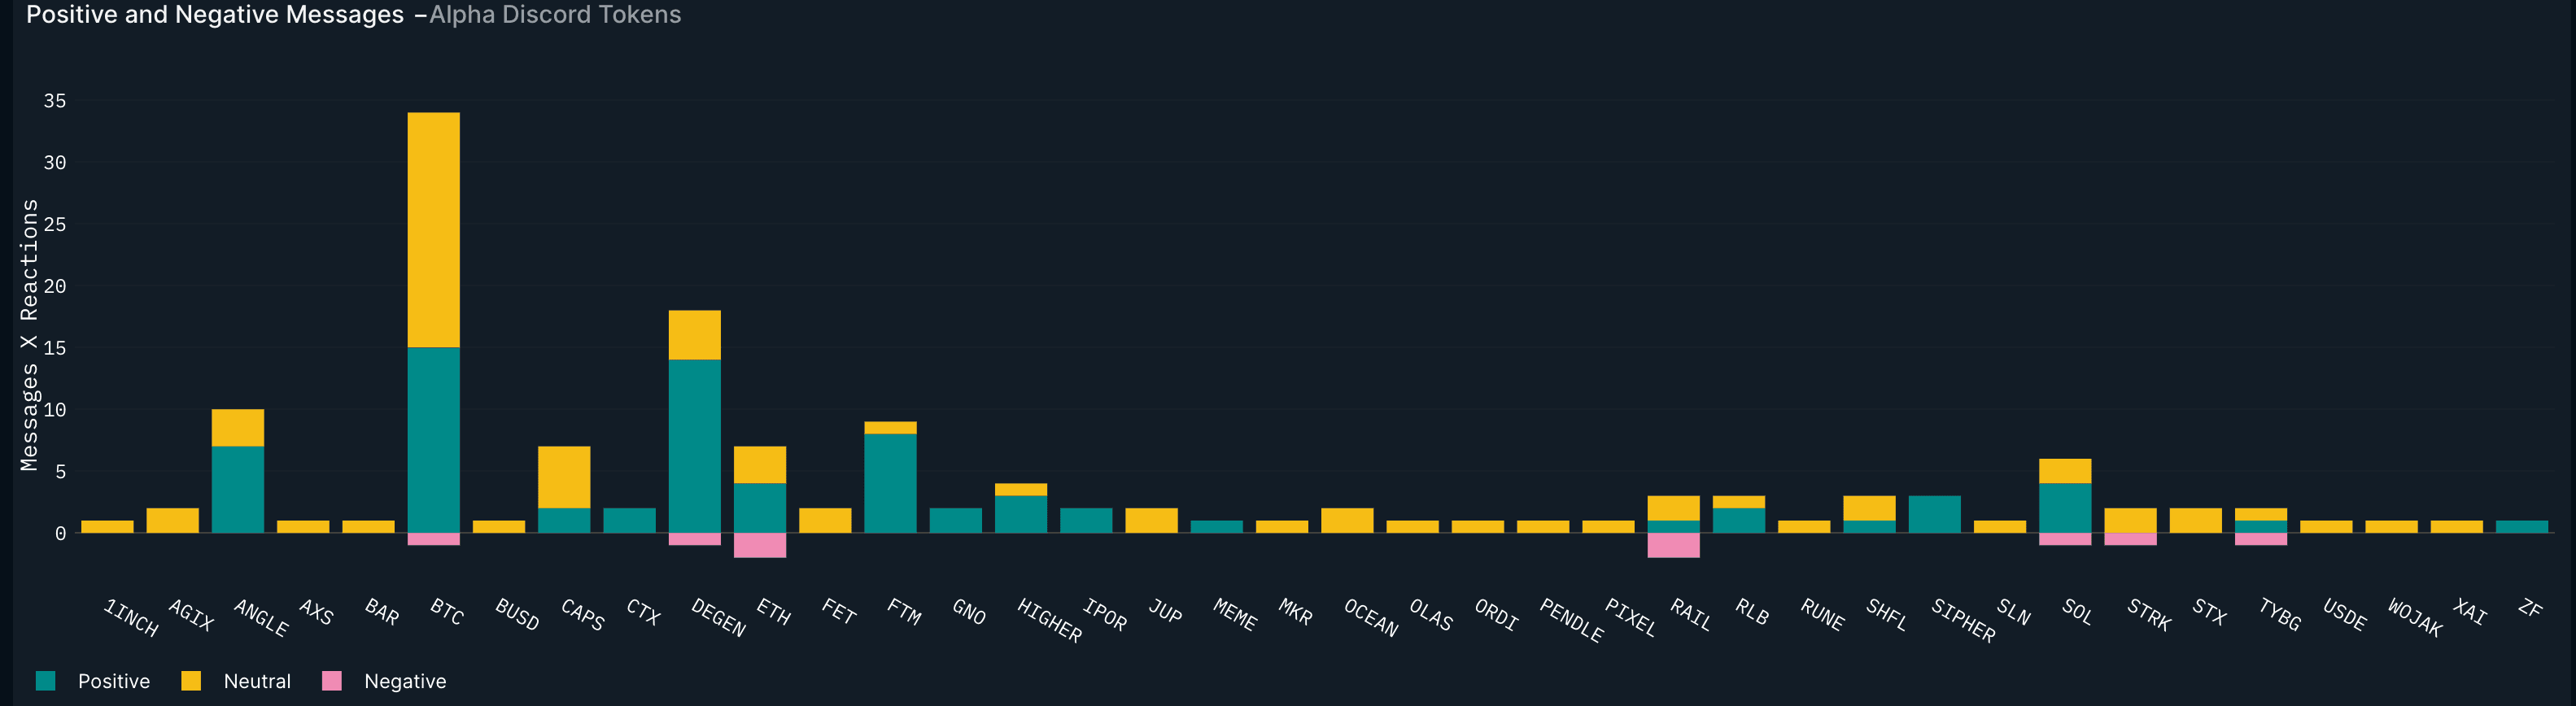
BTC, DEGEN, ANGLE, and FTM have dominated Alpha Discord positive and neutral mentions in the last 7 days. See Alpha Dashboard and initiation note.
This week’s calendar: What to pay attention to
The flash PMIs will be released (US PMI on Tuesday 23), as well as the (less market-moving in our view) US core PCE (consensus 2.6% YoY/ 0.3% MoM, Friday 26), and US Q1 GDP (Thursday 25). The Bank of Japan meets on Thursday. Q1 earnings reporting continues.
This week on-chain
Retail Users
Time and time again, market participants are actively trying to answer some variation of the question, "Where are retail users?”. Using our attribution coverage, we attempt to create our own definition of what a retail user looks like, defined by their onchain footprint. Below are our criteria:
- First incoming transfer on day X
- Not a smart contract
- Not belonging to a known entity
- The first interaction is with a smart contract within 3 days (it is unlikely a new retail user would e.g. immediately bridge or know what a bridge is, but instead just directly go to the chain, particularly with direct chain onboarding from CEX)
- Funded by a centralized exchange with less than $100k worth of tokens [ETH and ERC-20s]
After these filters are applied, we are left with our "retail users" and can map out the three views:
- Weekly Funding (USD)
- Weekly Retail Count
- Weekly Average Funding (USD)
We show retail flows for a multichain world but we only highlight the following chains: Ethereum, Arbitrum, Base, and Optimism.
Weekly Retail Funding [USD]
This shows the total funding (USD) to our retail segments in a weekly snapshot. In other words, we visualize our answer to the age-old question “How much new money is coming into a given ecosystem from retail?”.
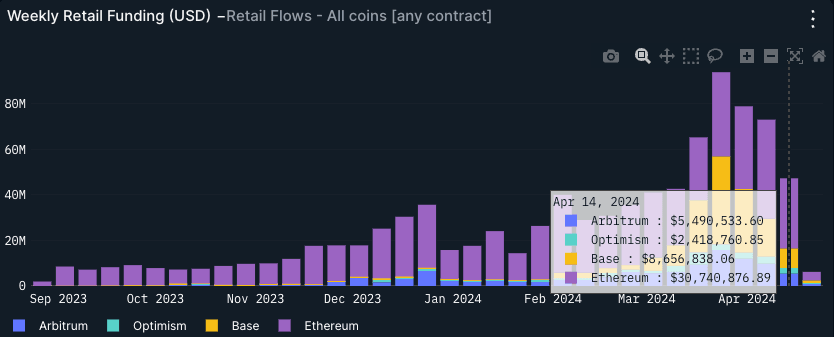
When looking at aggregate USD funding, Ethereum remains king as the main entry point for onboarding but since December 2023, we have seen L2s increasingly eat into Ethereum’s market share. For instance, in the 3rd week of March, Base surpassed Ethereum! This just shows total USD funding, but what about the number of retail wallets? Hint, the L2 vision is exceedingly playing out.
Weekly New Retail Participants
This view purely looks at the wallet count of freshly onboarded retail users as defined previously, showing a different angle outside of just USD funding.
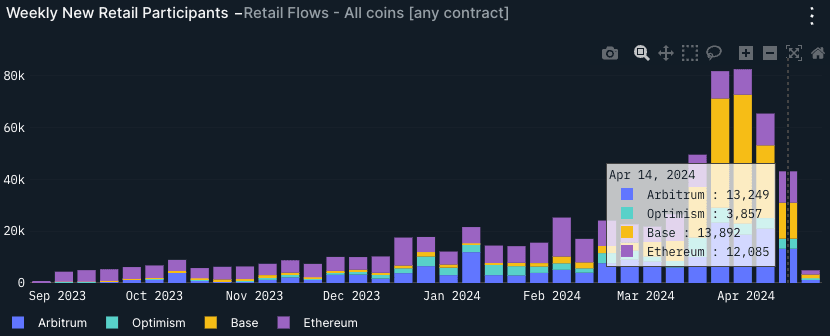
Across this metric, L2s have become the main entry point for retail onboarding onchain. In fact, L2s have accounted for onboarding more retail users than Ethereum for all of 2024, besides 2 weeks where Ethereum outpaced them. In more concrete terms, 2024 has marked the start of a strong trend where L2s are onboarding more users than ever and becoming the main entry point in 2024.
Weekly Retail Average Funding (USD)
For this view, we try to get a better understanding of the relationship between the number of new retail users and their USD funding. We simply look at the average funding on a weekly snapshot.
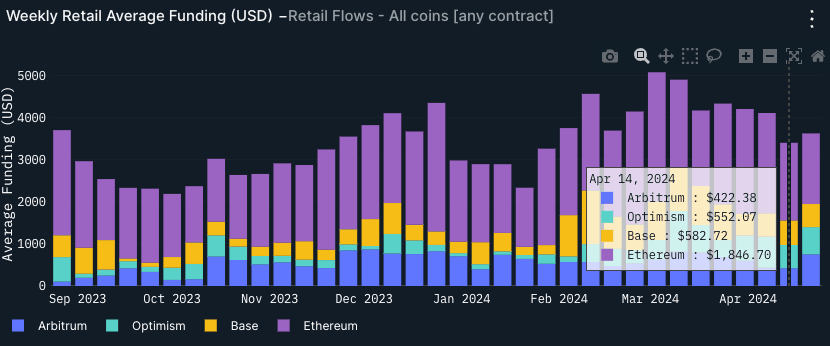
To no surprise, Ethereum’s average funding is more than 3x that of a typical L2. As of the week on April 14, the average funding in USD was $1846, compared to a distant 2nd of Base at $582. This shows that smaller retail balances favor L2s whereas slightly larger addresses (in USD) continue to onboard Ethereum mainnet.
Last but not least, we visualize the number of retail participants entering the market across the 4 chains against the ETH price.
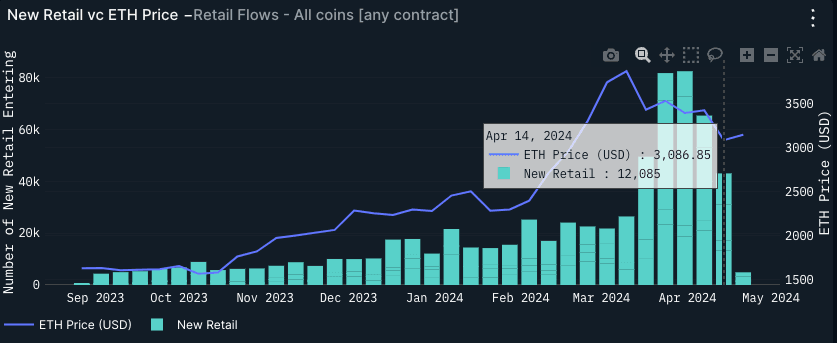
Given the weekly counts are lagging by a week, we can see that peak retail coincides with mid to end of March. Broadly speaking, crypto markets started to correct around the same time, particularly altcoins and speculative memecoins to the downside.
What are ETH Whales Doing?
Market participants usually want to know what ETH whales are doing onchain but historically, these types of metrics have been clouded by exchange wallets, entities, and other such wallets that would create a lot of noise when deep-diving into this nuanced question.
To surface the signal, we narrowed our results to just Externally Owned Accounts (EOAs). To do this, we filtered out most contracts, exchanges, MEV bots, NFT wash traders, and any wallets belonging to an entity as labeled by Nansen (with the exception of public figures: we would not want to miss Vitalik’s on-chain activity for example!). Additionally, we enhanced the ETH whale definition to be multichain. ETH on Ethereum, Arbitrum, Optimism, Linea, Base, and Polygon is used to create our segments. Thus, we get a truly crosschain view of ETH whales given ETH is continually bridged over to L2s.
Finally, we get our whales by looking at wallets that hold 1,000 ETH or more.
2024 Chain Preference
Using outgoing transactions as our measure of daily activity, we can view ETH whale activity across most EVM chains below.
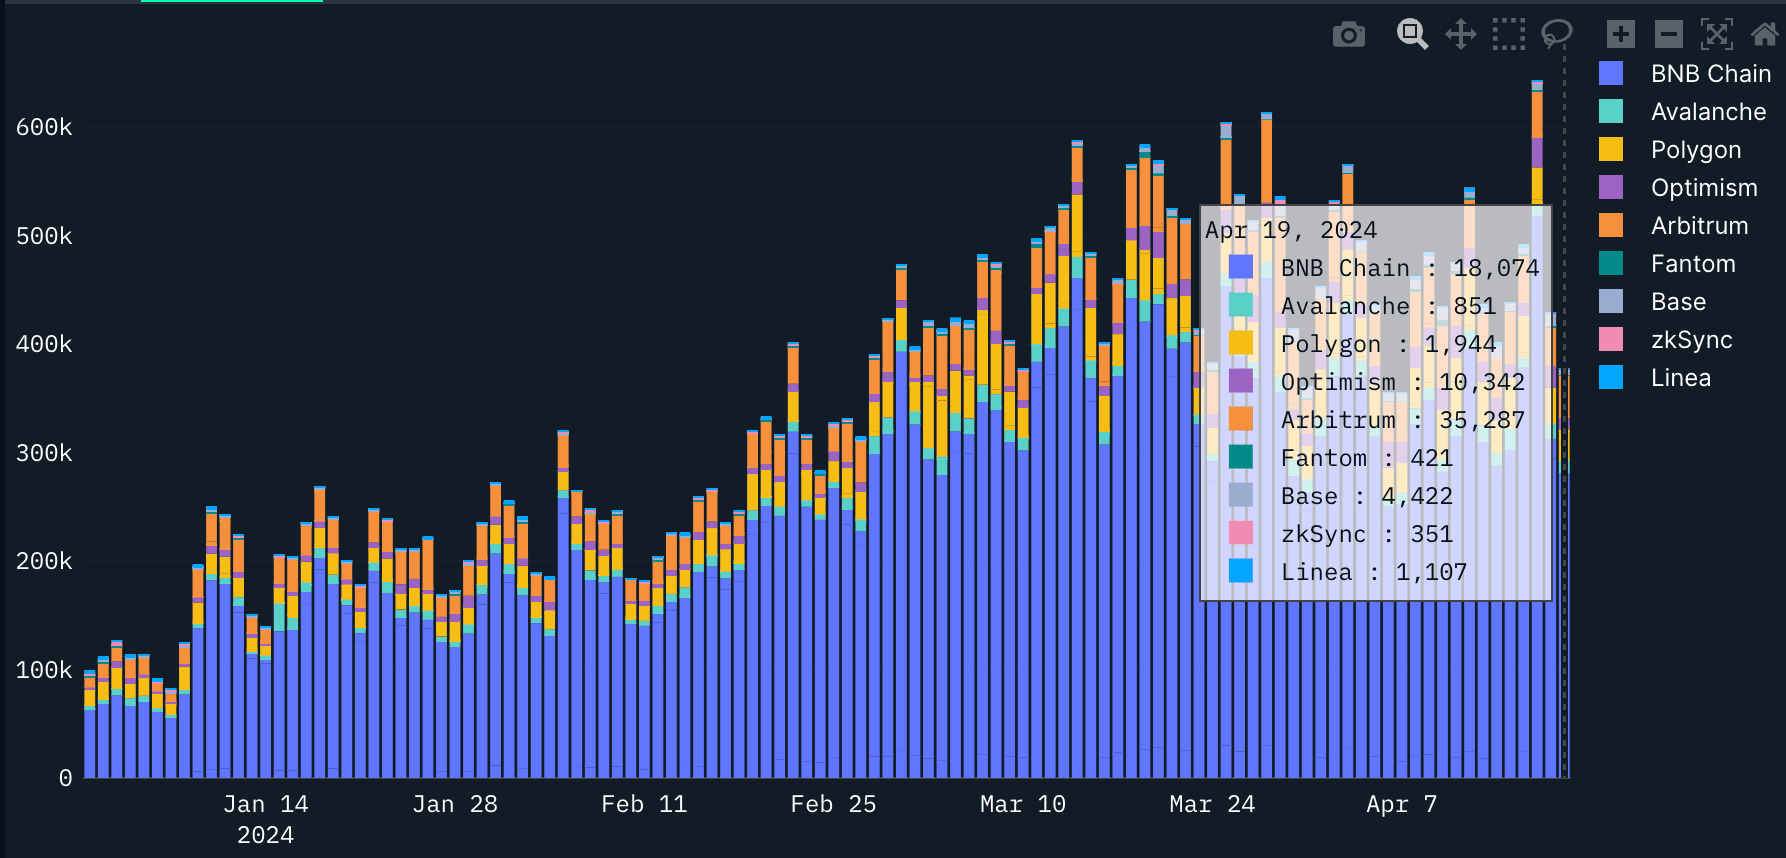
BNB Chain has been quite dominant in 2024, followed by Arbitrum, Optimism, Base and Polygon. ETH whales are quite chain-agnostic in 2024, enjoying a multichain lifestyle as indicated by their transaction activity.
Liquid Staking and Restaking
Liquid staking has grown exponentially since the launch of Lido. As of recent, Eigenlayer has kicked off a similar adoption curve for liquid restaking tokens. To see the adoption of these ETH derivatives, we mapped out the top 15 LSTs/LRTs by market cap and calculated the balances of their native ETH portfolio vs their LST and LRT portfolio.
As for limitations, the crosschain balances do not account for depegs against native ETH. The limitations on the analysis include the many canonical representations of the same token not being included (i.e lending wrapped tokens such as awsteth), LPs (i.e Pendle), limited number of LSTs/LRTS( i.e only used top 15 by market cap) and thus, the figures below likely underestimate the actual LST/LRT exposure these whales have today.
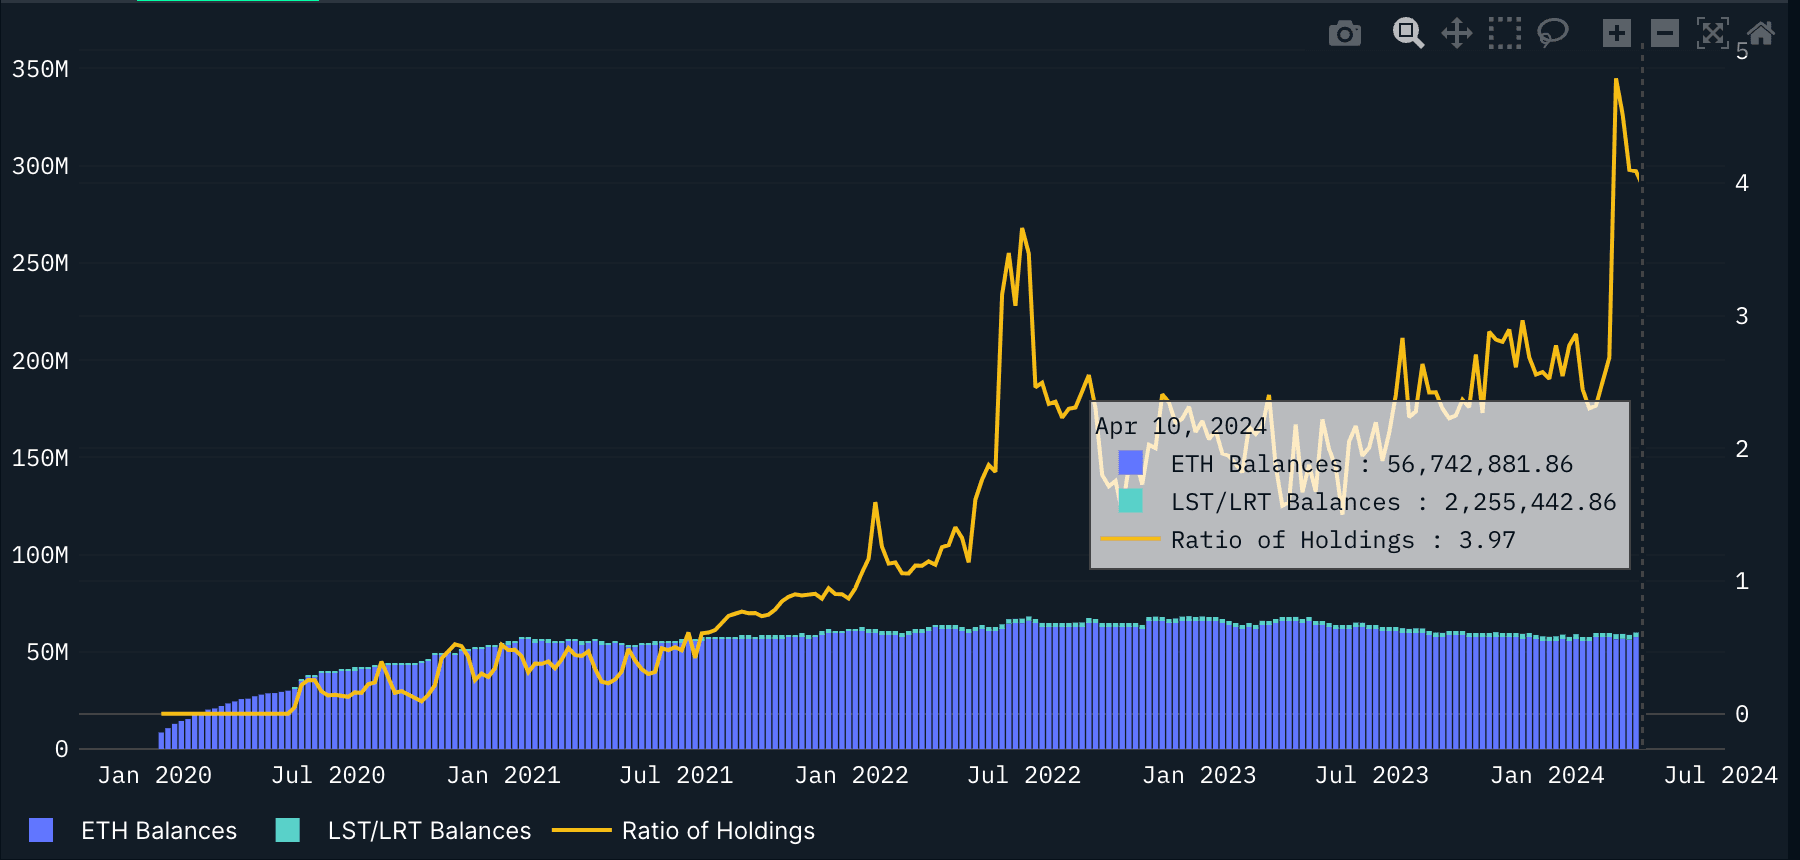
ETH Whales have increasingly positioned for LST/LRTs, with a very notable uptick starting from February 21st, 2024 onward. From this snapshot alone, albeit there are missing balances as noted above, ETH whales’ LST/LRT exposure is nearing 4% of their native ETH holdings and continues to trend upwards.