It has been two months since the Arbitrum airdrop. In this note, we analyze the fundamentals of the Arbitrum blockchain and its usage thus far to gain insights into the state of Arbitrum's ecosystem following the airdrop.
The charts in this note are available on Nansen Query here.
Macro Insights
User and Transaction Count
Starting with a macro overview, we look at the number of daily users and transactions on Arbitrum. We also chart Ethereum and Optimism as benchmarks.
Figure 1: Daily Active Users of Arbitrum, Ethereum and Optimism (past 6 months)
We witnessed a record-breaking number of users and transactions due to the airdrop on March 23, 2023. What's even more intriguing is that after the airdrop, both the unique user and transaction counts have consistently remained high and often comparable to those on Ethereum, occasionally surpassing Ethereum.
Gas fees and on-chain value
We have established that user and transaction activity has remained high, even after the airdrop. We now examine the value received and sent on Arbitrum as well as the chain’s ability to attract new wallets. Specifically, we analyze:
- Gas fees or how much wallets are paying to use the chain
- The USD value of transactions and transfers
- New Entrants and bridging flows to assess whether new wallets entering the ecosystem
Gas spending on Arbitrum has been on the rise, consistently maintaining higher levels compared to pre-airdrop. In the past 6 months, a total of 17k ETH has been utilized for transaction fees on Arbitrum, with approximately 71% of this amount attributed to Layer 1 (Ethereum).
It remains to be seen whether this ongoing trend will persist in the months to come. The Arbitrum Foundation recently shared a tweet that outlines the origin of revenues and their distribution among sequencers, validators, and the DAO.
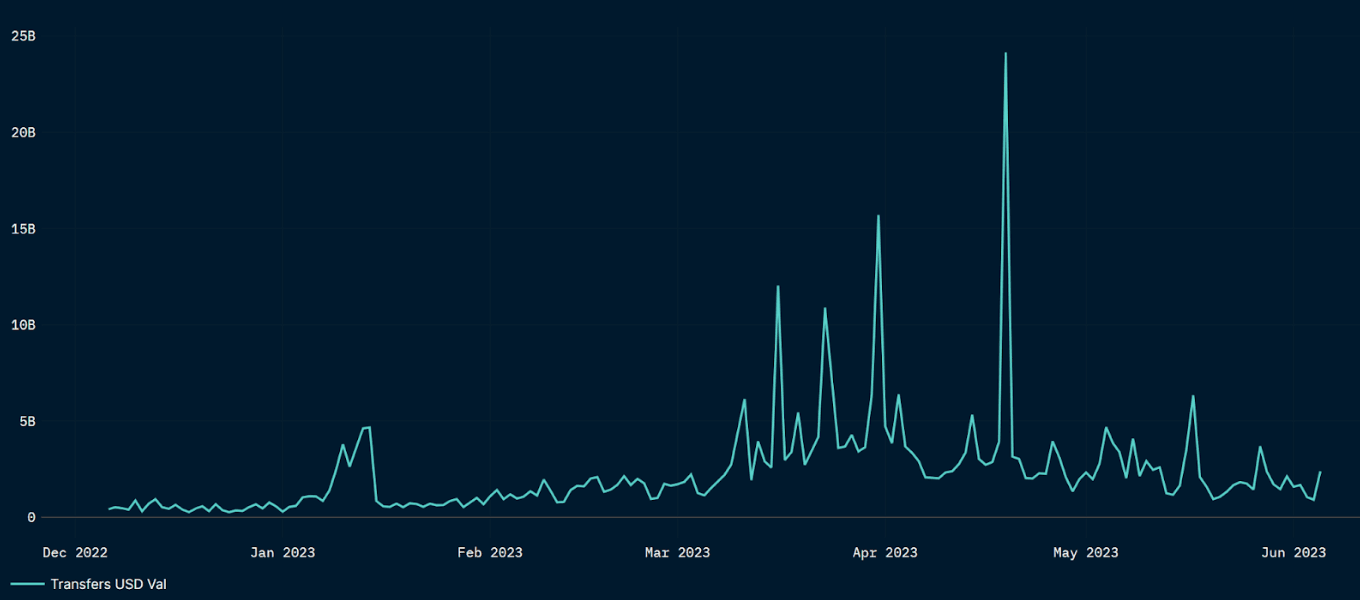
The charts above provide an estimation of the value being transacted on Arbitrum One. We notice a similar pattern of decline immediately after the airdrop, but the value being transacted still remains at levels higher than the average before the airdrop.
New Wallets and Liquidity
The rates of new wallet activity and liquidity influx into the ecosystem serve as additional data points. The figure below illustrates the number of wallets initiating their first-ever transactions on Arbitrum, which is a proxy for the rate at which new users are entering the ecosystem.
ElseWe saw an "all-time high" in new wallets on Arbitrum on March 24, 2023, a day after the token airdrop became claimable. The number of new users has consistently remained at higher levels after the airdrop, surpassing Optimism and closely approaching Ethereum.
Shifting our focus to bridging activity from Ethereum, we notice that the overall bridging volume to Arbitrum, compared to other Layer-2s and Layer-1s, has remained relatively stable. The share of bridging activity on Arbitrum, similar to the other metrics we have analyzed, reached its peak in March but currently ranks second, trailing behind Polygon. Notably, smaller entities such as Starkware, zkSync, PulseChain, and Across have gained noticeable market share from March to May.
ARB Token Delegation and Recipient’s Activity
This section focuses on the delegation of ARB tokens and airdrop recipient’s on-chain activity. ARB serves as a governance token, empowering holders with influence over the ecosystem's future. This influence ranges from advocating for increased transparency to proposing changes to the Arbitrum constitution.
Delegation dynamics
ARB token holders can delegate the voting power of their tokens to other wallets. Delegation enables token holders that might not have the time to keep up with various proposals to indirectly facilitate the Arbitrum DAO’s governance, by transferring their rights to a token “delegate” who will vote in their place.
We analyze the current delegation breakdown by looking at the delegates and their respective voting power.
Figure: Delegates’ overview, by number of wallets having delegated to them (x-axis) and number of tokens delegated (y-axis), with bubble size = delegates’ ARB voting power
We find that ~200k distinct wallets chose to delegate their voting rights to another ~16k distinct wallets.
In the chart above, five wallets stand out by their significant bubble sizes (balance of ARB available for voting) and the large number of other wallets having delegated their rights to them. The five largest wallets in terms of voting power belong respectively to Treasure, delegate.l2beat.eth, olimpio.eth, PlutusDAO, and Griff Green.
Altogether, these five addresses hold ~49.7% of Arbitrum voting Quorum, which represents a significant governance power. Each of these five addresses can put forward an Arbitrum Investment Proposal (threshold = 5 million ARB delegated). Also, collectively, these addresses can move the needle on a vote: “
More Votable Tokens have casted votes in favor than have casted votes against"
is the first threshold for a proposal to be passed (see Arbitrum DAO’s Constitution here
The Constitution of the Arbitrum DAO | Arbitrum DAO - Governance docs).
Figure: Top 5 Delegates’ ARB Voting Power Over Time
Airdrop recipients’ on-chain behavior
In this final analysis, we track the activity of wallets having retained their ARB tokens after the airdrop’s claim. We benchmark Arbitrum vs Optimism, the latter having also gone through an airdrop operation prior to Arbitrum (in May 2022 for the first Airdrop).
Figure: Breakdown of Transactions by Airdrop and Non-Airdrop Recipients in % (Arbitrum)
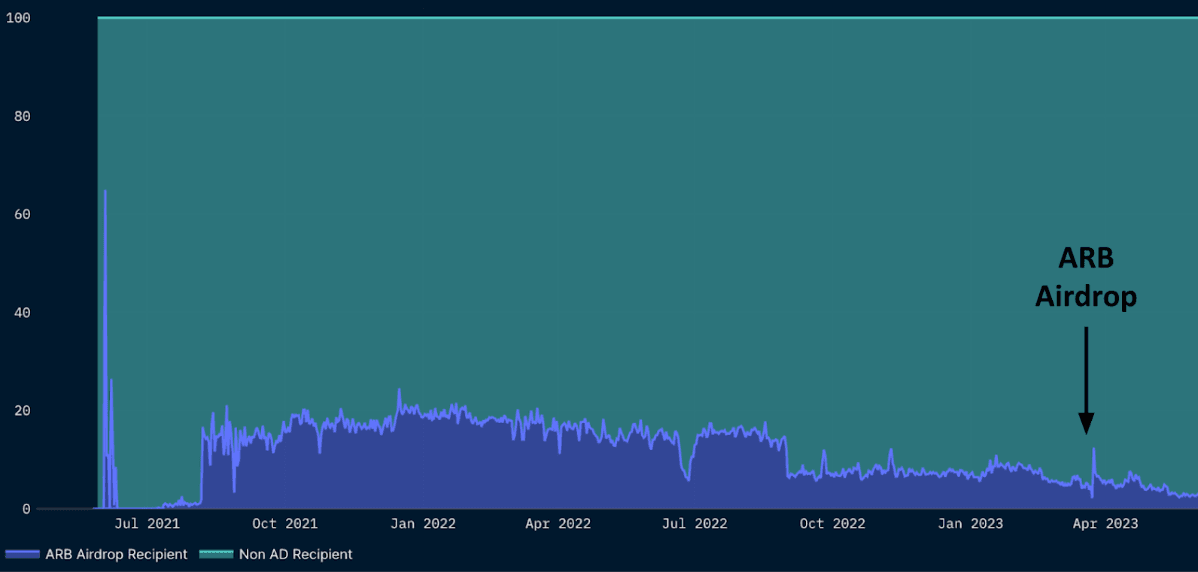
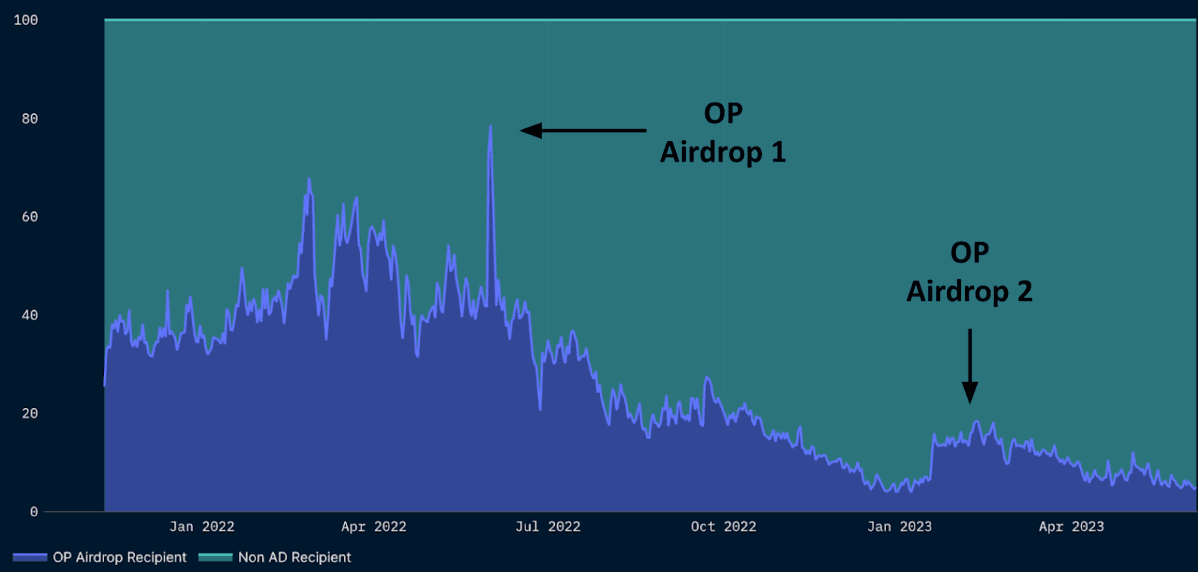
Figure: Breakdown of Transactions by Airdrop and Non-Airdrop Recipients in % (Optimism)
We note that, in the case of Arbitrum, the ARB airdrop recipients represented between 5% and 20% of transactions before March 2023. After the airdrop became claimable, this ratio came down to ~5%.
For Optimism, we observe the same decline post OP-airdrop-1 (31 May 2022): the OP airdrop recipients represented 30% to 65% of transactions pre-airdrop. This ratio steadily declined after May 2022, to hover around ~6% today.
The review of Arbitrum's on-chain metrics over the past six months reveals some compelling insights. The number of daily active users, transaction count and on-chain value all seem to have stabilized at a level higher than before the airdrop. The upward trends in gas fee spending, and creation of new wallets, also indicate a growing use of the chain.
Although bridging activity to Arbitrum reached its peak in March, aligning with the airdrop claim date, the gross volume of Ethereum bridging to Arbitrum has continued to exhibit strength. Arbitrum has retained a significant share of the bridging volume, ranking second after Polygon.
Tracking the on-chain activity of airdrop recipients on Arbitrum reveals a comparable pattern to Optimism following its own airdrop, albeit to a lesser extent. The proportion of transactions originating from airdrop recipients has decreased after the airdrop for both chains. Currently, it accounts for approximately 5% to 6% of transactions on both Arbitrum and Optimism.
In essence, the data suggest that the Arbitrum network has experienced considerable growth and increased usage over the past six months, before and after the airdrop. As the ecosystem evolves, we will monitor these metrics to assess the future development and adoption of Arbitrum.


