Top 10 Virtual Land Breakdown
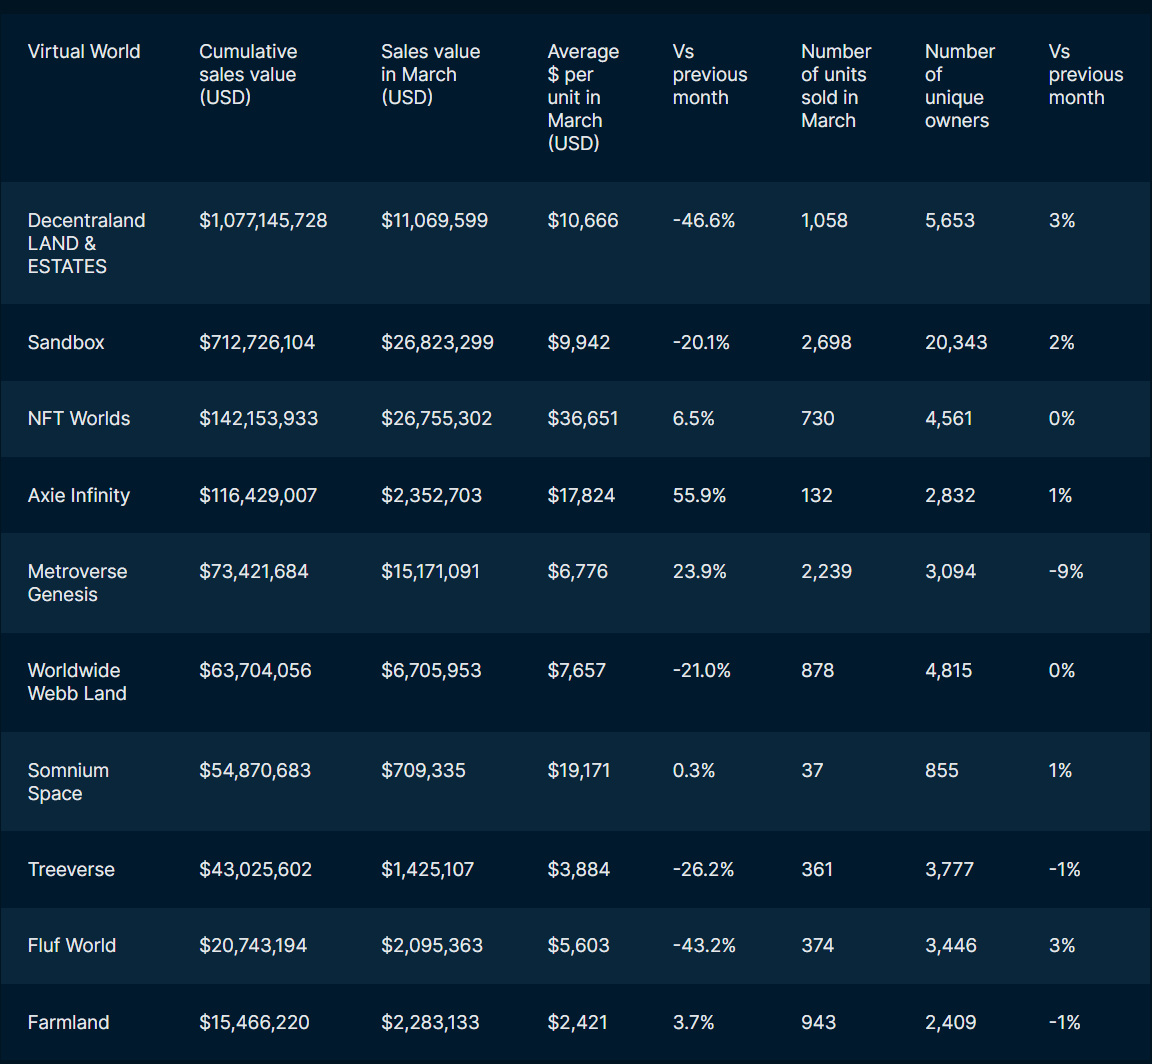
- By looking at the table above, it can be seen that Decentraland is the only virtual world that surpassed cumulative sales of more than $1 bn for its land sales. It is closely followed by Sandbox at around ~$700 mm, while NFT World is a distant third having accumulated sales of around ~$142 mm.
- Sandbox and NFT Worlds have dominated the sales over the last 30 days, each generating around ~$26m in sales.
- Metroverse came ahead of Decentraland by taking the third position with sales of ~$15m (around ~4m more than Decentraland) in March.
- Axie Infinity’s average price per unit over the last thirty days is up 55% vs the previous month, despite the Ronin hack which was detected on the 29th of March.
- The change in the number of owners in the top 10 virtual worlds ranged between -1% to +3% for almost all of them, with the exception of Metroverse Genesis. The number of owners in Metroverse decreased by 9% in comparison to February, suggesting that previous owners accumulated further in March.
- Younger virtual worlds performed better than older ones. The average price per unit for Decentraland and Sandbox was down -46.6% and 20.1% respectively, while NFT Worlds and Metroverse were up 6.5% and 23.9% in comparison to the previous month.
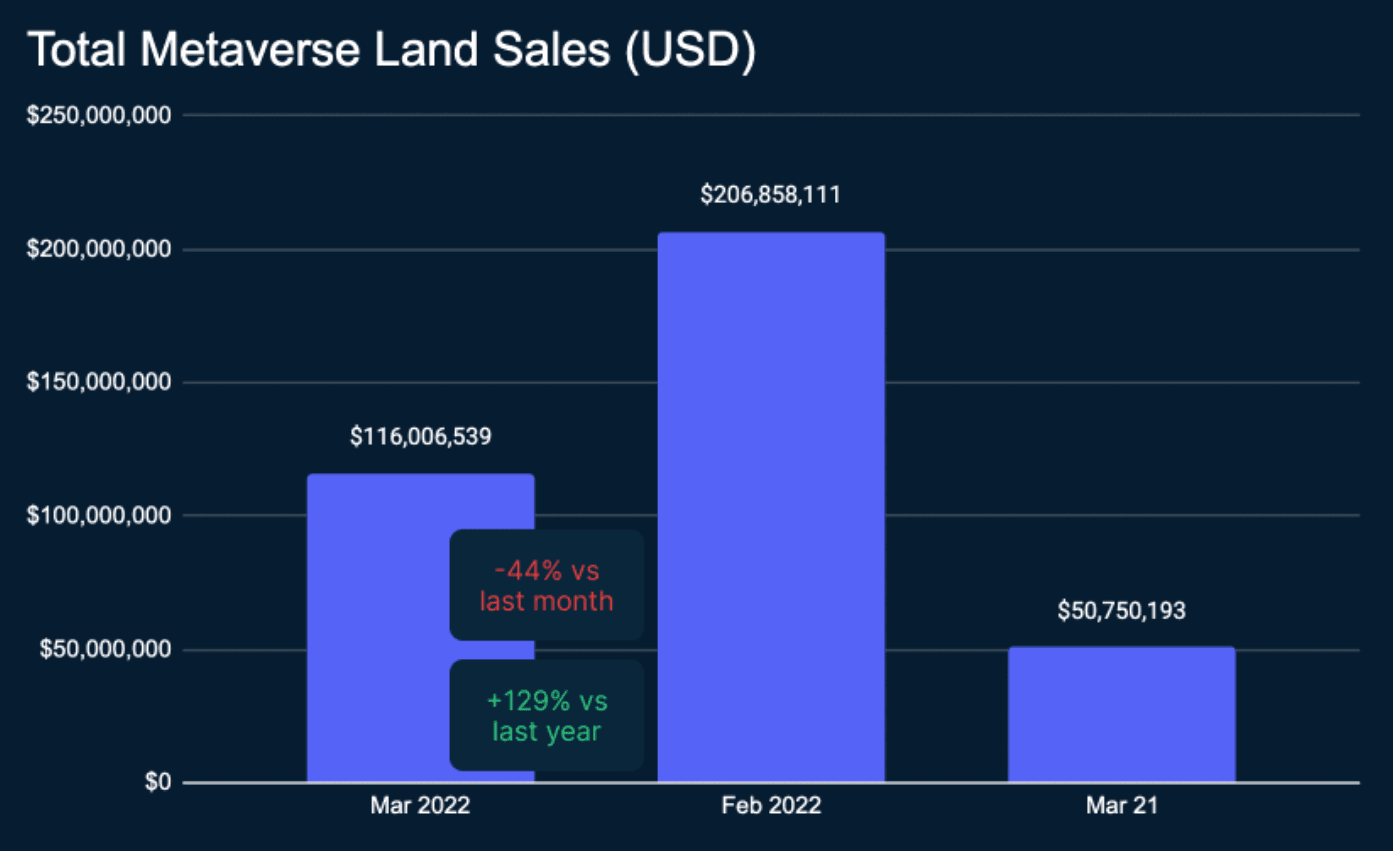
Total overall Sales in the virtual land sector have gone down by more than ~$90mm in the month of March to ~$116mm. This is a reduction of around 44% from the highs of February (~$206mm). However, this is still more than ~$65mm higher than what it was a year ago. This suggests that the overall market has been slowing down more recently. The level of activity in the market, however, is still way beyond what it was last year during the same period.
Virtual Land performance - new vs older project comparison
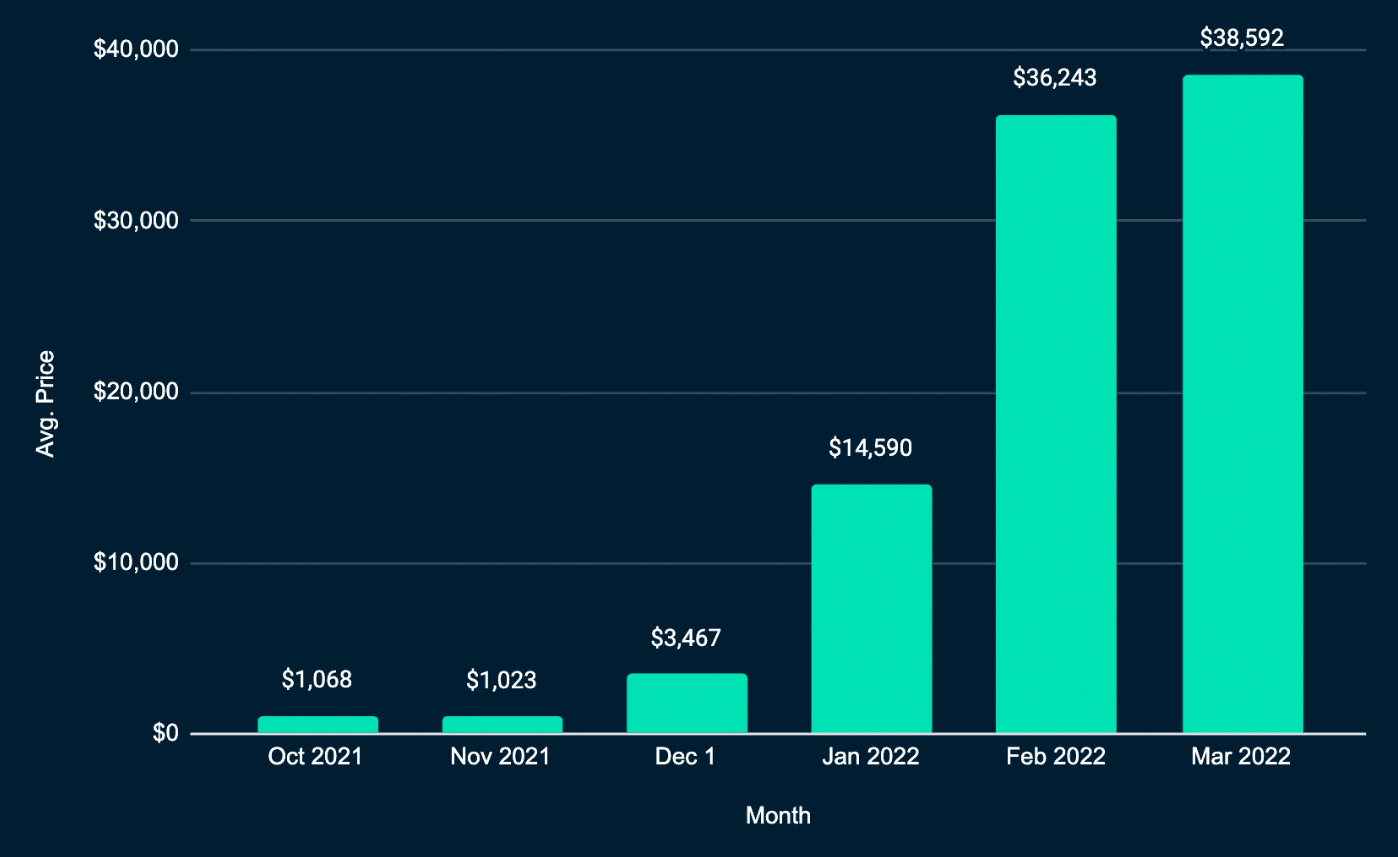
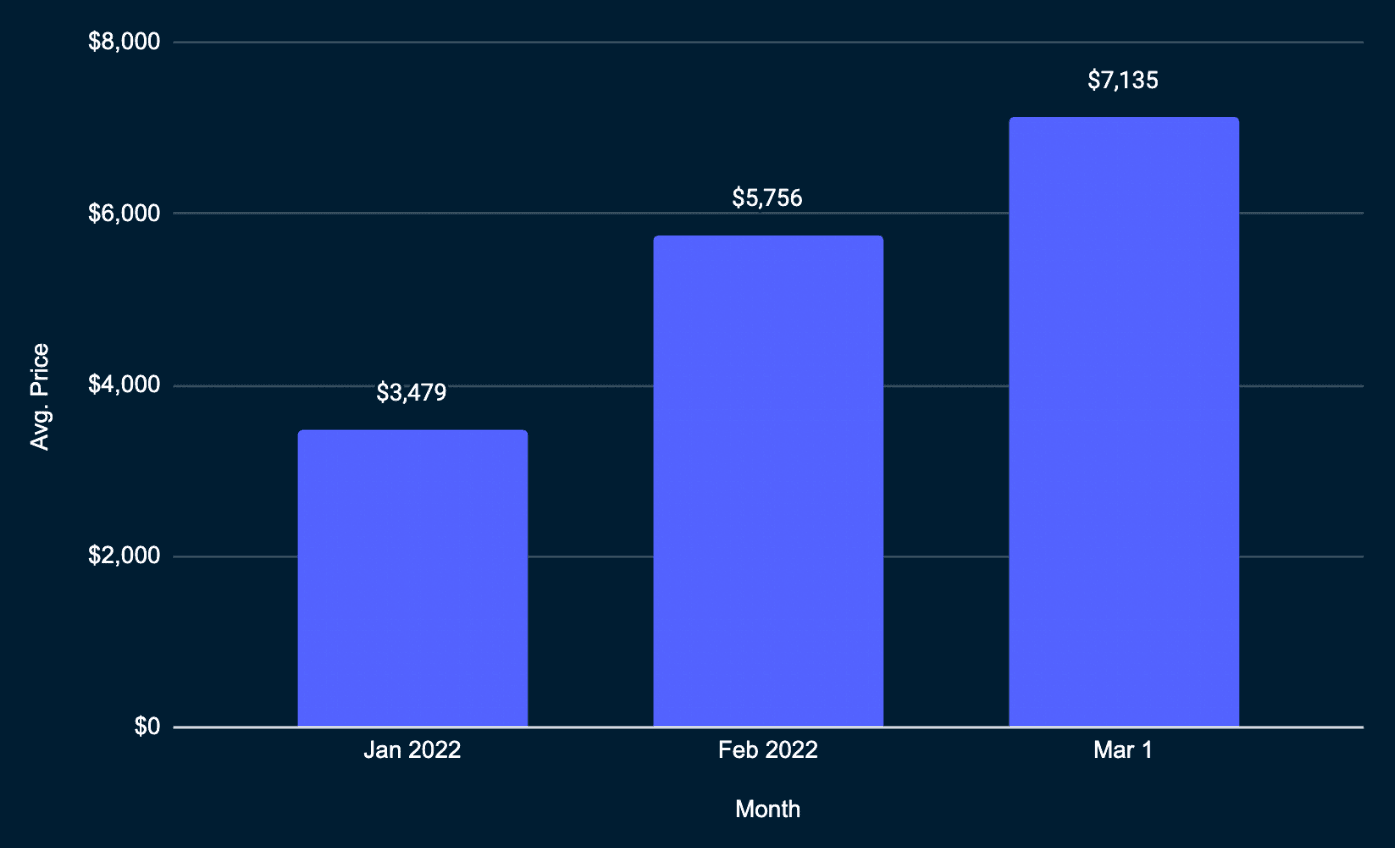
By analyzing NFT Worlds and Metroverse further, one can see that both have soared recently hitting average price all-time highs as shown on the charts below. The average price in both projects has been steadily growing, recording new highs every month over the last few months. The average price per month for NFT Worlds has risen by more than $37k since October 2021 hitting a new high of $38,592 in March. The average price for Metroverse has also more than doubled since the beginning of the year, jumping from $3.4k in January to over $7k by the end of March.
Additionally both projects allow staking of NFTs, which could also be an additional factor pushing the prices higher.
The tables above show that over 8,900 NFTs have already been staked in the NFT Worlds project. That’s out of a total of 10,000. Metroverse has also around 97% of its NFTs staked.
These numbers are of course a considerable amount of the total supply, so even a small number of new entrants can push the average price higher much more easily in comparison to a project without any staking mechanisms.
Looking at older and more famous virtual worlds however, we see the exact opposite.
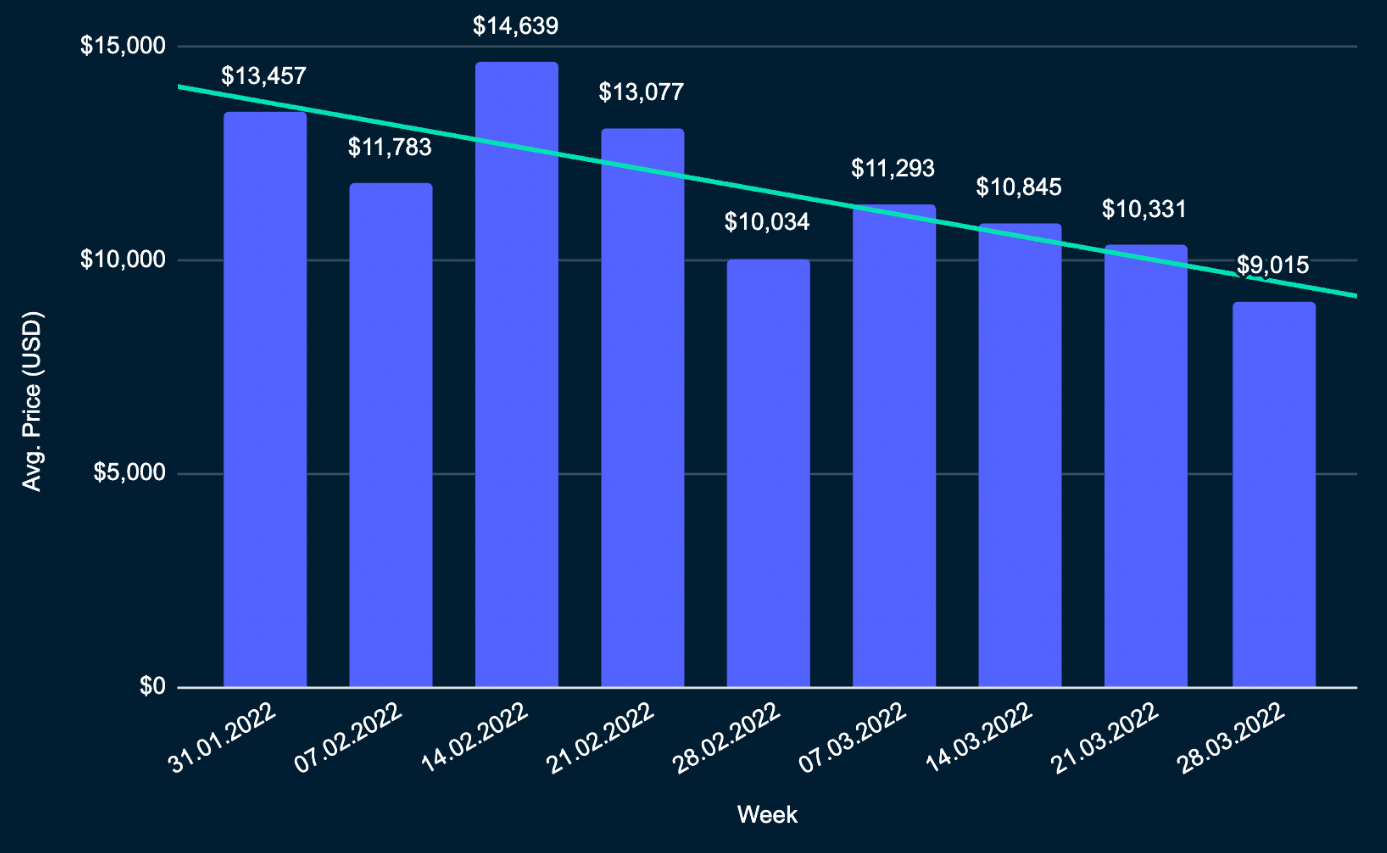
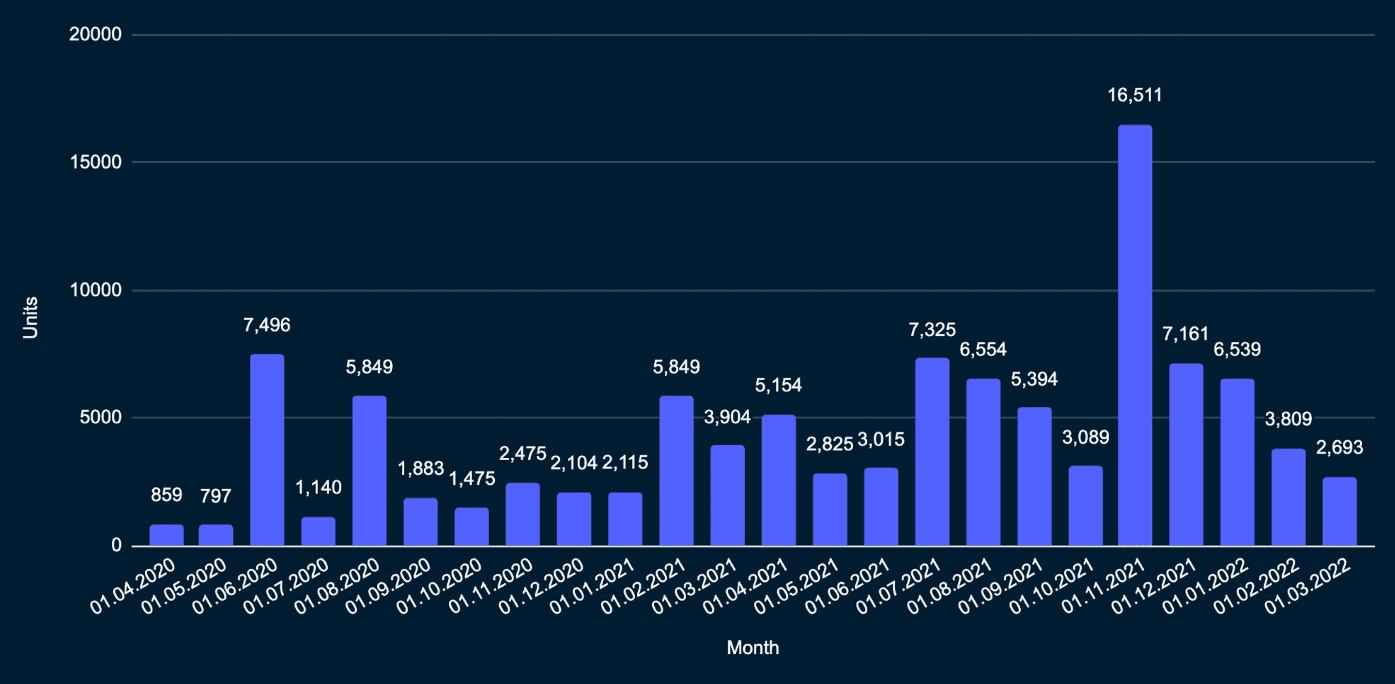
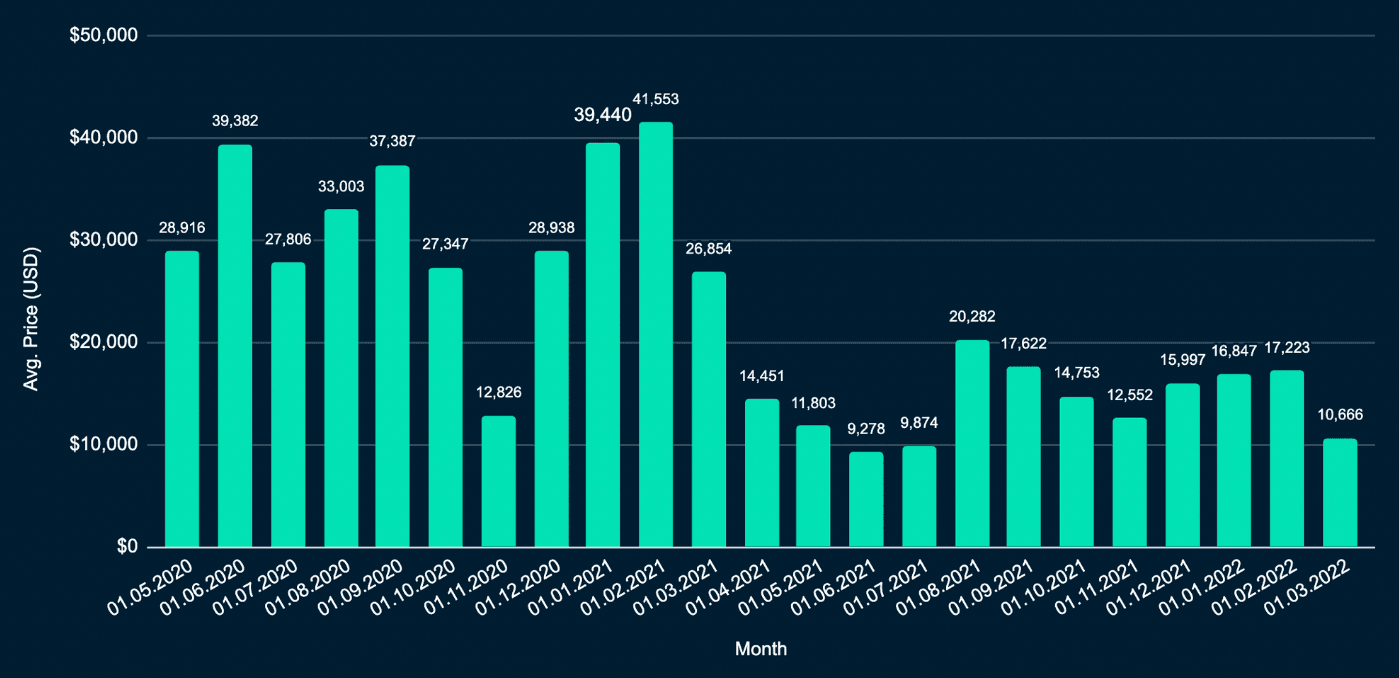
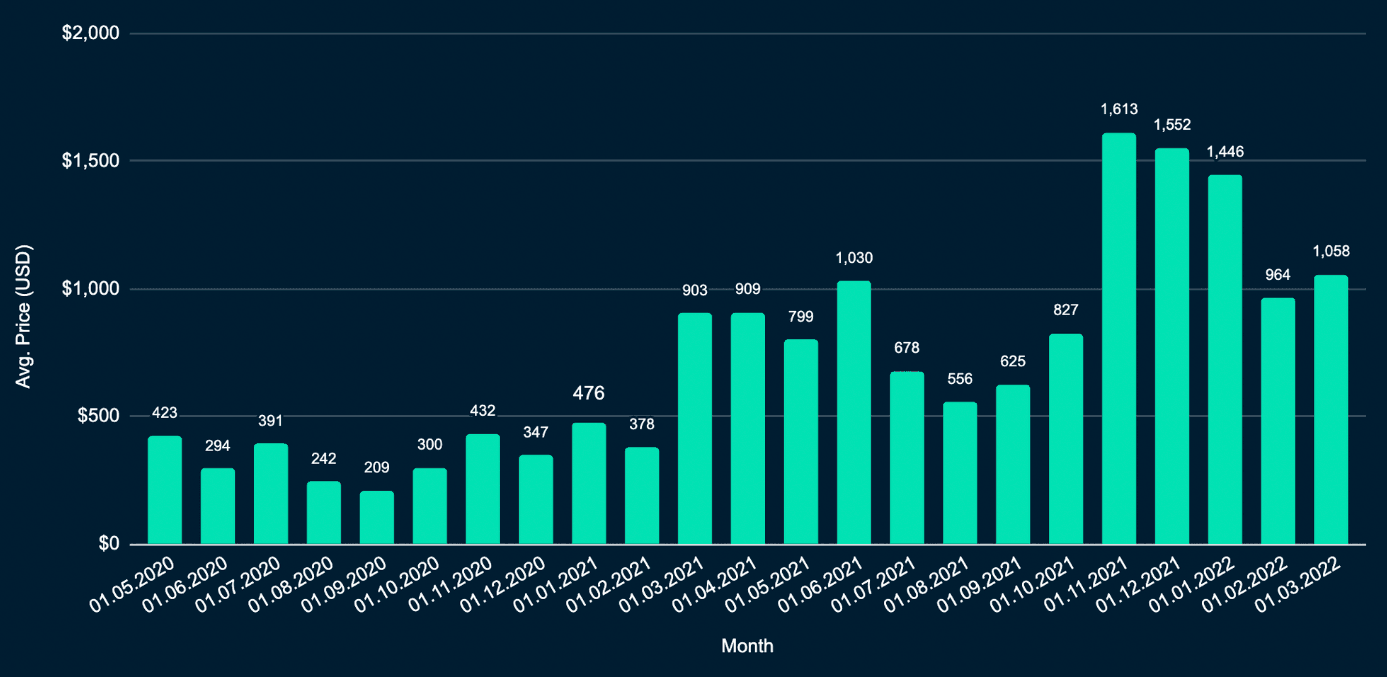
- It can be seen from the charts that the average price for both Decentraland and Sandbox has been falling over time
- Average price for Sandbox has hit a 20 week low reaching $9,015
- Average price for Decentraland has reached lower levels not seen since 8 months ago
- It can also be seen that back in November there was significant selling pressure for lands in both projects
- This coincides with the BTC price fall that started during that same month
- Despite the fact that the number of units sold per month for both projects has been gradually declining, the average price still continues to fall
Ownership concentration
Another interesting contrast between Decentraland and Metroverse is also the concentration of land ownership. Decentraland has the highest number of unique owners (owning a single plot of land) out of any virtual world, they account for more than 78% of all owners. Metroverse on the other hand has the lowest percentage of single land owners, amounting to around ~48%. It is important to note however, that this is possibly driven by the game mechanics which incentivize you to collect multiple city blocks and build neighborhoods.
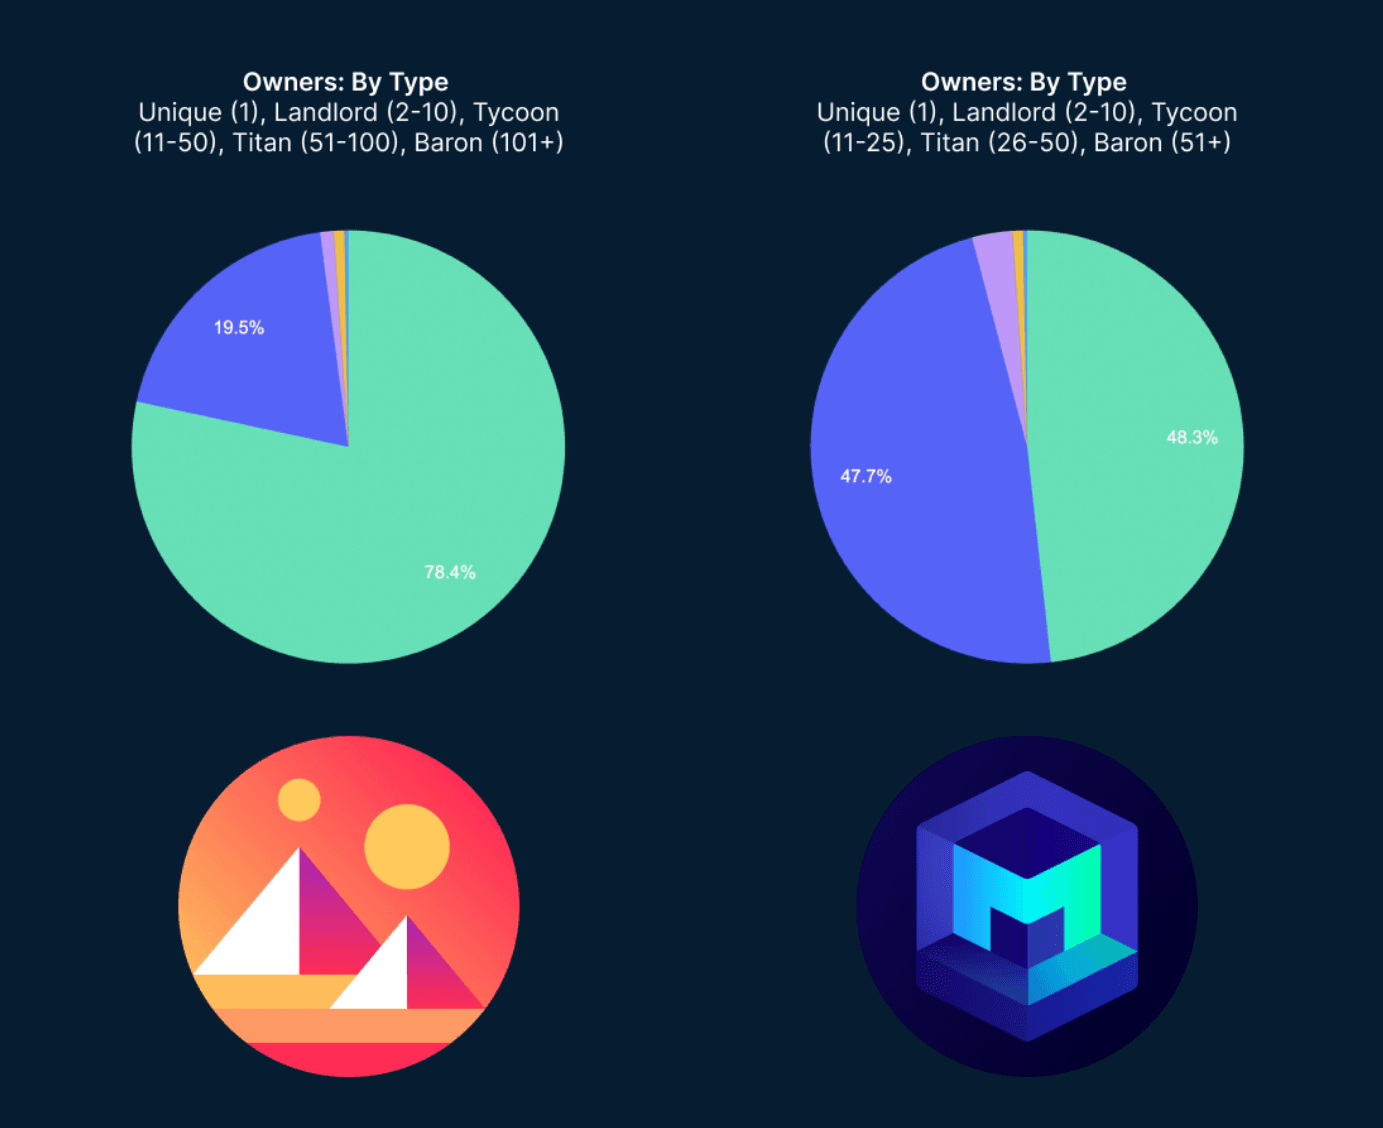
- Decentraland has 3,838 Unique (1 unit)owners; 953 Landlords (2-10 units); 61 Tycoons (11-50 units); 10 Titans (51-100 units) and 14 Barons (101+ units)
- Metroverse has 1,573 Unique (1 unit)owners; 1,580 Landlords (2-10 units); 111 Tycoons (11-50 units); 24 Titans (51-100 units) and 7 Barons (101+ units)
Ronin hack
- Ronin is an Ethereum side-chain used for Axie Infinity, one of the most popular crypto games.
- On the 23rd of March a hack which exploited over $600m occurred on the Ronin chain, which went undetected for 6 days.
- The team discovered the security breach on March 29th, after a report that a user was unable to withdraw 5k ETH from the bridge
- It was caused by a hacker securing private keys for 5 of the 9 Ronin validators, allowing them to drain funds from the bridge.
- The exploit resulted in the loss of 173,600 ETH and 25.5 million USDC.
- This hack became the largest DeFi exploit in history, roughly 1.86x as much as the Wormhole Bridge hack of $323m.
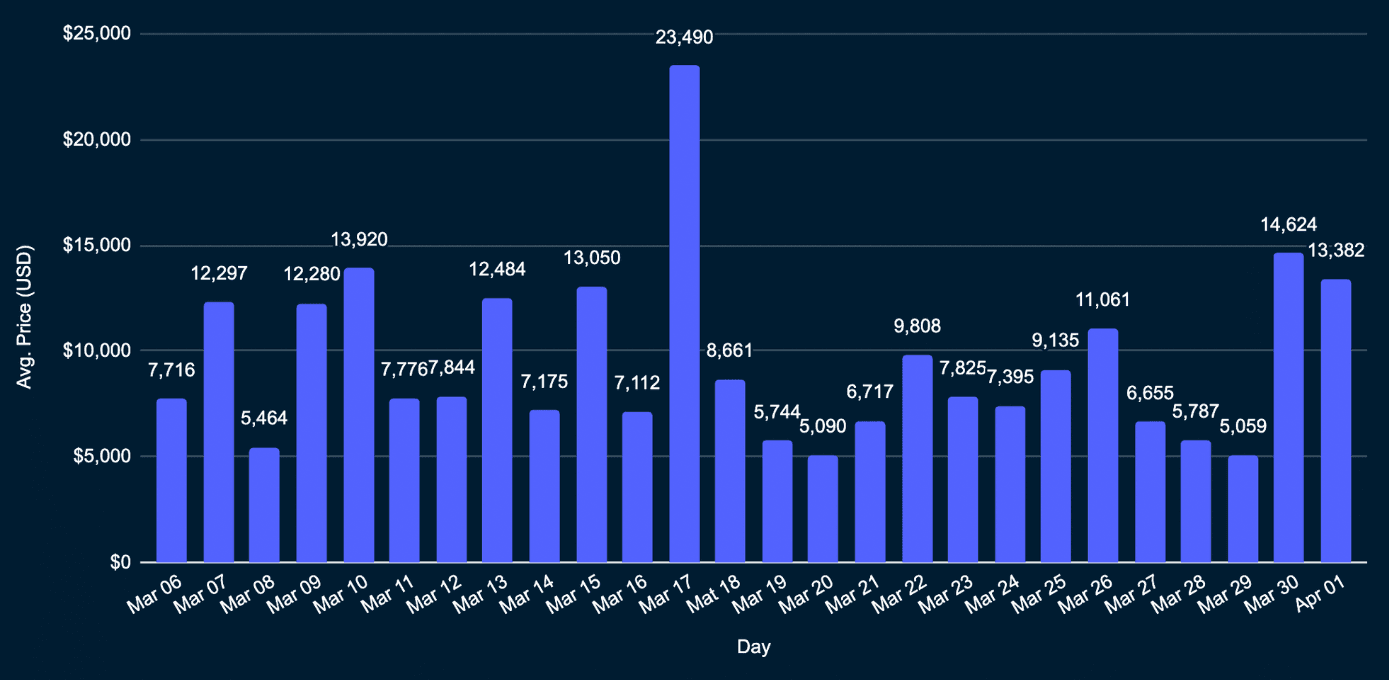
From the chart below it can be seen that the hack caused the price of LAND in Axie Infinity to record a daily low of $5,059 on the 29th of March, the day the hack was detected. Surprisingly , the average land price recovered swiftly in the next couple of days reaching a high of $14,624 (Mar 30th) and $13,382 (Mar 31st).
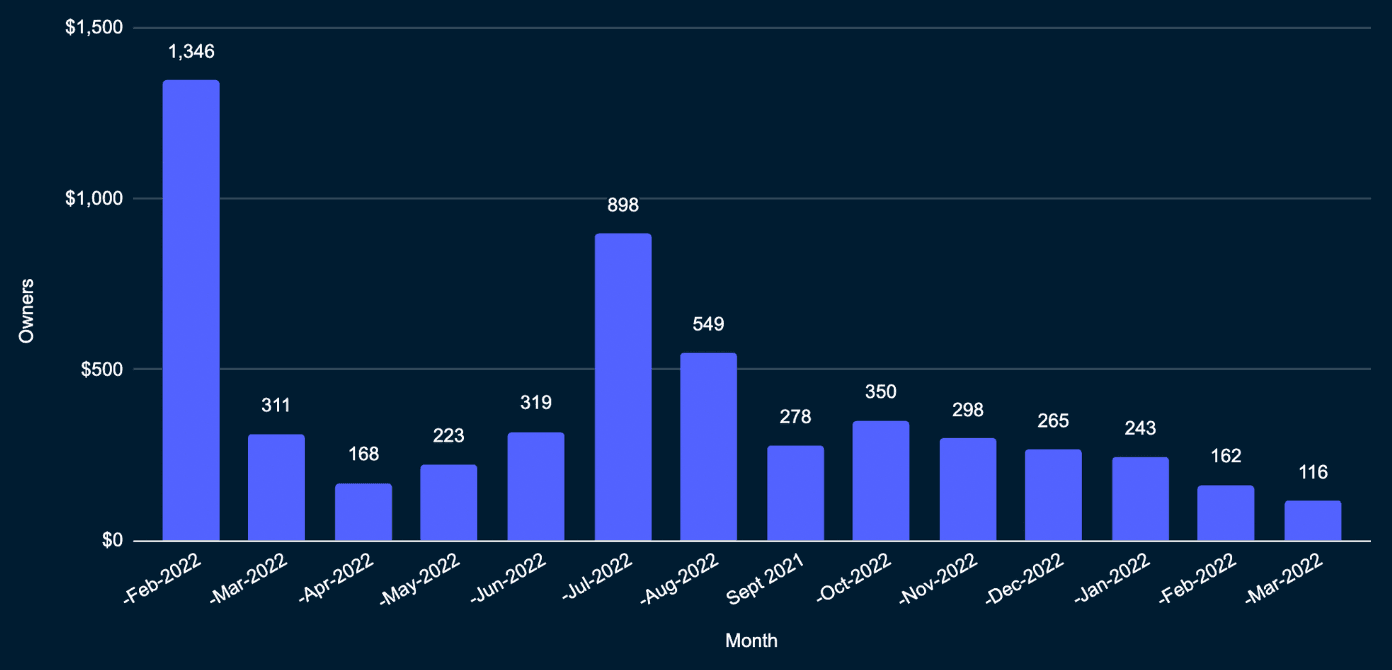
Looking at the graph below however, it can be seen that the number of new owners in the project has been in decline for almost 8 consecutive months (with the exception of October which saw a slight increase). This suggests that there aren't significant numbers of new participants joining the project.
Importance of land location in virtual worlds
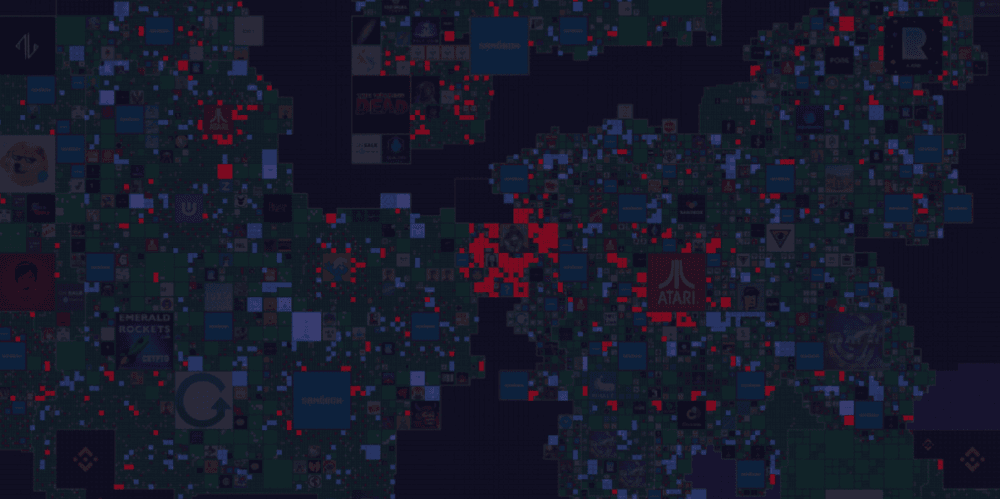
To better evaluate the importance of location in virtual worlds, we can refer to the image above which shows the distribution of lands based on the average price in Sandbox. The red dots represent lands with an average price in the top 5%, while the blue dots show the lands having an average price in the bottom 10%.
- It can be seen that the majority of the most expensive lands are clustered together. Proximity to one another seems to be an important factor. This is also similar to what you find in the real world, where the price of properties in affluent neighborhoods is much higher in comparison to the rest.
- Additionally, proximity to major “landmarks” also determines the price of the land. Many of the most expensive lands are surrounding or next to these “landmarks”.
- The cheapest lands are also in close proximity to one another in certain cases, although to a much lower extent. Their distribution is a lot more scattered and less organized on the map.
Landlords and lands for rent
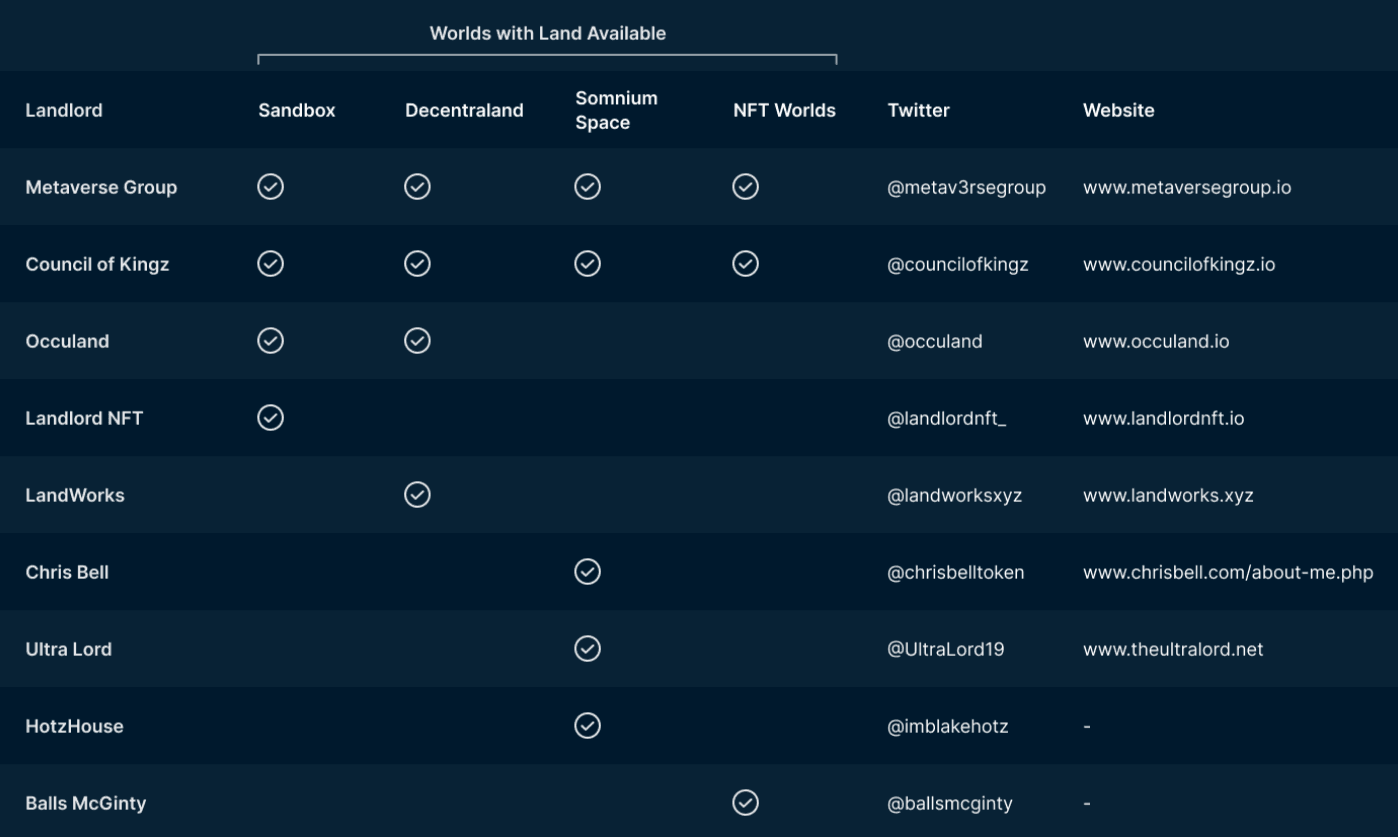
There are various metaverse land owners looking to rent their land. The table below shows a breakdown of landlords willing to rent their land and the land they have available in the different virtual worlds. The list includes metaverse businesses as well as individuals.
Decentraland upcoming events
- Dragon City Catwalk Show
- metaverse fashion event (Wednesday, Apr 06 from 12:00pm to 02:45pm UTC)
- AllBright Meta Club’s Women in Web3
- Networking (Wednesday, Apr 06 from 06:00pm to 08:00pm UTC)
- DG Hodler Roundtable
- DAO Discussion (Thursday, Apr 07 from 07:00pm to 08:00pm UTC)
- Samsung 837X’s You Make It Block Party (Friday, Apr 08 from 12:37am to 02:37am UTC)
- Habitat for Humanity Presents: The FIRST 501(c)(3) Fundraiser in the Metaverse! (Thursday, 07 Apr at 08:00pm UTC to Thursday, 14 Apr at 06:59am UTC)
- MetaTrip #52 (Tuesday, Apr 12 from 04:00pm to 05:00pm UTC)
Metaverse News
- Investment bank Citi estimates that the metaverse economy could reach $13 trillion by 2030.
- Emmanuel Macron launches his virtual campaign on Minecraft
- Cryptovoxels faced a Discord scam attack that cost some of its users their parcels
- Decentraland opened up its in-world builder to everyone, not just LAND owners
- TeaDAO - a Metaverse Reserve Currency - Enabling GameFi 2.0 by Solving NFTs Illiquidity raised a US$4.6 Million Seed Round led by Shima Capital
- Twitch Co-Founder’s Solana Gaming NFT Platform Fractal Raises $35M
- Metapoly - a new decentralized metaverse land bank with asset-backed stablecoin $USM - conducts IDO - Genesis NFT Mint
- Defi Kingdoms launched on Avalanche


