
Nansen’s take
The most relevant macro question at the moment has to be: are we moving to a regime of lower inflation that will lead to a less marked growth differential between countries with a net energy trade deficit and net energy exporters? And what are the implications for global monetary policy? A lower growth differential between the US and Europe / Japan would be significant for the direction of monetary policy (supposedly less hawkish Fed).
We also look at price momentum of crypto vs other assets to assess whether prices are stabilizing (despite negative fundamentals) or deteriorating following the bearish developments post-FTX bankruptcy.
What is happening to oil and what implications for inflation?
Crude oil fell ~7.5% last week and underperformed risk assets. Oil price momentum has been fading in the last six months (see chart below), which begs the question of whether this weakness is likely to continue.
We see two potential drivers that account for energy futures’ price correction:
Future markets are pricing slower global growth, and the US converging with the rest of the world to “the downside”. This week, the US Treasury yield curve bear flattened further. The 3m-10yr yield differential has reached -42bps, indicating that bond investors expect growth and inflation to fall in the US as a result of higher policy rates. Situation in Ukraine: Russia appears to be standing in a more vulnerable military position, having had to retreat from some territories. Geopolitically, the US and China have voiced their support for a negotiated end of the conflict. President Putin seems to be in a difficult situation and is likely to look for a solution to “save face”. This would go against the peaceful resolution that seems to be partly priced by markets.
The resolution of the Ukraine conflict would accelerate desinflation and send global rates lower, which would be positive for crypto and other risk assets. Nevertheless, we are reluctant to put a high weight to the scenario of a peaceful resolution given the difficulty of reconciling the two parties’ interests. However, the scenario of global and US recession does not seem unlikely in our view (main scenario vs soft landing scenario B for 2023), which suggests that energy prices could creep lower as global growth slows down, before re-accelerating post-recession.
Europe, confidence up from the lows
Lower European nat gas prices, and inventories near full capacity have helped cushion a significant growth shock for Europe. This price development is due to a mix of factors including benign winter temperatures and energy supply diversification. As a result, local business sentiment surveys have rebounded (see Germany ZEW survey chart below). This is supportive of European growth in the short-term and of EUR/USD. In the longer-term, if we assume no immediate resolution of the Ukraine conflict, the US dollar should recover, especially if a global recession materializes.
Labor markets tight around the world
Looking at global labor markets, we find them at multi-decade levels of tightness, despite volatility in their respective financial markets. The most striking example is the UK labor market which boasts an unemployment rate at 3.6% and earnings of 5.7% YoY, despite the recent volatility in UK gilts. This allows us to complete the picture of slowing commodities’ and goods’ inflation with the trend of higher wages globally, and brings us to the discussion on likely next steps for monetary policy in this macro context.
The Fed
The Fed has to operate in the context of a historically strong domestic labor market and with the uncertainty of slowing but well-above target inflation.
Last week’s FOMC committee members’ speeches varied on the bullish to hawkish spectrum (Brainard to Bullard, see figure below) but agreed on 1) a likely slow down from the 75 bps-hike-per-meeting pace, 2) the uncertainty around the level of the terminal rate and decisions’ data-dependency.
Fed Bullard attempted the perilous exercise of calculating a Taylor-rule estimate of the appropriate policy rate and obtained a range of 5% to 7%. The US 2yr Treasury rate currently trades at 4.5%: if Bullard’s estimate holds, this would signify more upside for the US dollar and downside for risk assets.
Fed Chair Powell will give a speech on November 30 (https://www.brookings.edu/events/federal-reserve-chair-jerome-powell-the-economic-outlook-and-the-labor-market/). We believe that the message is likely to be on the hawkish side following the risk-on moves that followed the lower-than-expected October CPI print.
What is price momentum saying?
We ranked the price momentum of selected assets to check whether prices agree with or tell a different story than fundamentals (see chart below). We make the following observations:
The DXY price momentum has been progressively deteriorating (top asset YoY and in last six months, fourth asset in last three months, 8th asset in the last month) Crude oil went from the second best asset in the last year, to the 7th-8th asset more recently Chinese equities’ momentum has been steadily improving from number 8 to number 4 in cross-asset momentum US Treasury momentum is also slowly improving BTC and ETH price momentum remains deeply negative across various time horizons. Despite crypto’s low valuations (on-chain indicators at lows since 2009), price momentum has not stabilized yet and is not yet signaling a crypto bottoming.
What to pay attention to this week: Light week, watch flash PMIs. Are we heading towards recession?
Tuesday 22: FOMC committee members speak (Bullard, George, Mester). / RBA Lowe speaks, following better than expected Australian employment numbers.
Wednesday 23: Europe, US, Japan Flash PMIs (are we on the road to recession?). / US Michigan Survey. / US New home sales. / US FOMC meeting minutes.
Thursday 24: German Ifo sentiment survey. / ECB account of monetary policy meeting published. / US off for Thanksgiving.
Friday 25: German Q3 GDP.
Charts that matter
Lower energy prices boosted German sentiment

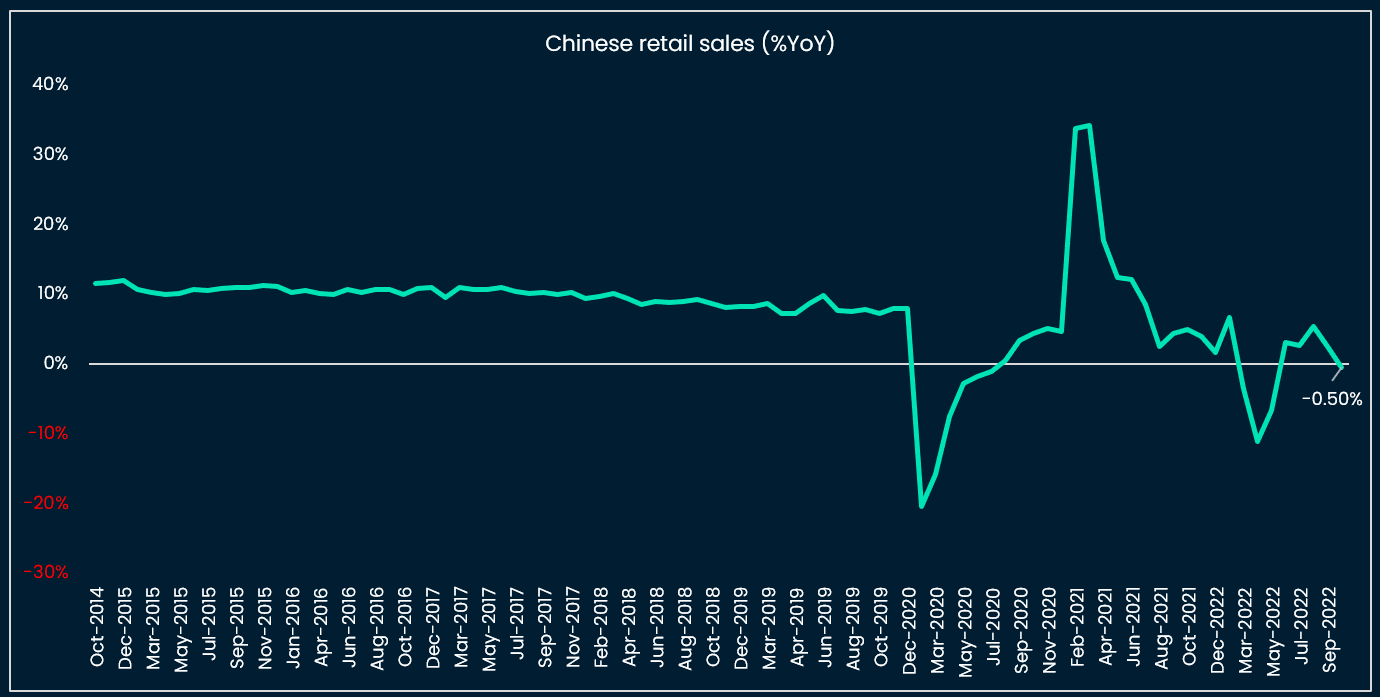
China “exiting zero-covid” out of necessity
US housing weakened, but consumption held up

Strong labor markets justifying monetary tightening

More inflation prints below expectations in October

Fed Bullard: recommended policy rate at ~5% to 7%

FOMC committee members: hiking pace to slow, but level of terminal rate is data-dependent

Momentum improving for Chinese equities, deteriorating for the DXY and crude oil, still negative for crypto
Appendix: on-chain and market indicators