
Relevant macro data and events
China and EM
The Chinese PBoC held its policy rate at 3.65% but cut its bank reserve requirement rate by 25 bps to 11%. Surging covid cases and hesitancy in dropping zero-covid quarantines led to street protests erupting in several Chinese cities. Following last month’s plan on real estate rescue, ICBC pledged 655bn yuan in credit lines to 12 Chinese developers. It followed prior lending initiatives from China Construction Bank.
In Taiwan, President Tsai Ing-wen resigned as head of the governing Democratic Progressive Party (DPP) after the opposition party, the Kuomintang (KMT), won several local elections including in Taipei. The KMT is considered less of a “China hawk” than the DPP.
In the rest of EM, the central banks of South Africa and Korea hiked by 75bp, to 7%, and by 25bp, to 3.25%, respectively.
DM inflation
Further inflation prints in DM markets came below expectations: German Oct. PPI at 34.5% vs 41.5% expected and Hong Kong CPI at 1.8% vs 2.0%e.
US
The US Conference Board leading indicator fell by 0.8% in October, led by lower consumer confidence and negative prospects for housing and manufacturing. The indicator has existed since 2000, and, based on its historical leading property, suggests that the US economy is entering a recession. The Chicago (-0.05 vs -0.03 expected) and Richmond confidence survey (-9 as expected) indicated deteriorating demand for manufacturing but resilient demand for services, with only slightly less difficulty to find skilled workers.
The US 30 yr mortgage rate declined for the third consecutive week from 7.14% at its peak, to 6.67%. Coincidentally, housing demand indicators recovered slightly.
US initial jobless claims came slightly above consensus at 240k vs 225k expected.
Flash PMIs
Eurozone Manufacturing (47.3) and Services (48.6) both beat expectations (46 and 48), led by improved sentiment in Germany. UK Manufacturing and Services came in at 46.2 and 48.8 vs 45.7 and 48 expected, respectively. The US Manufacturing PMI at 47.6 and Services PMI at 46.1, disappointed the consensus of 50 and 47.9. Japan Manufacturing PMI, at 49.4 came below the 50.9 consensus. Japan Services PMI was down 3.2 points to 50.
Europe
In the Eurozone, confirming the better-than-expected PMI prints, the German Ifo expectations survey rose to 80, above the 77 forecast. In Sweden, the Riksbank delivered a 75bp, taking its policy rate to 2.5%.
What to pay attention to this week: The employment part of the Fed equation
Tuesday 29: Chinese Manufacturing (expected at 50) and Non-manufacturing (48e) PMI
Wednesday 30: German Nov. employment data (unemployment rate forecast at 5.5%). / The Eurozone CPI should reflect decreasing energy prices (expected at 10.4% YoY).
US Nov. ADP Nonfarm Employment Change, consensus at 200K. / Q3 GDP consensus at 2.7%. / JOLTs job openings (10.3m consensus). / Powell is due to speak on November 30 at the Brookings Institution about the labor market and the economic outlook.
China Nov. Caixin manufacturing PMI (49e).
Thursday 1 Dec: US Oct. core PCE (5% YoY expected). / US ISM manufacturing PMI (49.8e).
Friday 2 Dec: US non-farm payroll (consensus 200k), unemployment rate (5.3%e) and participation rate (prior 62.2%).
Sunday 4 Dec: China Caixin services PMI (prior 48.4)
Nansen’s take
This week was calm on the data front but saw unusual political and social volatility in Asia. In Mainland China, local protests are worth monitoring closely. It is difficult to speculate on their political repercussions. We will just observe that the social capital that would be consumed by sticking to zero-covid policies seems to be growing heavier. All things equal, this probably increases the probability of China reopening in 2023, despite surging covid cases. It also pushes the Chinese authorities to address the weakness in domestic demand and employment. So far, the authorities have delivered RRR rate cuts and asked the national banks to extend lines of credit to real estate developers (to address the slump in the property markets and preserve domestic wealth, which is heavily skewed towards real estate). If this momentum continues (see Chinese flash PMIs next week), weak economic data will likely be followed by more loosening in monetary and fiscal conditions (negative CNY and potentially positive Chinese risk assets).
US vs Europe: Growth differential less in favor of the US
In Europe, German businesses are growing more confident. Iit seems that the country has avoided, so far, a natural gas crunch and significant demand destruction. UK PMIs also surprised positively, with surveyed businesses quoting less political uncertainty. Short-term, this is bullish EUR and GBP vs USD, especially as US PMIs have been, in contrast, disappointing expectations (see chart below). Long-term it is too early to call for a DXY peak given a relatively solid US economy (next week’s employment data might inform us on the state of the US labor market which has remained resilient so far).
Overall, the macro messages of the flash PMIs were: weakness in manufacturing new orders, demand for services holding better than manufacturing but slowing, less pressure from commodity inflation, subsiding supply chain bottlenecks, and, on the employment front, less willingness to replace workers who quit. The levels and messages from PMIs strike us as forecasting slowing growth but no sharp recession (yet). Could it be that the soft landing scenario is starting to materialize? Are inflationary pressures receding without real growth “falling off a cliff”?
Our main scenario maintains a sharper slow down, as the Fed follows a lagging core CPI that takes time to return to the 2% target (despite slowing headline inflation). We see the 1970s-80s developments (see chart below) as a relevant historical framework. In 1974, the Fed only stopped hiking after the unemployment rate had surged by ~90 bps to 5.5%. In 1980, the Fed paused as the unemployment rate reached 7.6%. For crypto, more patience is likely warranted to call for a bottom. Even as on-chain indicators stand at multi-year levels of cheapness, fundamentals have not yet turned favorable.
Charts that matter
US - Eurozone positive growth differential decreases

The 1970s-1980s playbook: The Fed did not hike before a significant jump in unemployment

On-chain and market indicators
Cross-asset momentum: deteriorating DXY returns not enough to support crypto price stabilization yet

Stablecoin indicator still in panic

Stablecoin indicator: ETH / USDC backtest

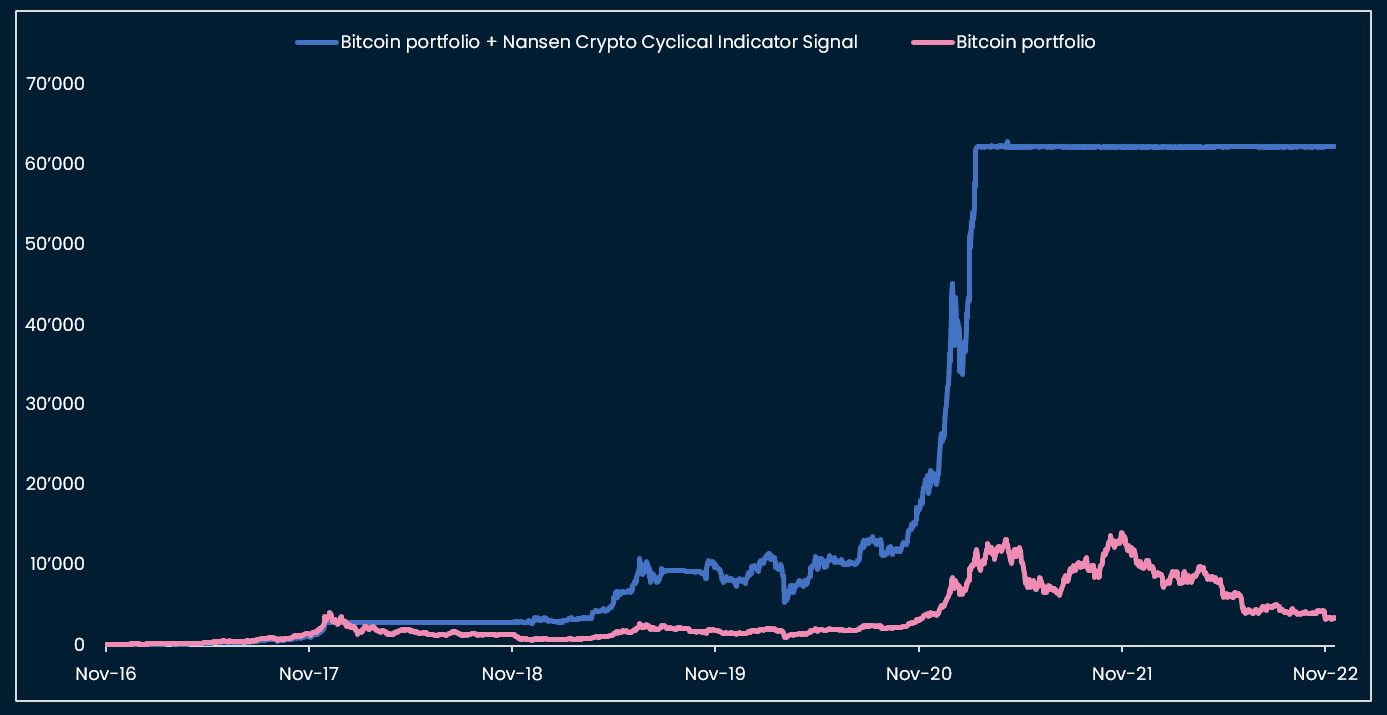
Stablecoin indicator: BTC / USDC backtest

BTC long-term indicator: central bank balance sheet growth / US yield curve not supportive yet, MVRV close to risk-on

BTC long-term indicator: BTC / USDC backtest
Equity Risk Premium at 7.9%

Equity Risk Premium: high but not at capitulation levels