
Market-moving data and events
Slower inflation outside of Japan
- US Nov. core CPI came in at 6.0% YoY (vs 6.1% expected) and headline CPI also printed below consensus, at 7.1% YoY (vs 7.3% expected). Aside from Shelter, the main categories of the CPI saw lower growth, with energy contracting MoM.
- UK Nov. CPI surprised to the downside at 10.7% YoY vs 10.9% expected.
- Eurozone Nov. CPI 10.1% YoY vs 10%e.
- Japanese Nov. PPI 9.3% YoY vs 8.9% expected: Japanese inflation continues to accelerate.
Central banks: battle of the hawks between the Fed and the ECB
- The Swiss National Bank, European Central Bank, Bank of England and Fed each hiked rate 50bps to 1%, 2.5%, 3.5%, and 4.5% respectively.
- The ECB announced that it would stop reinvesting in the maturing securities of its APP portfolio from March 2023 on and that the month on month decline in its balance sheet would amount to EUR 15bn by month, to be re-evaluated at the end of Q2 2023.
- The ECB projected a sharp real GDP slowdown to 0.5% YoY in 2023 (prior estimate 0.9% YoY) and revised up its inflation forecast to 6.3% YoY from 5.5% YoY.
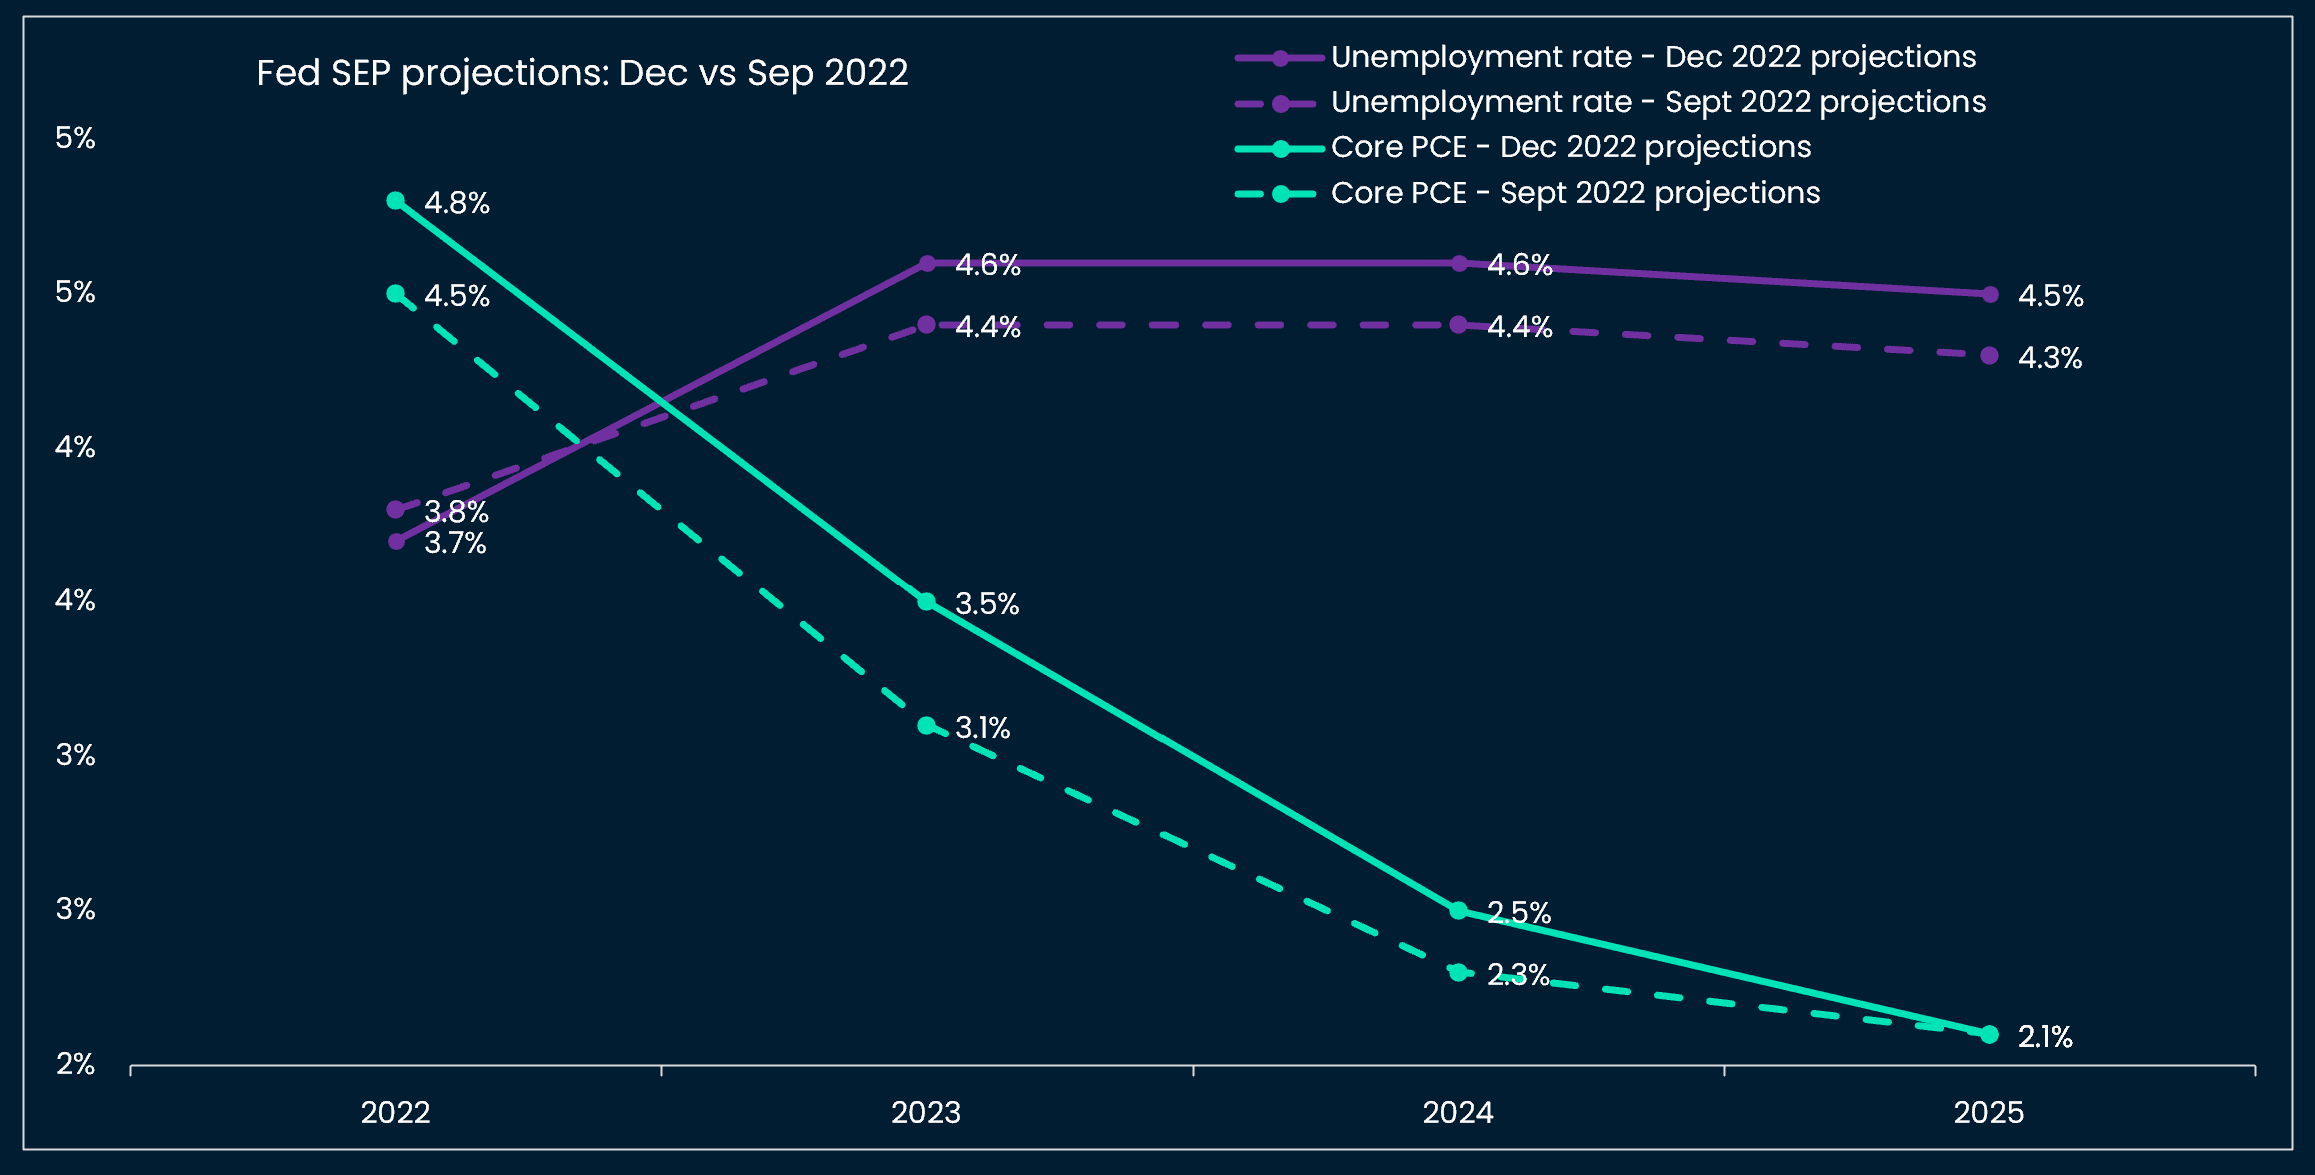
- The Fed’s projections indicated a median terminal rate of 5.1%. The Committee revised up its estimates of 2023 unemployment rate 20bps to 4.6%, and core PCE estimates were also up from 2.8% to 3.1% for 2023.
Chinese growth falters
- Chinese Nov. loan growth disappointed at 11% YoY. Hard data were underwhelming, as was to be expected pre-”zero covid” exit: Nov. retail sales contracted by -5.9% YoY!
- The China’s Economic Work Conference reiterated the Chinese government’s focus on reviving consumption, reducing unemployment and rescuing the property sector, with a return to “zero covid” unlikely despite the current case wave.
US macro weakness
- PMIs Flash Manufacturing: Japan 48.8 vs 49e, France 48.9 vs 48.2e, Germany 47.4 vs 46.3e, Eurozone 47.8 vs 47.1e, UK 44.7 vs 46.5e, US 46.2 vs 47.7e
- PMI Flash Services: Japan 51.7 vs 51.1, France 48.1 vs 49.1, Germany 49 vs 46.3, Eurozone 49.1 vs 48.5, UK 50 vs 49.2e, US 44.4 vs 46.8e
- German Dec. ZEW economic sentiment recovered further, jumping 15 points MoM to -23.3, faster than expected.
- US Nov. retail sales control group contracted -0.2% MoM vs a growth of + 0.2% expected. Nov. Philadelphia Fed Manufacturing index was at -13.8 vs -10e. New York Empire State Manufacturing index printed -11.2 vs -1e.
Upcoming data
The macro newsletter will be back after the holiday season. Here is what to watch for in the meantime:
- Monday 19 December: The Bank of Japan meets and is likely to hold policy rates at -0.1% and maintain the yield curve control policy despite rising inflation (inflation expectations are now above the central bank’s 2% target).
- Wednesday 21 December: US Dec. CB Consumer Confidence (consensus 101). / US Nov. Existing Home Sales (consensus 4.2m)
- Thursday 22 December: US Nov. Core PCE Index (consensus 0.2% MoM and 4.6% YoY)
- Friday 30 December: Dec. NBS China Manufacturing PMI (consensus 49)
- Sunday 1 January: Dec. Caixin China Manufacturing PMI (consensus 48.9)
Nansen's take: Higher probability of hard landing and implication for crypto assets
_“Two good monthly reports are very welcome but we need to be very honest with ourselves that 12m core inflation is 6% that's three times our 2% target” “Reducing inflation is likely to require a sustained period of below trend growth and some softening in labor market conditions” “We will stay the course until the job is done” Fed Chair Powell_
_“Interest rates will still have to raise significantly, at a steady pace to reach levels that are sufficiently restrictive to ensure a timely return of inflation to our 2% target” “We are not pivoting, we are not wavering, we are showing determination and resilience in continuing a journey where we have more ground to cover [than the Fed]” ECB President Lagarde_
A series of DM central banks stepped down the pace of their rate hikes to 50bps last week. However, investors, who had started to speculate on peak Fed Fund rates, were surprised to hear Fed Chair Powell reiterate the same hawkish message communicated two weeks before in a speech at the Brookings Institution. Our interpretation of the Fed’s SEP projections and communication is that the focus has switched from inflation to inflation drivers or “unbalanced” US growth, more precisely the uncomfortable tightness of the labor market. The Fed is now explicitly seeking to engineer a slowdown of US growth. As soft landings or “shallow” recessions as described by analysts and wished by central bankers are rare occurrences, it seems to us that the chances of a hard landing are increasing. Indeed, the latest cyclical indicators converge around the following picture: new orders are falling, inventories are rising, inflationary pressures are slowing. This weakness is clearly visible in Manufacturing data, but even Services activity looks like moderating, as flagged by the latest drop in the US Services PMIs (US was the weak link vs other DM markets). Cyclical softness coincides with historically tight labor markets in the US and Europe. Hence a likely situation where the Fed (to a lesser extent the ECB who has to deal with Italy and periphery spread containment in case of over-tightening), focuses on making the labor market “crack”, and maintains historically tight financing conditions even as real growth slows sharply.
What would a hard landing imply for asset prices? It would probably signify much higher credit spreads: US high yield spreads currently trade at 450bps while they crossed 1,000 bps during the covid crash of 2020. It would push equity markets lower: the S&P 500 equity risk premium is currently estimated at 7.8%, whereas it jumped above 20% in 2020 and 2008.
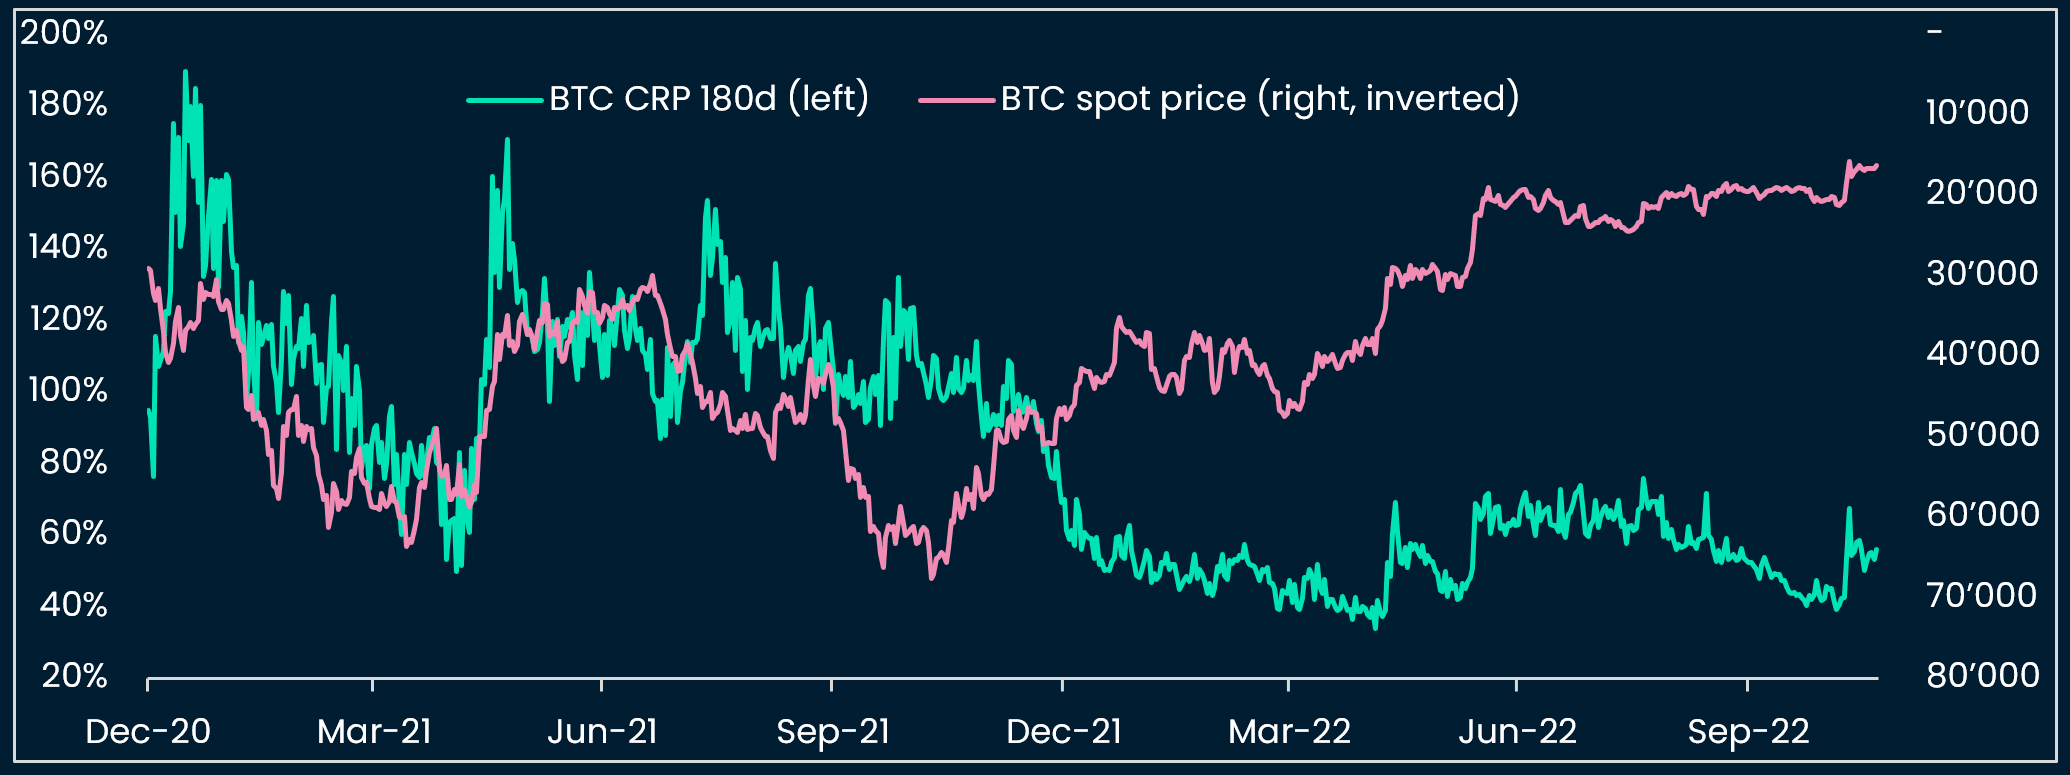
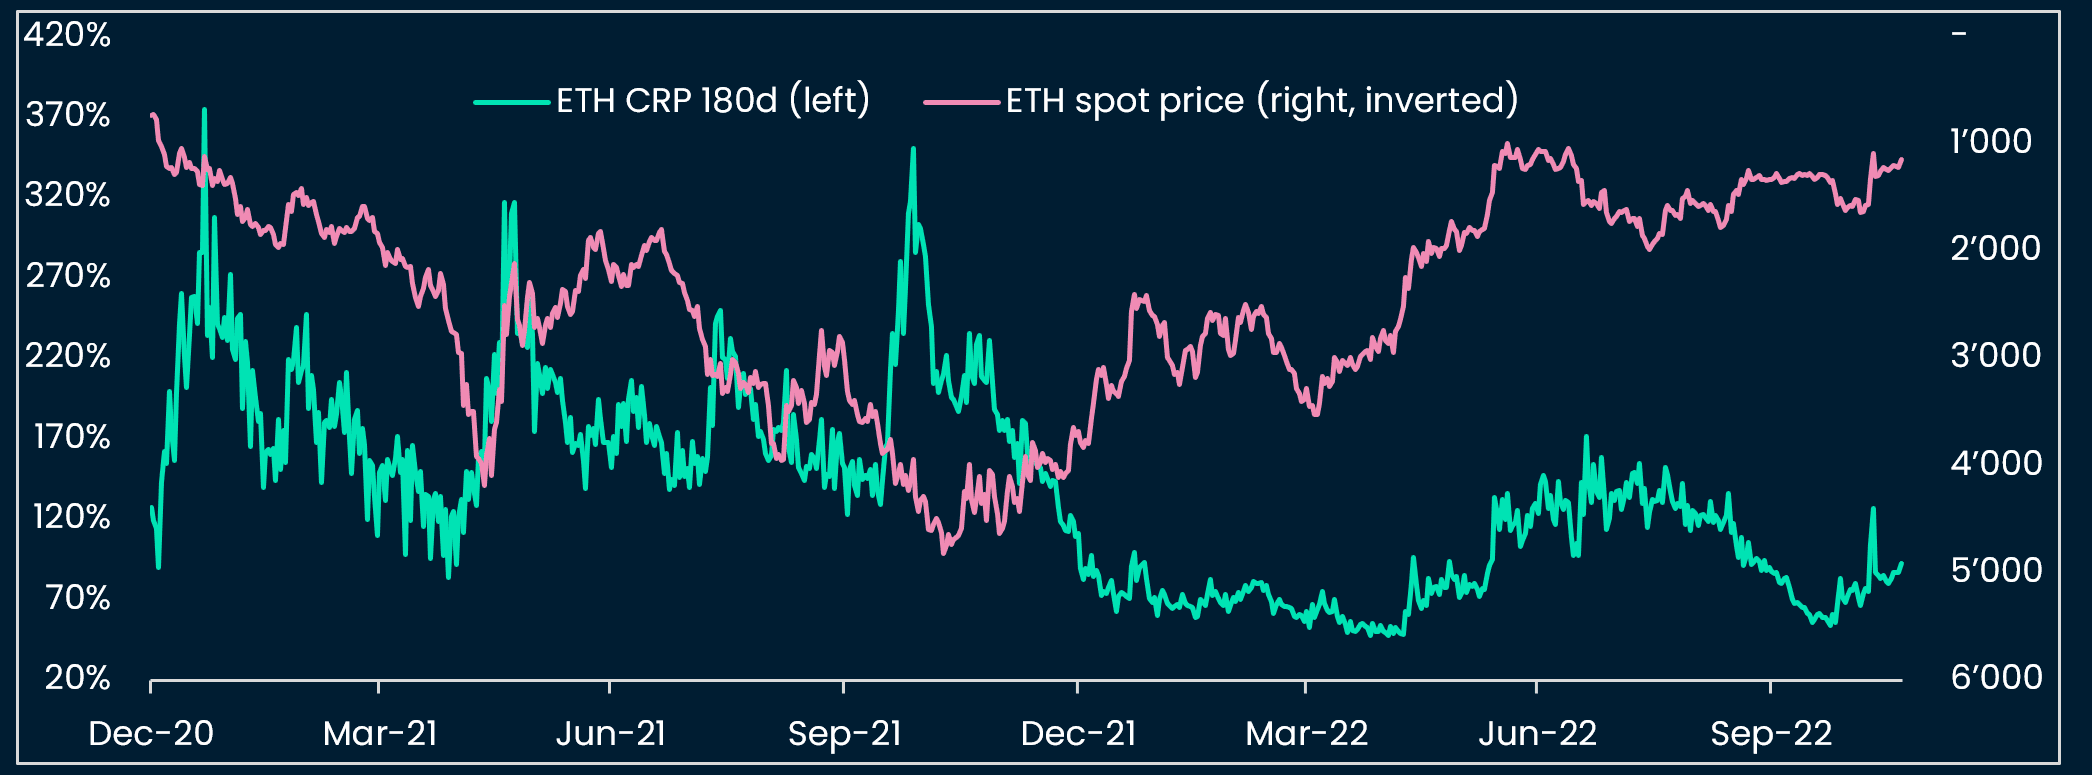
What about crypto prices? We published a note last Friday that proposes a valuation model for crypto using the risk premium e.g. the return compensation that investors are asking to hold a certain risky asset. According to our analyses, the BTC risk premium currently stands at 56% vs a median of 76% in 2021-2022 and ETH risk premium is 92% vs a median of 137%. The Crypto Risk Premium (CRP) has come down in 2022 after rising in 2021. We found that a low CRP tends to predict lower crypto returns and vice versa. In relation to the S&P 500 Equity Risk Premium (CRP), the CRP appeared “fairly valued” e.g. close to historical median and mean of ~10 for BTC (we used a larger time sample going back to 2014 using historical volatility). So our intuition is that crypto prices are likely to experience another leg down, as their risk premium surges with equity risk premium in a now increasingly probable hard landing.
One area of likely bullishness outside of DM markets is China: Chinese growth numbers for November were dismal, while social discontent has braved censorship. The Chinese authorities are forced to honor again the social contract that they had left behind during “zero covid” (political stability vs prosperity of the majority). Monetary and fiscal policies are likely to stay easy in China, in contrast to the rest of the world. Growth-supportive policies should represent a further tailwind for local assets.
Charts that matter
FOMC forecasts stagflationary 2023
ECB forecasts "shallow" growth for 2023, but shies away from recession projections

We found that a high BTC risk premium led to subsequent higher BTC returns
ETH risk premium vs price
BTC cyclical on-chain indicator neutral

Nansen stablecoin indicator tactically risk-on