Introduction
Blockchain technologies are being promoted as a replacement for banks; a new way to buy art; an essential part of the metaverse, and perhaps the next big investment opportunity, resulting in a rapid rise in its popularity. As such, emerging blockchain technologies continue to be subject to significant hype despite the current market downturn. Specifically, the Metaverse, Web3, Decentralized Finance, and Cryptocurrency are four key innovations that promise to deliver unique benefits for retail and business consumers, but all are in varying stages of maturity.
While some of these blockchain technologies are still nascent in their development, their associated risks often do not deter enthusiasts from adopting and promoting them ardently, fuelling their hype. In mainstream literature, there are many definitions of what ‘hype’ constitutes in relation to the description of blockchain technology adoption. Some might argue that hype is defined as “intensive publicity or promotion.” However, others might argue that hype is also an ideology about social change. For Gartner, a management consulting company, the hype surrounding the emergence of technology can be identified as a five-part cycle:
- Technology Trigger,
- Peak of Inflated Expectations,
- Trough of Disillusionment,
- Slope of Enlightenment, and
- Plateau of Productivity.
Although Gartner has their methodology for identifying the trajectory of a hype cycle, we ask if it is possible to identify footprints and characteristics of hype using on-chain data.
This paper is organized as follows:
- A review of “hype’s” definition and its relevance to understanding blockchain technologies;
- An explanation of this paper’s research methodology;
- Quantitative findings on the relationship between hype and cryptocurrencies’ prices;
- Qualitative findings on hype’s impact on cryptocurrencies’ prices;
- Lastly, our conclusion from using on-chain data to understand the relationship between hype and cryptocurrencies.
We would like to reiterate the point that while our data points show significant correlation between different variables, correlation does not necessarily imply causation.
Why Hype Matters
Financial markets are often inefficient, and market participants do not always behave as rational actors. In fact, an inefficient market means that prices often do not accurately reflect an asset’s intrinsic or fair value, which has several implications. First, prices can be driven up by excessive speculation. Second, market participants can exhibit cognitive biases that sometimes lead to poor decisions and an inability to accurately assess and react to market conditions. As such, both scenarios related to market inefficiencies mean those market participants are vulnerable to irrational decisions that may sometimes lead to monetary and opportunity losses.
Popular narratives influence some market participants – often leading to hype-driven investment decisions. Although there are conservative market participants who may have a more holistic assessment of an investment opportunity, some market participants still correlate hype with the opportunity of a higher return. Social sentiments such as Google Trends and Twitter volume can sometimes serve as indicators for these market participants. More formally, prospective investors have also referred to Gartner’s Hype Cycle as a framework for analyzing technological trends. Typically, Gartner’s Hype Cycle helps investors situate where a technology is in its hype lifecycle. For example, if a technology is at the Peak of Inflated Expectations on the Hype Cycle, it may be a good time to invest in it because it has the potential to offer a very high return. On the other hand, if a technology is in the Trough of Disillusionment, it may not be a good time to invest since it may not have significant growth prospects. Using the Hype Cycle, prospective investors can make more informed decisions about which technologies to invest in and how to manage those investments.
Method
This paper primarily relies on on-chain analysis. Such analysis typically involves looking at transaction data and crypto wallet activities. More broadly, the paper relies on a mixed methodology when surfacing the characteristics of a cryptocurrency’s hype using on-chain data. For the quantitative section, we utilize descriptive statistics to understand the relationship between Google Trends, Twitter Volumes, and on-chain indicators such as Smart Money Wallet’s holdings and Fresh Wallet Volumes, altogether with what these variables mean for the cryptocurrency price. It is important to note that this study focuses on on-chain data on the Ethereum blockchain and hence uses data related to Wrapped Bitcoin (WBTC) and Wrapped Ethereum (WETH). For the qualitative component of the study, we used a content analysis approach to critique how a cryptocurrency token-economics fundamental relate to its hype and price actions through the use of three case studies: ChainLink (LINK), GMX, and Dogecoin (DOGE).
Surfacing Hype Through On-Chain Data
Given Bitcoin’s market dominance and influence over the broad cryptocurrency market, we assumed that analysis of Bitcoin’s hype might shed light on its relationship with on-chain indicators and its price movements.
Daily Data Range
| BTC/USD | Change in Smart Money Wallets holding WBTC (Count) | Change in Fresh Wallets holding WBTC (Count) | Tweet Volume about Bitcoin | |
|---|---|---|---|---|
| BTC/USD | 1.00 | |||
| Change in Smart Money Wallets holding WBTC (Count) | -0.08* | 1.00 | ||
| Change in Fresh Wallets holding WBTC (Count) | 0.49 | 0.22 | 1.00 | ||
| Tweet Volume about Bitcoin | 0.78 | -0.05 | 0.45* | 1.00 |
Relationship between Bitcoin’s Tweet Volume and On-chain indicators on WBTC (Daily data was used).
When looking at the relationship between Bitcoin’s Tweet volume, on-chain indicators (such as Smart Money Holding and Fresh Wallets on WBTC), along with their relationship to Bitcoin's price action between 2019 to 2022, we observed some notable correlations.
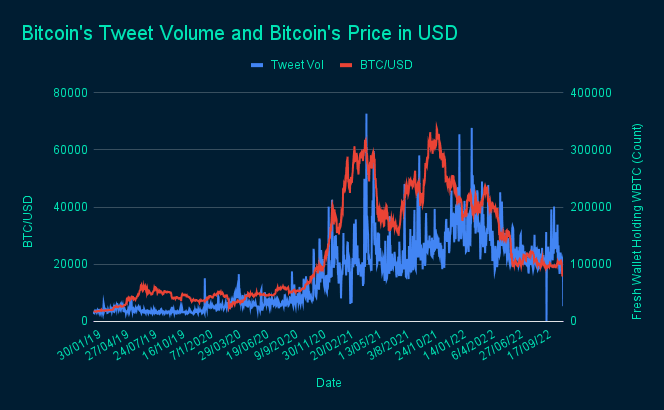
- Bitcoin’s Tweet Volume is highly correlated with Bitcoin’s price.
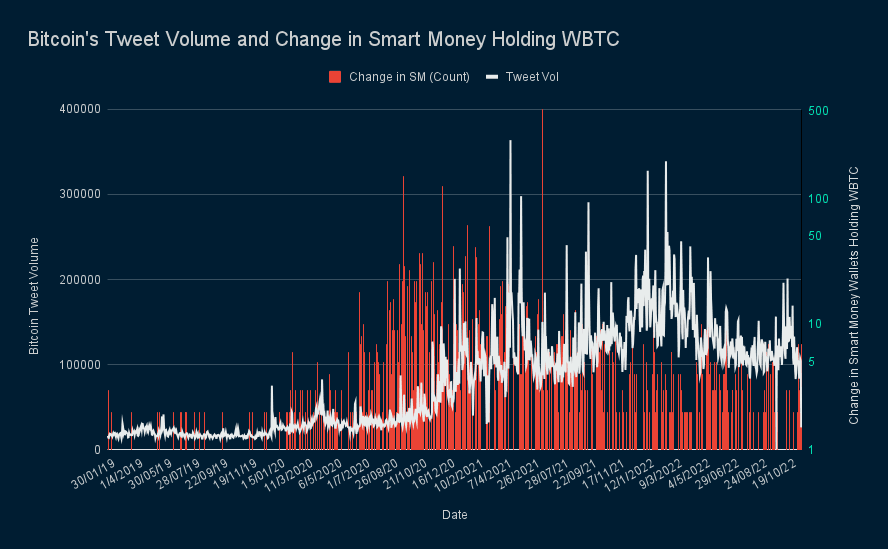
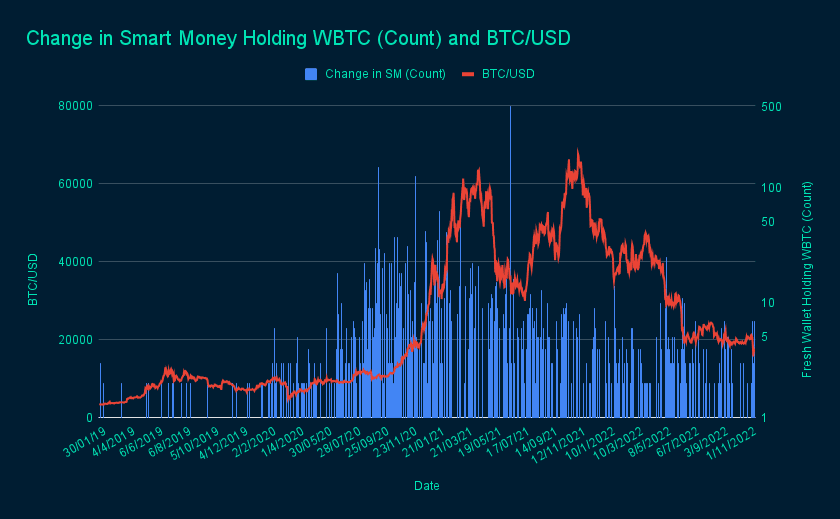
- Bitcoin’s Tweet volume is inversely related to the Change in Smart Money Wallets’ holding WBTC. However, this inverse correlation is relatively weak. Interestingly, Smart Money Wallets’ holding of WBTC is also inversely correlated to Bitcoin’s price movement. In the following charts, we observe that the change in Smart Money Wallets’ Holding WBTC may act as an early indicator of Bitcoin’s Tweet Volume and Bitcoin’s price direction.
Spike in WBTC Smart Money Holding just months before BTC price rally and increase in tweet volume
- Bitcoin’s Tweet Volume correlates significantly with the number of Fresh Wallets holding WBTC. Additionally, Fresh Wallets holding WBTC correlate with Bitcoin’s price movement.
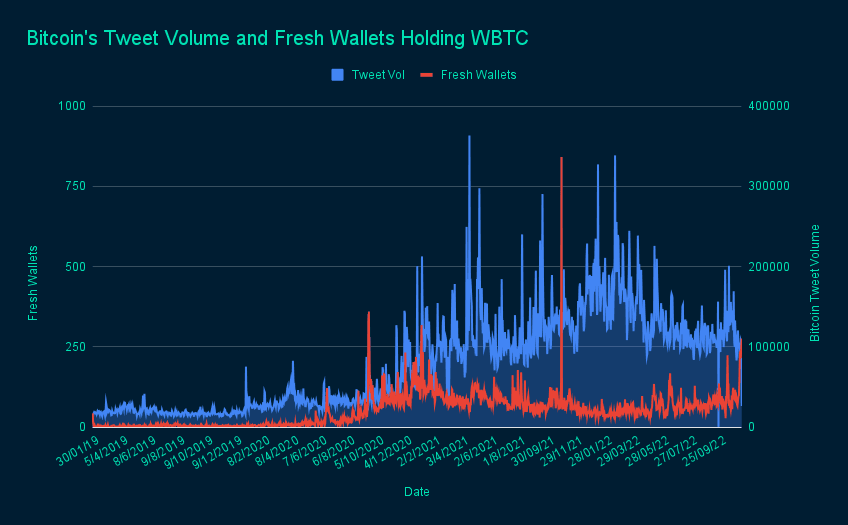
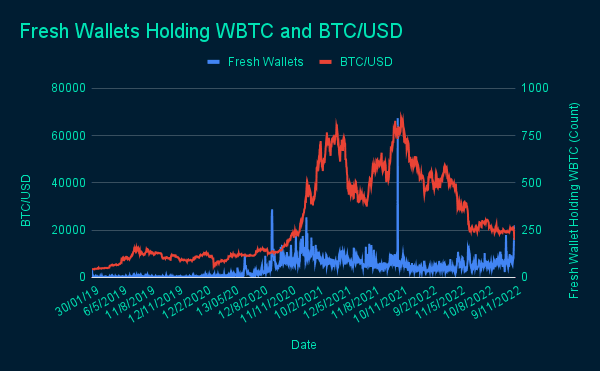
The number of Fresh Wallets holding WBTC could potentially be used to signal a possible change in market direction. In 2020, we noticed a continuous uptick in the number of fresh wallets from Sep 2020, which coincided with the beginning of the bull market rally in 2021. In Jan 2021, the number of fresh wallets peaked and started to taper off; the markets then saw a correction from ~40k level to ~30k level. At the end of Oct 2021, the number of fresh wallets once again spiked to new levels and coincided with the peak in BTC prices and the start of the bear market season. At the end of May 2022, the number of fresh wallets started to experience a significant increase which saw BTC prices break its downtrend and started trading sideways.
However, there are times when the number of Fresh Wallets may not always accurately reflect market changes. For example, in the first half of 2021, the number of new wallets increased in January but then started to decline, even though BTC prices continued to reach new highs. This shows that the number of new wallets is not always a reliable indicator of market trends.
The number of Fresh Wallets can be a useful indicator because an increase in the number of new wallets may suggest that more users and liquidity are entering the market, which could signal a potential uptrend. On the other hand, existing investors may also create new wallets to conceal their selling activities, which could indicate a potential downtrend, although the latter may be more applicable to institutional and more sophisticated players.
Relationship between Bitcoin’s Google Trends (Worldwide) and On-chain indicators (date range is Weekly)
| BTC/USD | Change in Smart Money Wallets Buying WBTC (Count) | Change in Fresh Wallets holding WBTC (Count) | Bitcoin’s Google Trend | |
|---|---|---|---|---|
| BTC/USD | 1.00 | |||
| Change in Smart Money Wallets Buying WBTC (Count) | -0.16* | 1.00 | ||
| Change in Fresh Wallets holding WBTC (Count) | 0.59 | 0.25 | 1.00 | ||
| Bitcoin’s Google Trend | 0.73 | -0.10 | 0.63 | 1.00 |
We also observed similar observations when comparing Bitcoin’s Google Trends, on-chain indicators, and their relationship to Bitcoin's price action.
- Bitcoin’s Google Trend and its price are highly correlated. This strong positive correlation is also present between Bitcoin’s Google Trend and the Change in Fresh Wallets holding WBTC.
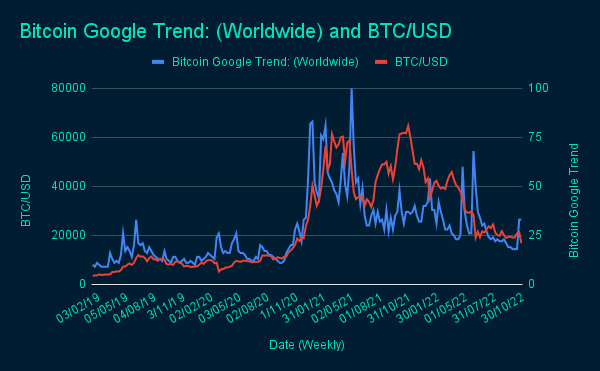
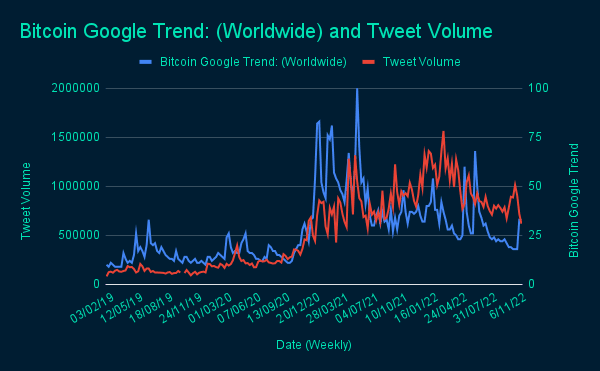
- Additionally, Bitcoin’s Google Trend and Tweet Volumes are correlated. However, it is interesting to note that in recent weeks Bitcoin’s Google Trends seems to be significantly lagging behind its Tweet Volume’s trajectory
The Different Faces of Hype: Three Case Studies
Through the above quantitative analysis, we have established the relationship between Bitcoin’s hype with its on-chain footprints, along with its price action. It is likely probable that a similar relationship between hype and on-chain characteristics could be said for other cryptocurrencies. However, we question if a cryptocurrency’s hype can always be linked back to a token’s economic fundamentals? To answer this question, we conducted a content analysis on three different cryptocurrencies. We sought to understand a cryptocurrency’s token-economics fundamentals and how it relates to its hype and price actions. In the following sections, we will be examining ChainLink (LINK), GMX, and Dogecoin (DOGE).
Chainlink (Good Fundamentals, Poor Hype)
2022 Link vs BTC Price

Chainlink’s market cap ($3.4b) is lower than hyped-projects that do not have a concrete use case in the market (e.g. Doge $13.2b, Shiba Inu $5.4b). LINK prices have not been spared despite having more than half of the market share and a 13.3% increase in Total Value Secured (equivalent to TVL metric for Oracles) since July this year. However, Chainlink’s fundamentals could have been a strong contributing factor as to why LINK prices have been more resilient than ETH prices since the end of July. ETH (-25%), Link (-17%).
GMX (Good Fundamentals, Good Hype)
GMX has been in the spotlight since its inception in September 2021, and this positive public sentiment is reflected in its phenomenal price performance despite the broader market downturn.
2022 GMX vs BTC Price

The design of GMX tokenomics received a positive response from the public for its low token inflation rates and strong value accrual to GMX token holders (e.g. 30% revenue accrued to token holders).
In our “What are Early GMX stakers Doing?” report, we highlighted that GMX was one of the most profitable protocols with fees surpassing the majority of its incumbents. Unlike other protocols, where mercenary liquidity exits the protocol once incentives dry up, our analysis discovered that the GMX tokenomics design created a huge incentive for GMX stakers to continue staking their tokens. This system appears to be working as we observed that an overwhelming majority of the initial GMX stakers are still staking on the GMX platform a year after GMX's inception, thereby creating an important supply sink and reducing downward pressure.
Furthermore, tweets from opinion leaders like Arthur Hayes have further added to the buzz and fueled price activity in 2022. The recent events (e.g. fall of Anchor Protocol, Celsius, etc) have also contributed to investors looking for protocols that can generate a sustainable source of yield such as GMX.
Using GMX as an example, we observe that strong fundamentals can lead to positive hype and sentiment which is bullish for the asset price.
DOGE (Poor Fundamentals, Good Hype)
Dogecoin is essentially a textbook case of a meme token that has prices propped up by hype and market sentiment.

Despite lacking any working product and a cap on the total token supply, Doge is ranked eighth among the top ten highest market cap tokens.
Since 2021, Doge prices have been extremely susceptible to external market / non-market events, including tweets by Elon Musk. The most recent instance occurred on November 1st when Elon tweeted an image of a Shiba Inu dog wearing a Twitter t-shirt, which drove Dogecoin prices to spike 26%.
Conclusion
Researchers have previously argued that increments in trade volume and, thus, upward price movement can be interpreted as market participants’ higher engagement with the cryptocurrency. As such, it is no surprise that a cryptocurrency’s tweet volume and Google Trends are highly correlated to its price movement. Through Bitcoin’s tweet volume and Google Trends, we affirm the observation that cryptocurrency prices are often associated with media and general publicity. Existing literature has also established that market participants are highly influenced by publicly available news, therefore, leading to a price pattern that moves in line with the (general) sentiment.
While Google Trends data can easily be retrieved, access to data such as Tweet Volume has proven to be challenging. Additionally, how tweet volume data is identified, characterized, and captured is highly subjective. However, the current study observed that the change in Fresh Wallets holding a cryptocurrency behaves in a similar manner to the trend in Tweet Volume and Google Searches. Arguably, Fresh Wallets' creations are driven by similar types of (retail) investors who engage with Tweet Volumes and Google Searches. As such, Fresh Wallets can help to signal retail hype.
In addition, the change in Smart Money Wallets holding a cryptocurrency is inversely correlated with the price movement of cryptocurrencies. Through the above graphical representations, we can loosely interpret that Smart Money remains a leading predictor of the price movement of a cryptocurrency.
Given the fact that the cryptocurrency market is still in its infancy and how quickly the industry develops, the interpretation of this study’s result may be limited in transferability and applicability.
Multiple data points have shown that market hype has a major impact on token prices. The fact that all tokens in the space are fairly correlated with one another makes diversifying among multiple tokens a less appealing option. However, as we've seen with GMX, strong fundamentals can lead to positive hype and sentiment. Behavioral economic studies have shown that market participants are not entirely rational, thus, asset prices are highly affected by the participant’s sentiments, emotions, and beliefs. We encourage market participants to triangulate various on- and off-chain data when interpreting the hype of cryptocurrencies.