
In this week's macro newsletter we unusually leave aside the regular review of macro data and developments. Instead, we take a step back and analyze tactical and macro indicators relevant to crypto. Part of the motivation for this week’s approach is the ongoing inertia of the macro data: our overall assessment, for the US and developed markets ex-Japan, is resilient growth (especially the robust labor market), with a negative momentum. This means that growth is slowly deteriorating but not significantly and fast enough that it would force the US Federal Reserve, the European Central Bank, the Bank of England to cut their respective policy rates, given core inflation’s stickiness in mature markets.
The first part of this article reviews a series of price-, derivative- and on-chain-based indicators. These tactical indicators, aimed at traders rather than long-term asset allocators, are pointing to neutral to negative short-term expected returns for BTC and crypto assets.
The second part of the article goes through cross-asset fundamentals and assesses how crypto is scoring in terms of risk-reward vs traditional assets. Using the staking yield from ETH and its realized volatility, we find that crypto scores as less fundamentally attractive than other traditional financial assets like cash and US investment grade credit. This would change if the US Fed were to start cutting rates.
Review of tactical and cyclical crypto signals
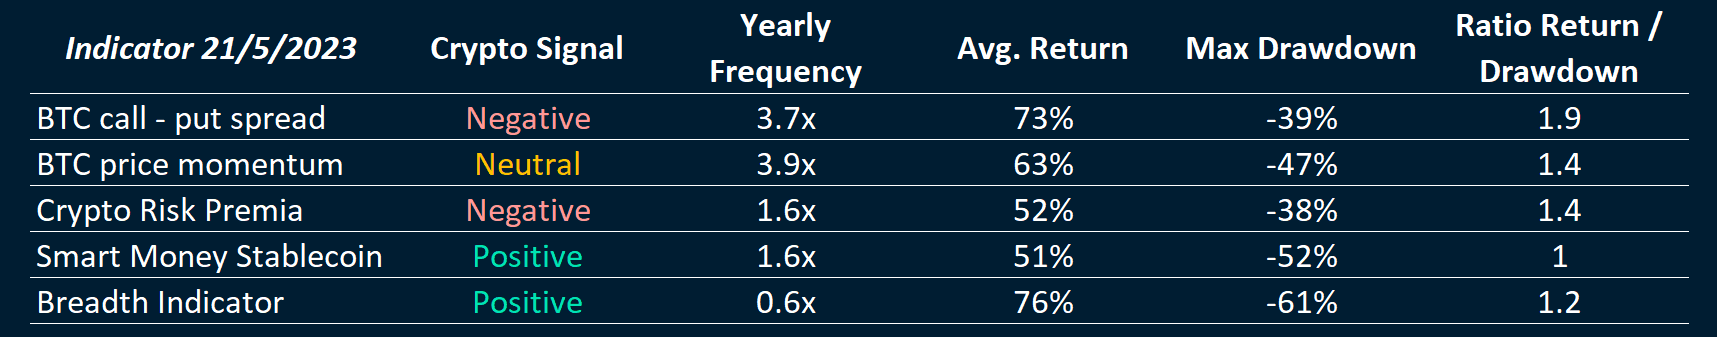
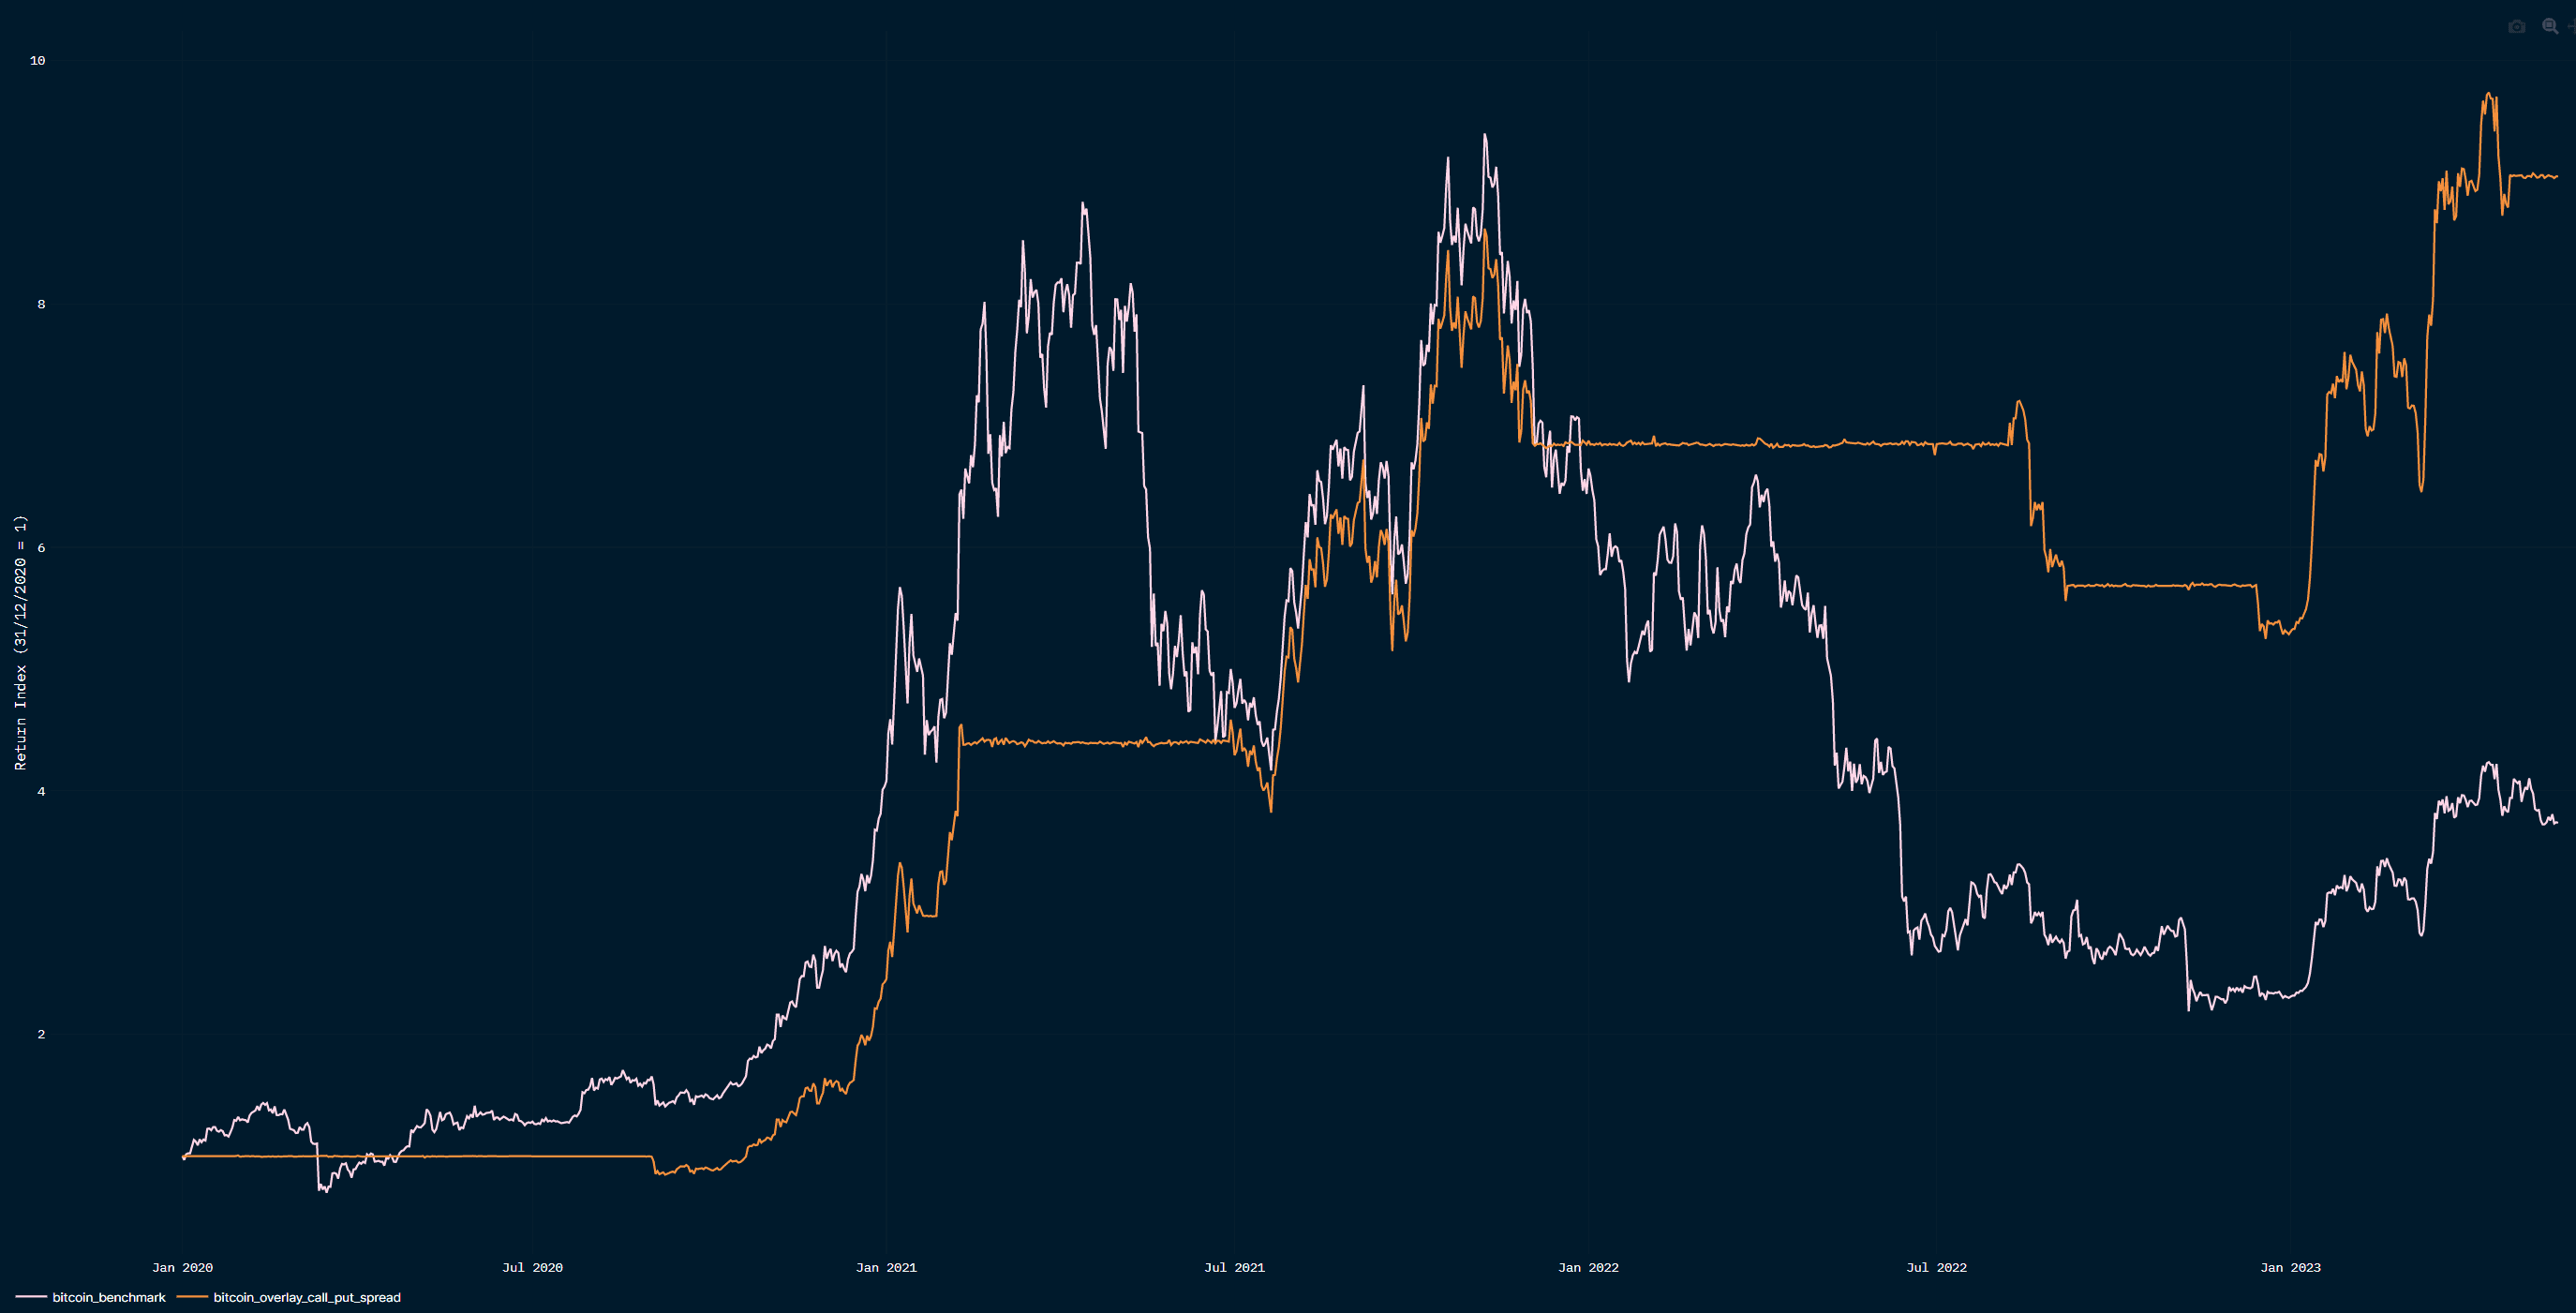
The best performing tactical indicator out-of-sample and live (live since January 2023) has been so far our BTC call-put spread, which measures the delta of the implied volatility of call options (higher if BTC option traders are more bullish) vs the implied volatility of put options (higher if BTC option traders are more bearish). The signal of this indicator is triggered a bit less than four times a year on average, and the ratio of average-return-to-max-price-drawdown has been 1.9x. The BTC call-put spread has turned negative BTC at the end of April last month.
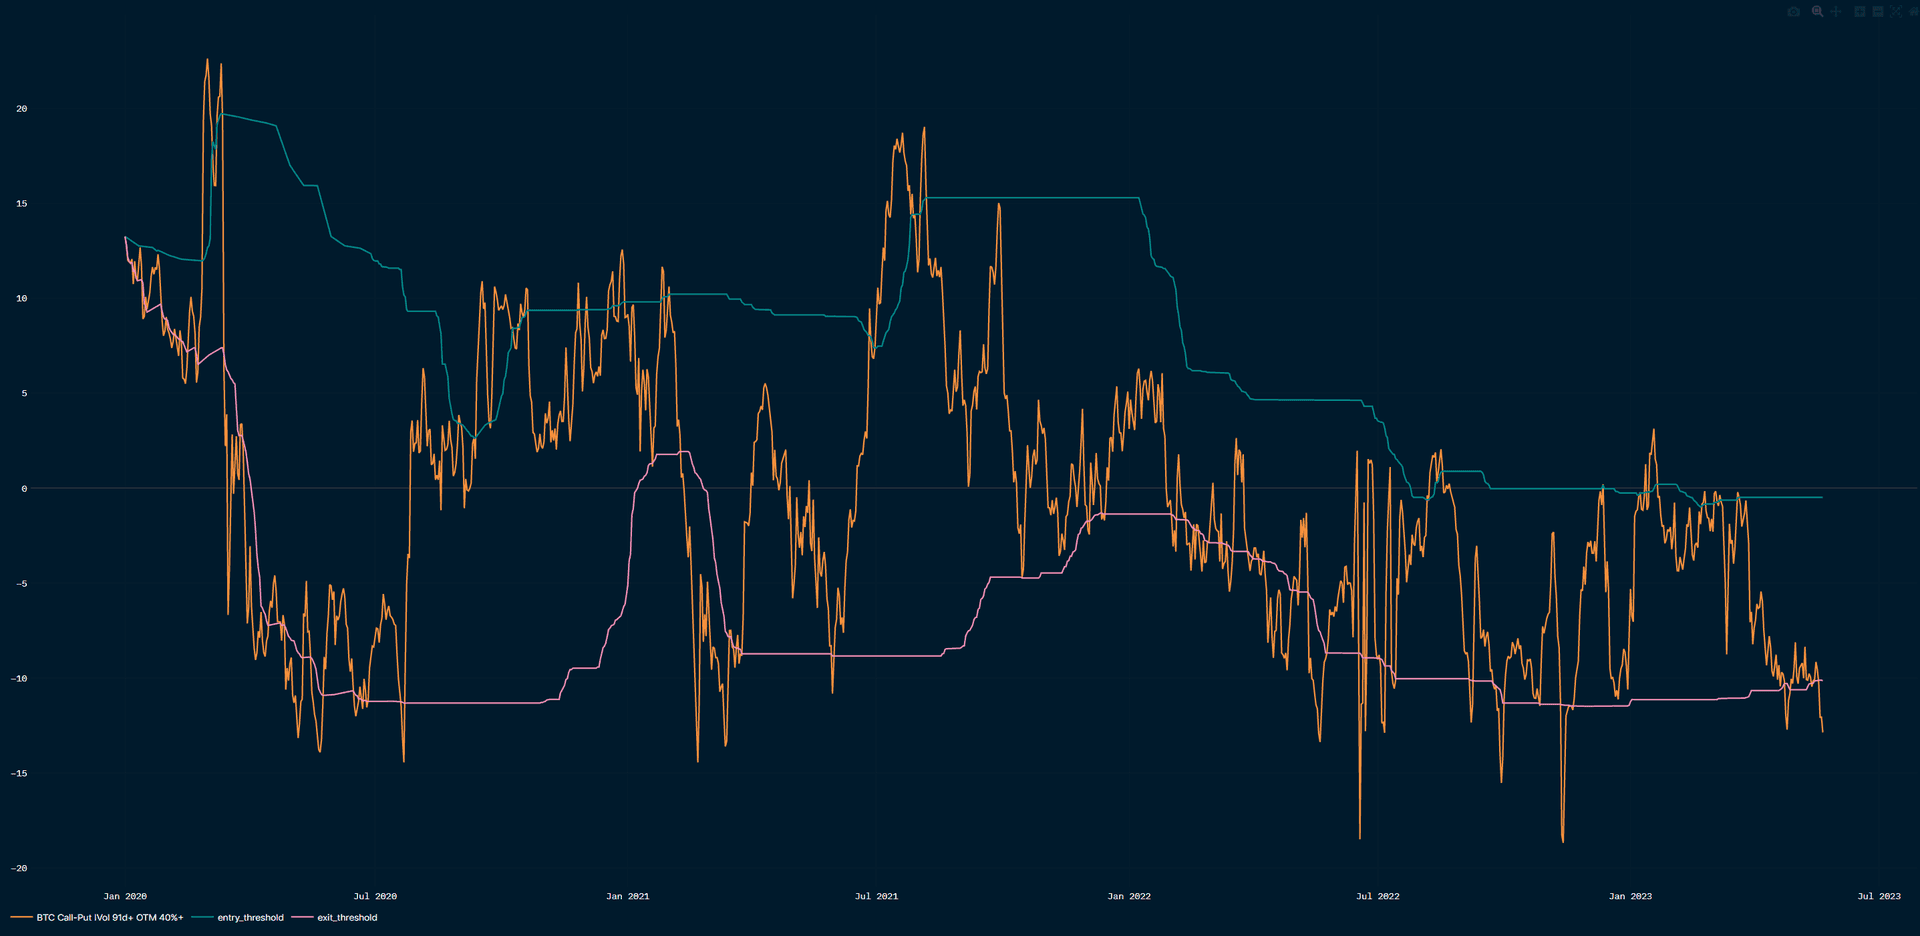
Another tactical signal (triggered 3.7 times per year on average), the BTC price momentum, measures the average price return of BTC over various lookback periods. It is currently hovering around zero, so neutral BTC.
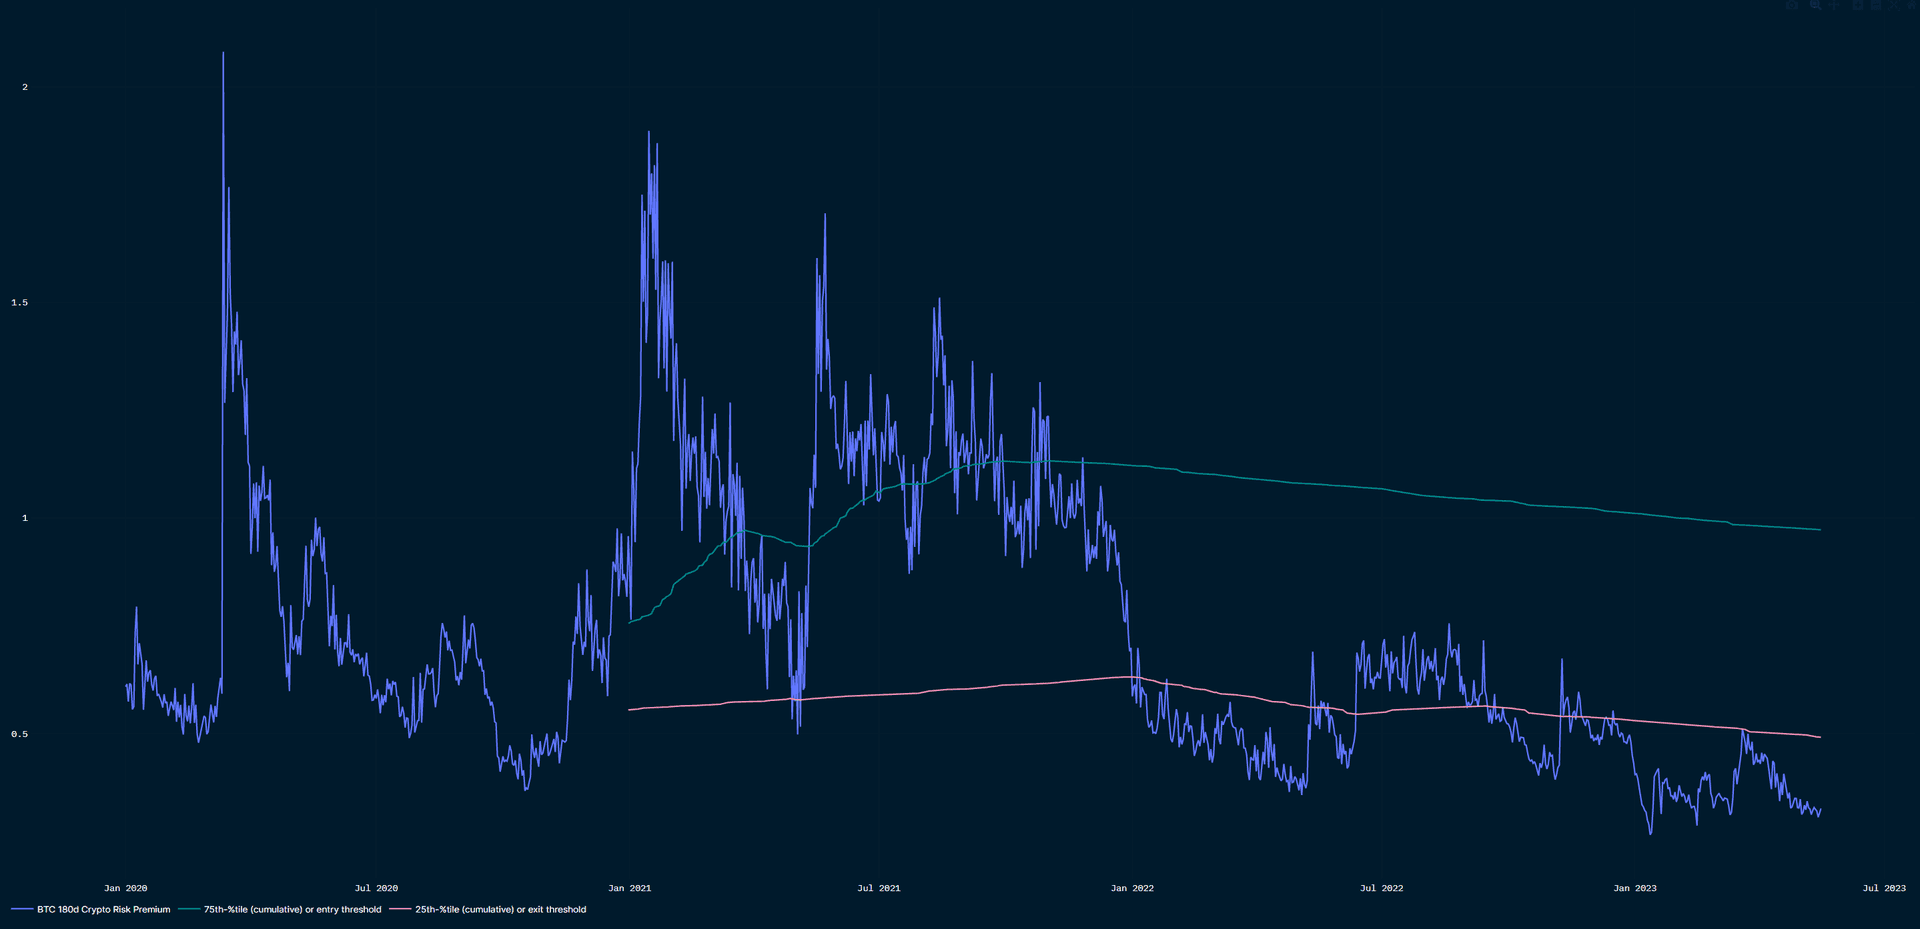
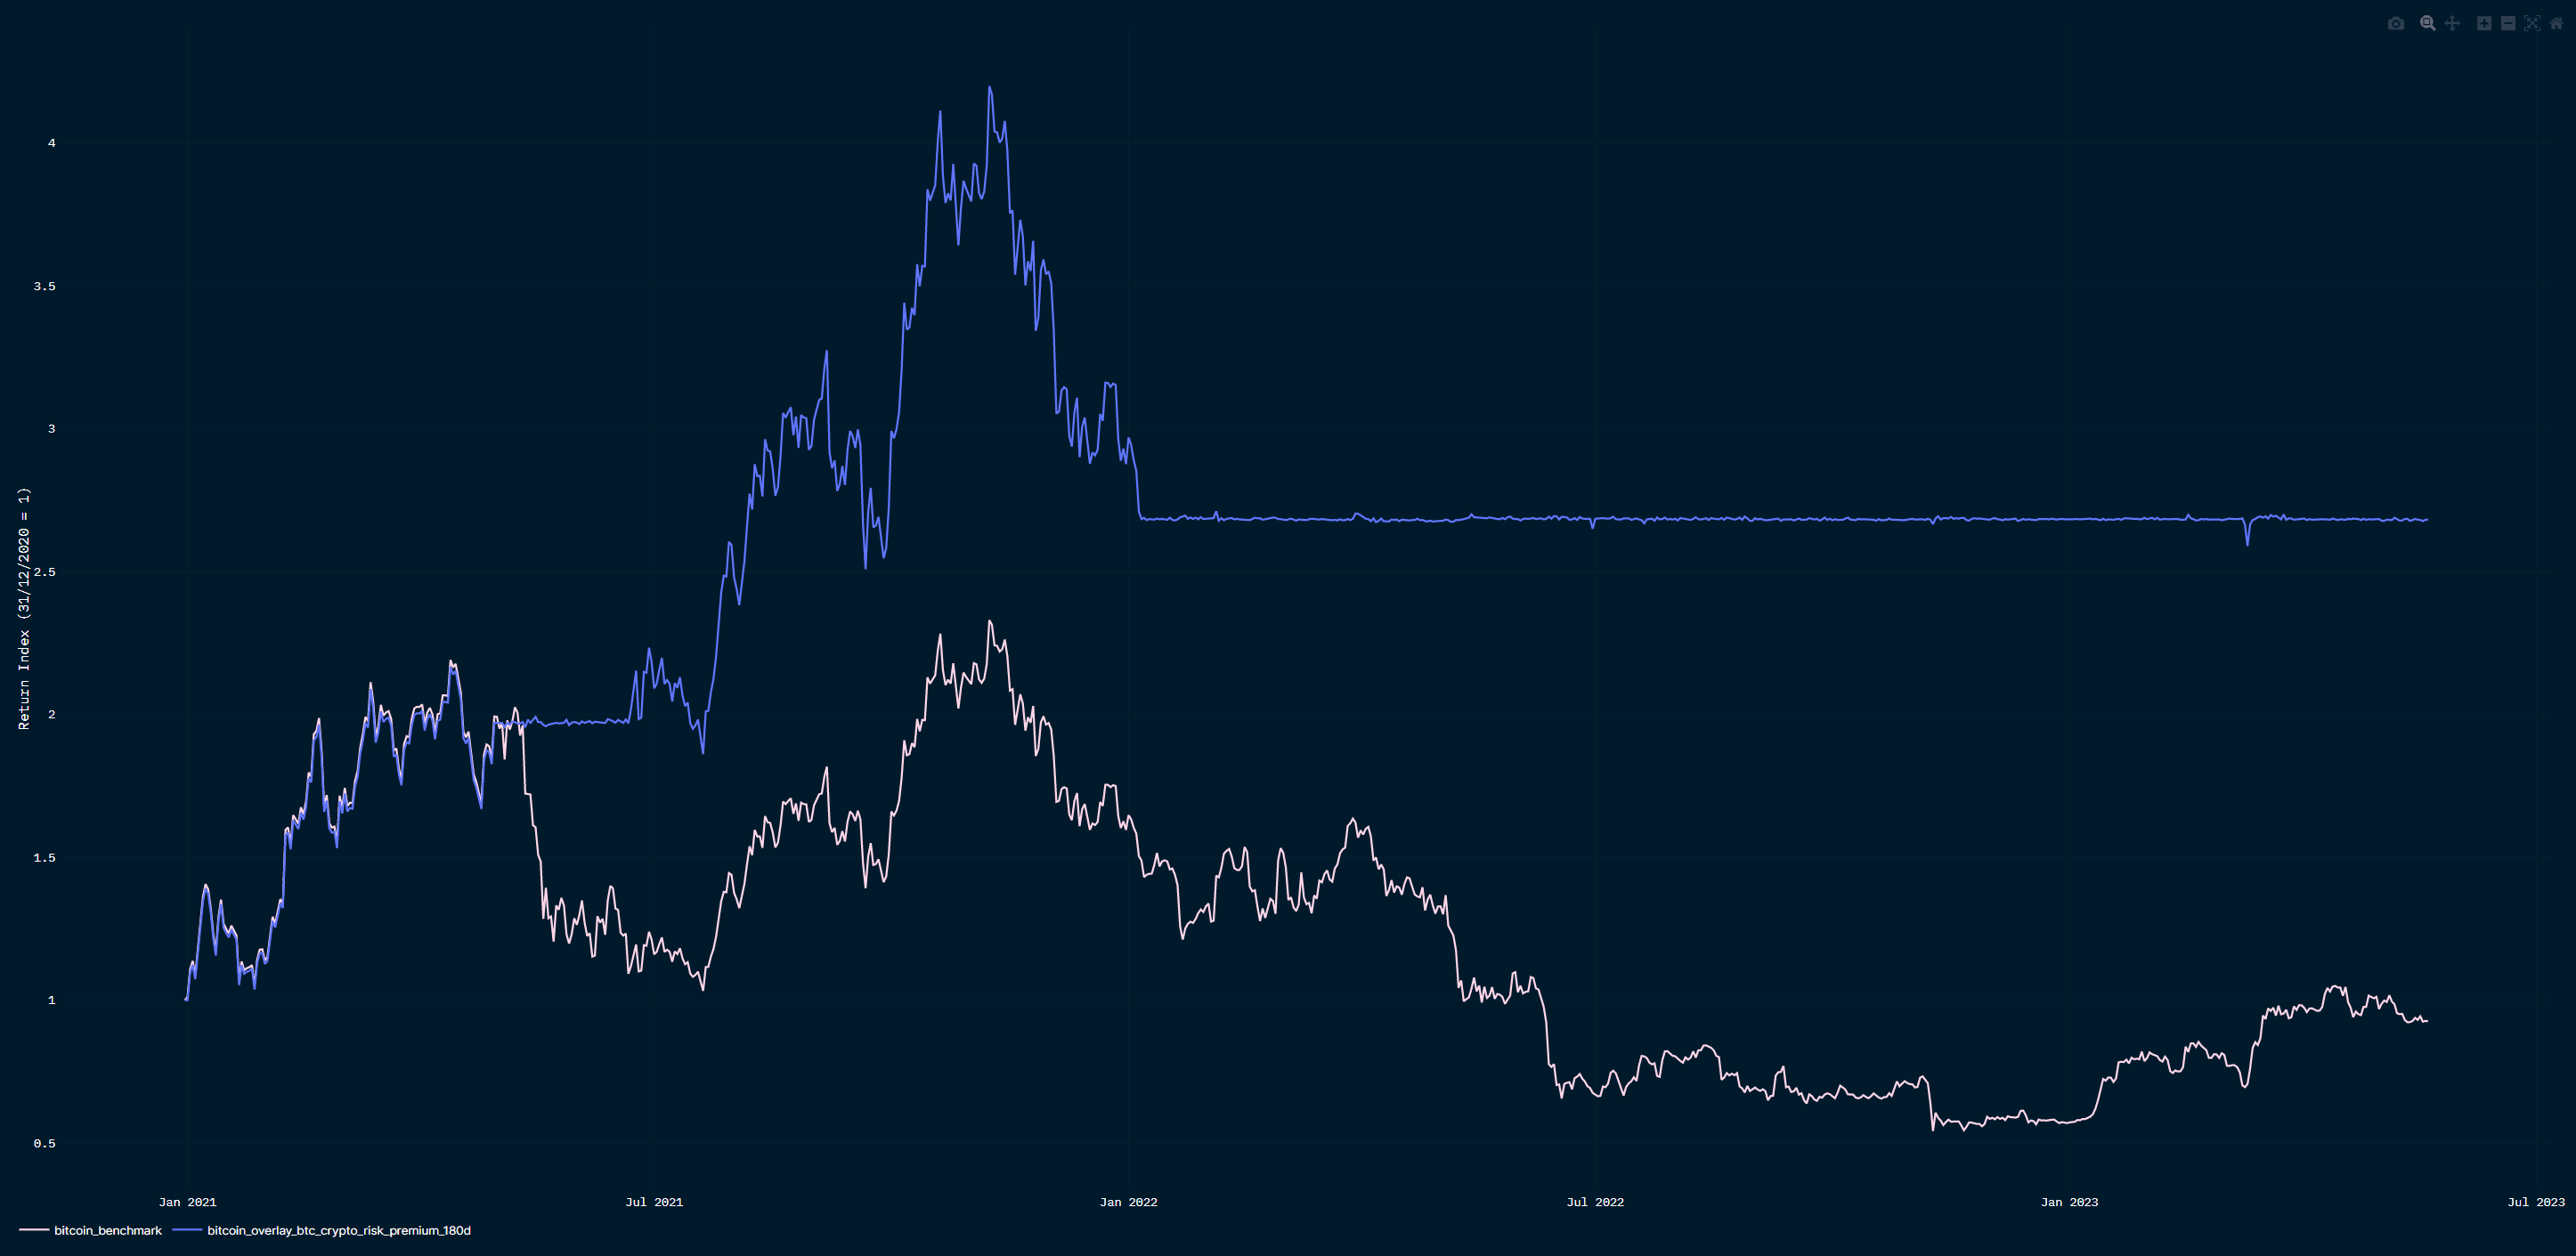
The third best-performing indicator, the Crypto Risk Premium (CRP), is a lesser-frequency one, triggered only 1.6x per annum on average. It goes risk-on after large jumps of CRP have occurred (the CRP is based on implied volatility of BTC and ETH options, it is a cousin of the VIX for equity markets). The CRP indicates that very little uncertainty is priced at the moment in crypto options, which is also true for S&P500 VIX and SVIX metrics. Consequently, any growth shock or recession could lead to higher volatility and lower prices in both crypto assets and US equities.
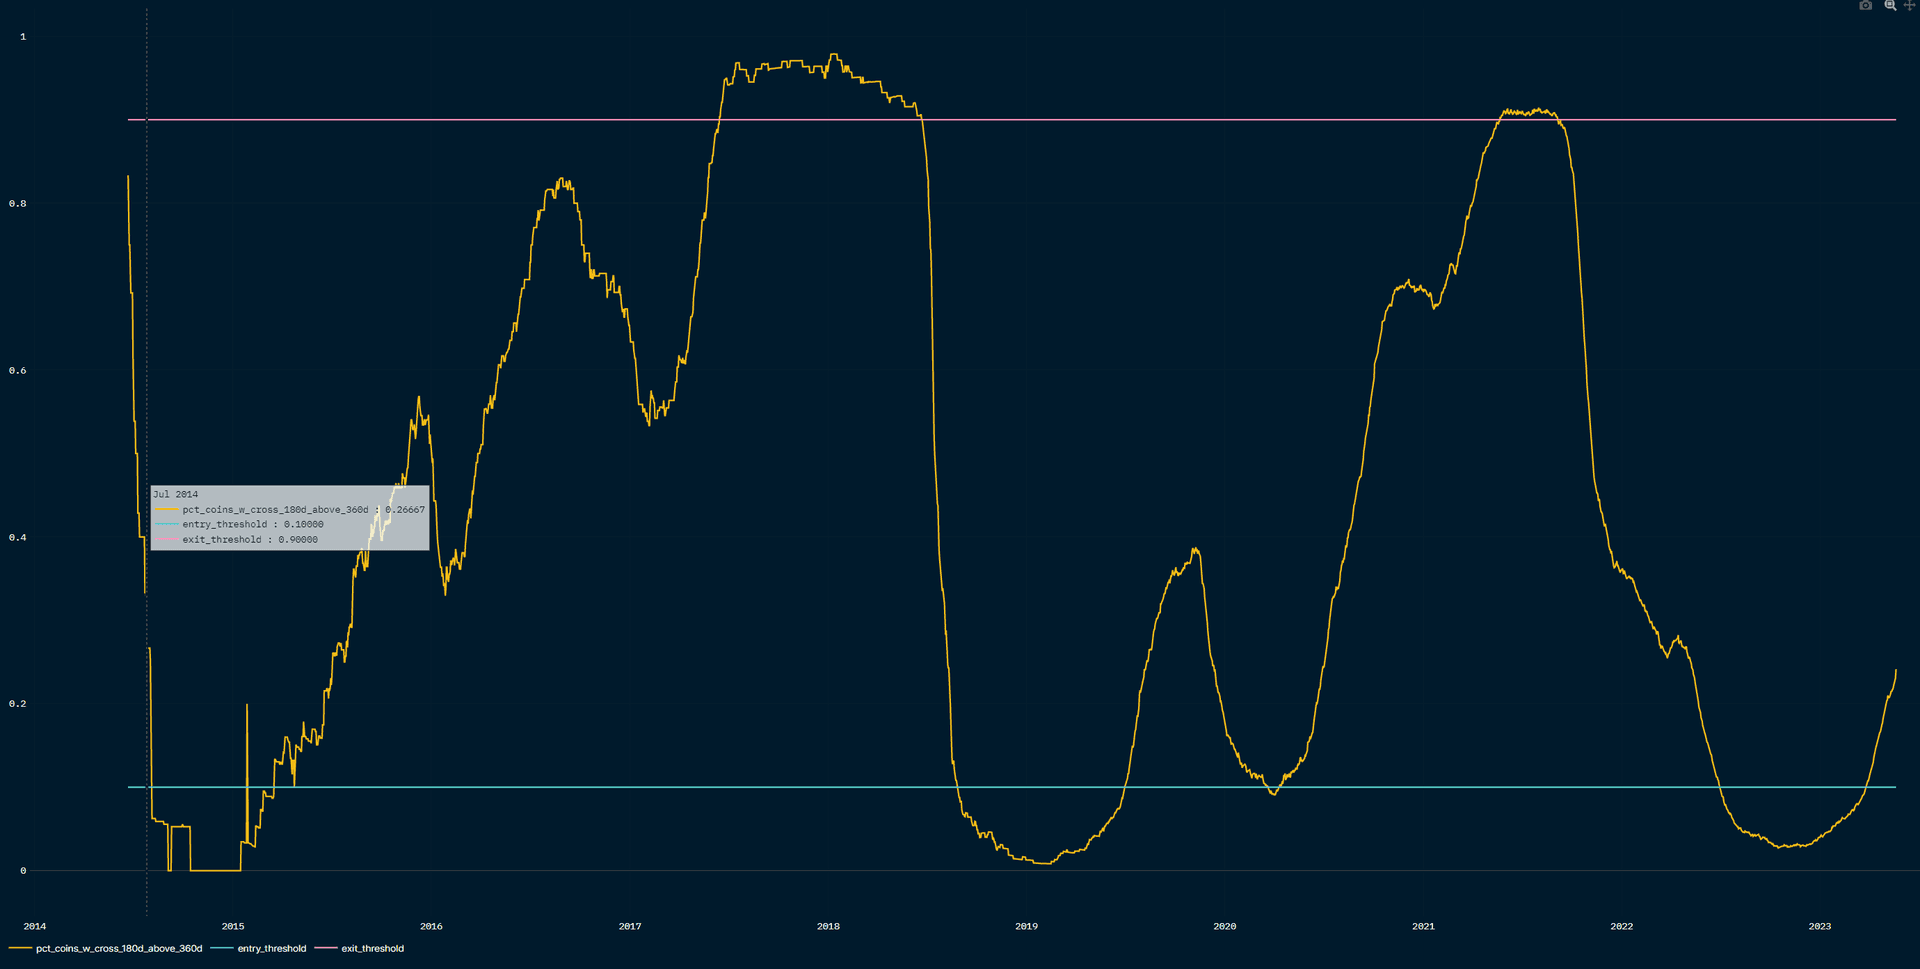
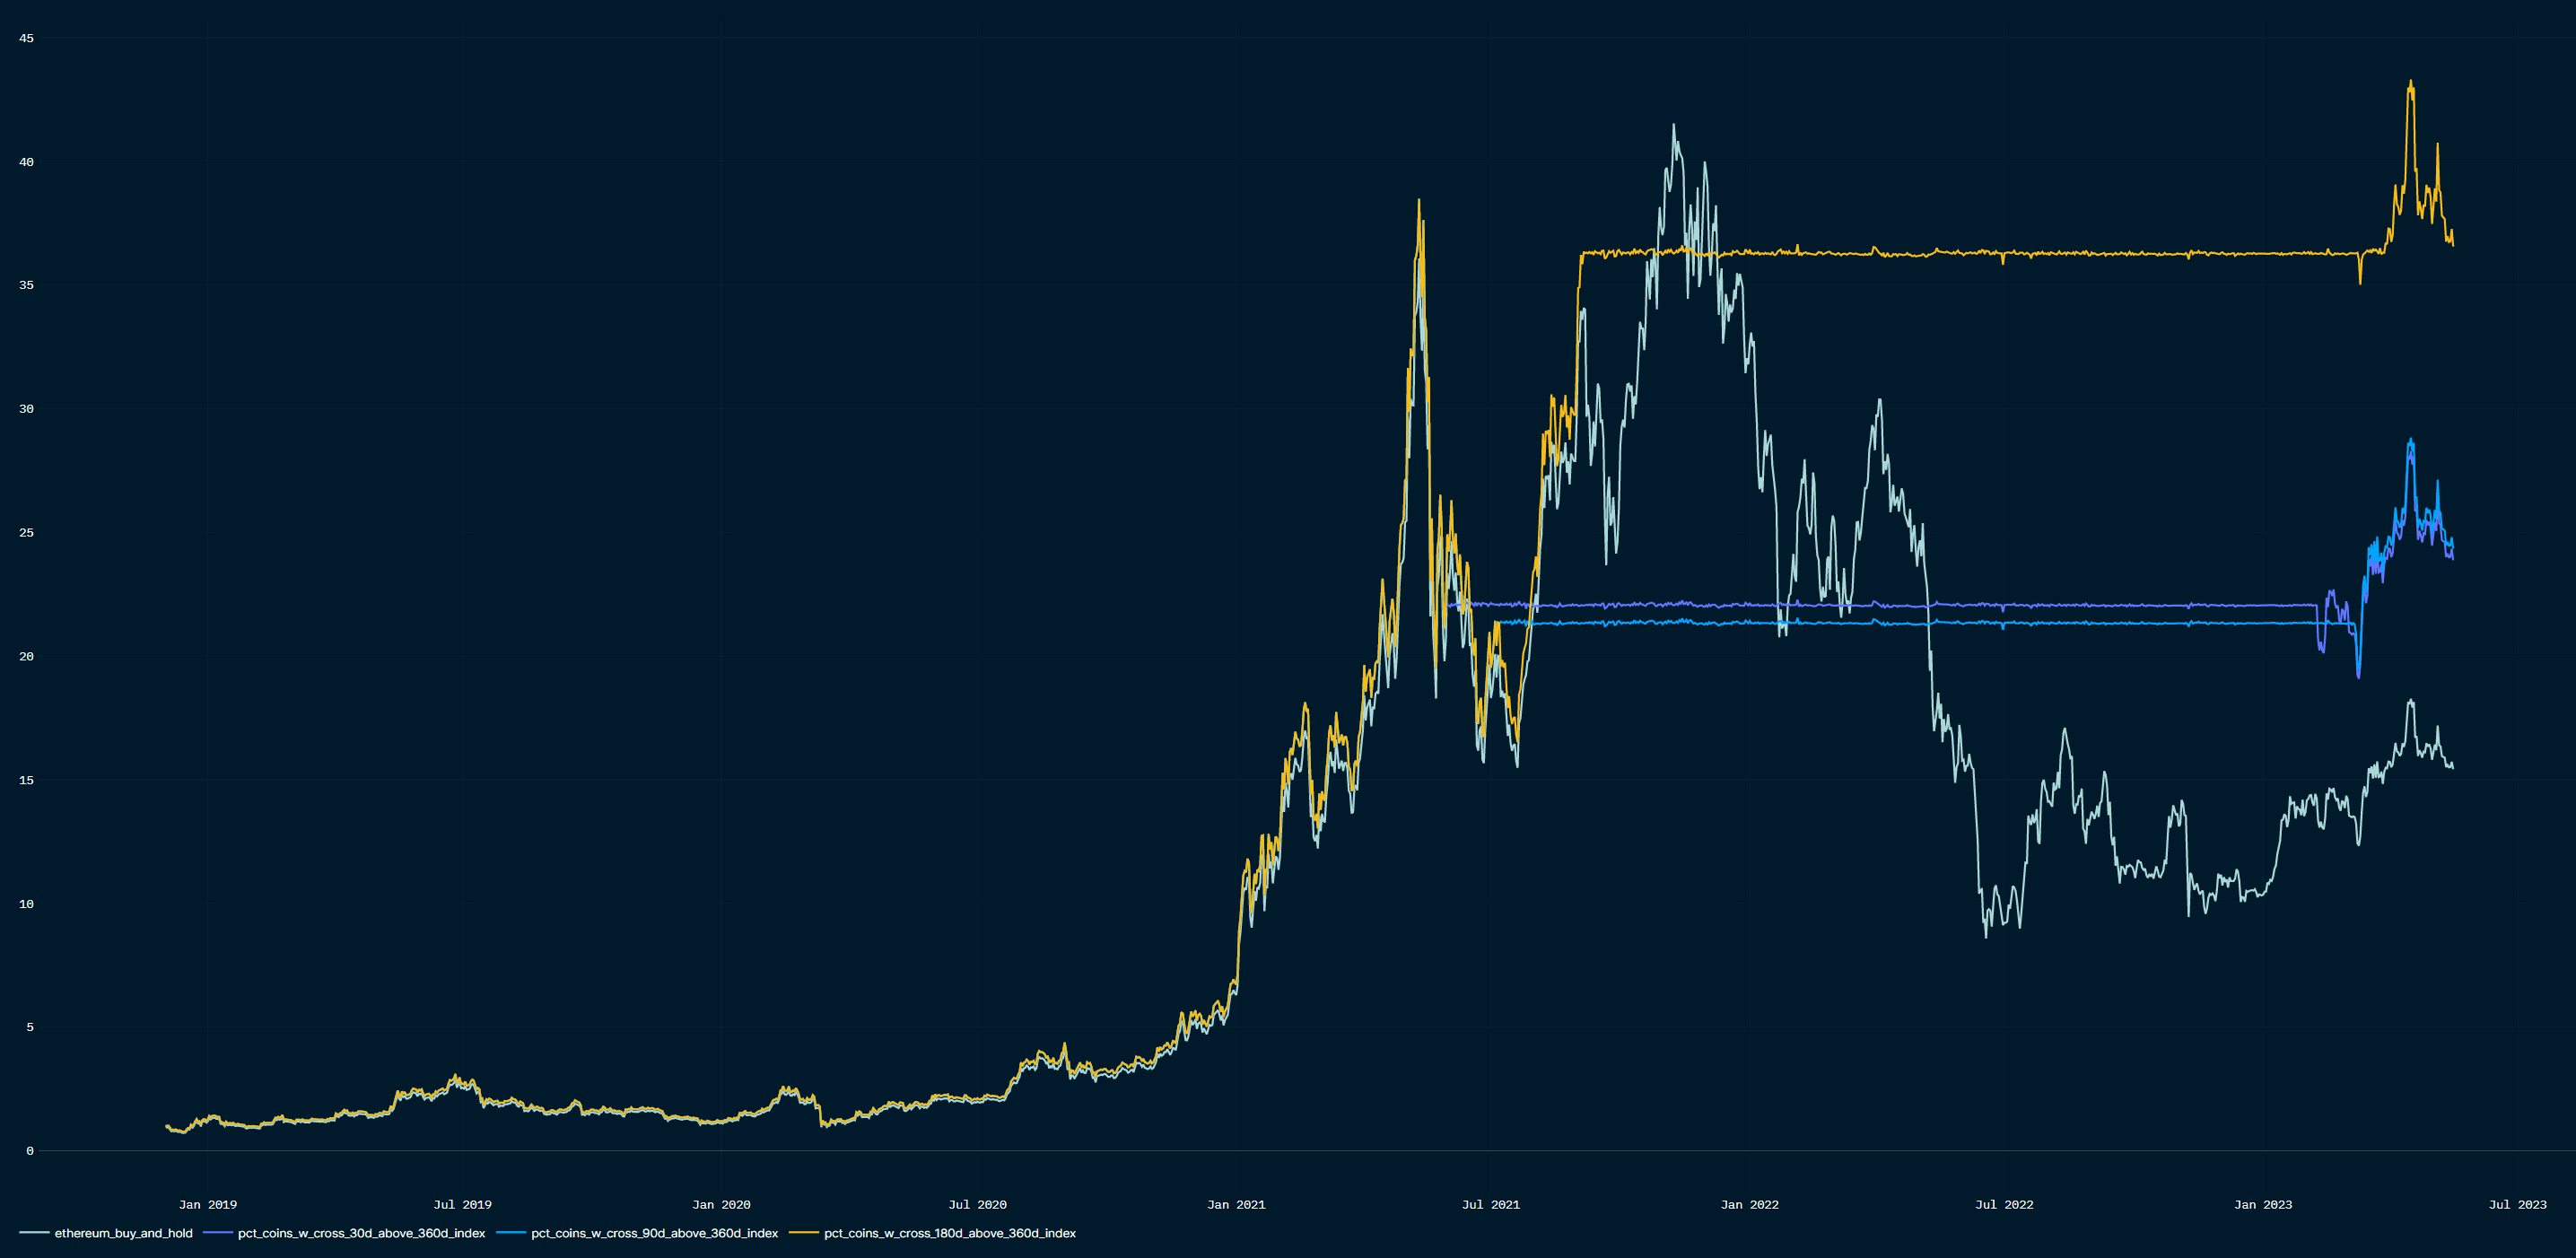
The fourth best-performing indicator is an even lower-frequency one (triggered every two years on average), that matches multi-year crypto cycles. It did a good job of signaling the major cyclical tops and bottoms in crypto prices since 2014. It captures the breadth of crypto tokens with rising moving averages. The breadth crept above 10% in March 2023. Historically this marks a shift of regime to bullish. Indeed, we have been in a range-bound regime for a few months, and have not yet revisited 2022 lows in BTC and ETH prices.
How to reconcile these different signals? We think that the short-term signals warrant caution: crypto derivative traders have been bearish, implied volatility keeps drifting lower, and BTC price momentum is hovering around 0 after being positive for most of 2023.
It is possible that we continue to range-trade and not quite revisit the lows of 2022 (which seems to be the message of the Breadth indicator). The short-term approach to these signals would be to stay cautious with entry points and in the allocation to crypto.
Risk-reward: crypto vs other financial assets
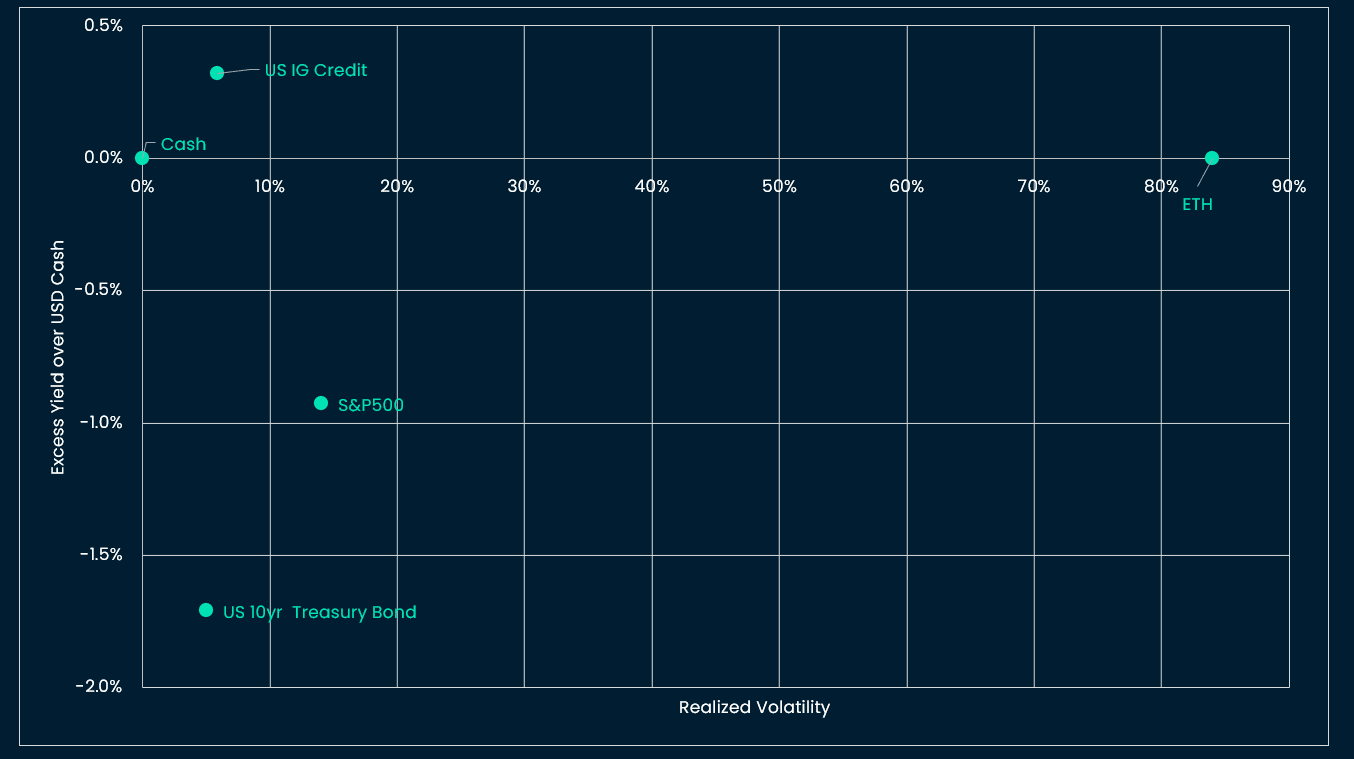
How are crypto fundamentals faring vs alternative financial assets? We summarize fundamentals by a simple risk-reward metric, and look at how much crypto would yield vs traditional assets in relation to the respective realized volatilities. Realized volatilities are calculated since inceptions of the respective assets.
As a proxy for crypto “reward” we use the ETH’s staking yield (5% as we write) and add a proxy for deflation (a generous -1% annual rate or +1% return). For realized volatility (84% annualized), we use a shorter period than for other assets, assuming a maturing time for ETH.
The chart below illustrates in the x-axis the realized volatility of each asset and in the y-axis the yield provided by each asset in excess of USD cash (USD 3-month bill). The only traditional asset that provides a positive yield cushion above cash is the US Investment Grade. The most negative excess yield is that of US 10yr bonds. ETH excess yield is slightly positive, at ~86bps, but, as the chart shows, the issue is the much higher historical riskiness of the asset (realized volatility), making the risk-reward not really attractive.
This would change if the US Fed were to cut rates, which would lower the opportunity cost of holding US short-term bills.
However, the probability of a Fed pivoting this year is not supported by the robust labor market nor by the ongoing stickiness of core inflation in the US and Europe.
Last week, FOMC speakers, including Chair Powell, have reiterated the guidance of rates high for longer e.g. a US bill likely to yield a bit more than 5% for longer. Future markets have, as a feedback to relatively hawkish FOMC speakers, delayed the pricing of rate cuts from September 2023 to November 2023. Our intuition is that rate cuts are likely to be delayed further, until growth deteriorates significantly. This deterioration is more likely to occur in 2024, in our view, because excess cash savings from the pandemic fiscal programmes will have probably reverted back to trend levels after 2023.
This week: Flash PMIs and US PCE inflation; Debt ceiling negotiations continue
Tuesday 23 May
Flash PMIs, of which: US Manufacturing (consensus 50), US Services (consensus 52.6), Eurozone Manufacturing (consensus 46.2), Eurozone Services (consensus 55.6). It will be interesting to measure the delta of improvement of Europe vs US and UK vs US, which have, year-to-date, favored EUR/USD and GBP/USD.
Wednesday 24 May
UK April CPI (consensus 8.3% YoY). Bank of England Governor Bailey speaks on the same day.
Treasury Secretary Yellen speaks.
FOMC meeting minutes (no major surprises expected)
Friday 26 May
US April core PCE (consensus 4.6% YoY)