Introduction
This report examines the top tokens in the respective categories by TVL. It looks at their YTD performance in 2023 and the impact, if any, of tokenomics on a project. DeFi tokens have often been criticized as ‘valueless governance tokens’ for their lack of fundamental value or utility. The expectation of future use cases such as a fee switch (i.e. Uniswap) help major governance tokens sustain large valuations. Some tokens have incorporated various value capture mechanisms whose efficacy is controversial. This report looks at governance, ve, and buyback models.
Coins Covered
The coins covered are Ethereum-based and selected based on high TVL. The dashboard looks at the YTD performance of the coins. This period was selected as it has been a general upward period in the market. It is a low timeframe, however, and shouldn't be used as a key judgement of token performance.
The tokens covered broken down by category are:
Governance
Tokens whose utility is primarily from governance.
- UNI (Uniswap)
- LDO (Lido)
- AAVE (Aave)
- COMP (Compound)
Value Accrual Tokens
Ve Tokenomics
Users lock tokens for a specified time period to receive protocol revenue.
- FXS (Frax)
- CRV (Curve)
- BAL (Balancer)
Buyback and Burn
Where cash is returned to token holders via market buybacks.
- MKR (Maker)
Revenue to Stakers
- LQTY (Liquity)
Looking at the chart above, there is no clear tokenomics model that has performed best on price this year. Compound, Lido, Liquity, and Maker have had the strongest performances, all with different tokenomic models.
For well-established DeFi protocols, fundamental performance is the key determinant. This includes trading volume (DEXs), TVL (DEXs and borrow / lending), and fee and revenue generation.
Interestingly, the governance tokens have outperformed value accrual tokens YTD. However, this is due to numerous variables, including Balancer skewing results as the only token that is down over the period.
Comparing Similar Projects
Note that there is no established way of valuing a DeFi protocol. For example, protocols like Liquity and Compound have value in being battle-tested decentralized protocols. In addition, products like Curve have value in being established and essential stablecoin infrastructure.
Notes:
- Based on Defillama data from 24th July
- P/S (FDV / Total Fees)
- P/R (FDV / Revenue Accrued to the protocol)
- P/S and P/R calculated based on fees and revenue annualized over the past 30 days making them rough estimates.
- The report does not take into account real revenue (revenue - value of incentives) but has selected more mature protocols that are further along their emissions schedule.
Lending Protocols
Note that there are various differences between the protocols and shouldn't be considered equivalent. For example, Frax offers a suite of DeFi products, whereas Compound only offers borrow/lending.
| TVL | FDV/TVL | Fees YTD | Rev YTD | P/S (FDV) | P/R (FDV) | |
|---|---|---|---|---|---|---|
| Frax | $810m | 0.73 | $9m | $630k | 34x | 375.78x |
| Maker | $5.14b | 0.21 | $34m | $34m | 9.93x | 9.93x |
| Aave | $5.77b | 0.3 | ~$42m | ~$6m | 15.27x | 107.53x |
| Compound | $2.2b | 0.27 | $12.4m | $1.3m | 25.8x | 236x |
| Liquity | $750m | 0.14 | $1.75m | $1.75m | 49.5x | 49.5x |
There is not a clear trend regarding the impact of tokenomics on price. Looking at P/S ratios, the projects with value accrual tokenomics have higher ratios (with the exception of Maker which has the lowest). Meanwhile, Compound’s token arguably has the least utility of all, yet has a higher TVL/FDV ratio than Maker and Liquity. However, Frax (leveraging ve tokenomics) has the greatest TVL/FDV ratio by far. That said, it has pivoted more towards LST than borrow / lending in recent times, which is a strong narrative.
This may loosely imply that value accrual tokenomics can have a beneficial impact on price relative to protocol performance (if judged by fees generated relative to market value).
DEXs
Note again the differences between the protocols and that they should not be compared as equivalents.
| TVL | FDV/TVL | Fees YTD | Rev YTD | P/S (FDV) | P/R (FDV) | |
|---|---|---|---|---|---|---|
| Uniswap | $3.8b | 1.51 | $496m | $0 | 20.66x | N/A |
| Balancer | $1b | 0.43 | $11m | $4.8m | 33x | 97x |
| Curve | $3.245b | 0.74 | $14.6m | $7.2m | 98.92x | 198x |
It appears that Balancer and Curve perform well relative to Uniswap, considering the massive disparity in fees and volume. This indicates that value accrual tokenomics may help support price in some protocols.
Lido
Lido has some of the most favourable metrics considered in this report. It is in its own category as it is a fully LST-focused protocol.
| TVL | FDV/TVL | Fees YTD | Rev | YTD | P/S (FDV) | |
|---|---|---|---|---|---|---|
| Lido | $14.72b | 0.135 | $308m | $30m | 3.14x | 31.4x |
Value Accrual Tokenomics
Do The Cashflows Hurt The Product?
The key question here is who the cashflows are taking money away from (i.e. LPs to ve lockers) and how consequential this will be to the protocol’s sustained success.
Key things to be considered are:
- It can divert funds away from key protocol contributors, e.g. LPs - thus potentially making the protocol uncompetitive for long-term liquidity.
- In the long-term, it needs to maintain/increase revenues (particularly applicable to ve tokens).
Liquity
Holders stake to earn a pro rata share of borrowing and redemption fees in ETH and LUSD. With this model, all revenue is returned to the stakers.
Maker
Uses a buyback and burn token model, with protocol revenues being used to buyback MKR from the open market and burn it. It also has had a general ‘down only’ price action against ETH since May 2021. However, the downward price action arguably cannot be attributed to tokenomics; but to general disinterest in the project from users, overly high previous valuations, and ineffective marketing. That said, the protocol has outperformed ETH this year. Stability fees (in DAI) can be used to buy and burn MKR.
Balancer
Balancer adopted a ve model last year, which was proposed in February 2022 and executed in late March 2022. It appears that the new token model caused an initial increase in price. However, since then, the token has underperformed ETH. This underperformance should not be attributed to the token model, however. Balancer has underperformed ETH since May 2021 and is not the market leader in DEXs. In fact, the veBAL may have been a beneficial development for the protocol, creating additional demand with protocols such as Aura and a whale called ‘Humpy’ in the BAL wars. Therefore, it is difficult to gauge the impact of the shift; however, there is an argument that the price would be faring worse had they not taken this approach.
Standard Governance Tokens
Uniswap
UNI’s current fundamental value is derived from governance. There is often discourse around the ‘fee switch’, and some of the token's value is arguably from the market pricing in that a fee switch may be implemented in the future. Uniswap is extremely dominant in the market and continues to ship improvements such as V4 and UniswapX. Despite these, its price does not react, which may be attributed to uncertainty around its future value capture.
Lido
LDO has experienced strong price performance this year. However, this can be attributed to the strength of the LSD narrative. One train of thought is that the token itself could perform better with different value capture.
Compound
COMP is up more than 2x since the start of the year. Its token performance has exceeded its TVL growth by ~40%. However, this could also be the market identifying an undervalued opportunity, and its value is in its battle-tested code that could make it one of the beneficiaries of real-world adoption.
Argument Against Value Capture
However, there are actually strong arguments against this for both UNI and LIDO. Protocols like Lido and Uniswap have avoided sharing fees with token holders which has arguably been a contributing factor to them dominating their markets. Uniswap fees go to LPs rather than token holders, meaning the platform has successfully attracted liquidity and thus volume. Its biggest competitor, Sushi, chose its token above LPs and has subsequently been down only in market share compared to Uniswap. However, this is only one component, and most of Uniswap’s success can be attributed to the team consistently shipping excellent and innovative product and severe internal problems at Sushi.
Meanwhile, Lido charges minimal fees (10%), and Rocket Pool charges slightly higher (14%). Although many in the Ethereum community prefer Rocket Pool as a concept, Lido has a 10x larger market share that shows no signs of weakness. Lower fees trump value accrual tokenomics if they make the product better.
Thus, there are strong arguments against channeling fees to token holders for many protocols. This is because many are still under development. The development of the protocol is more important than returning revenue to holders in the near term. As the protocol solidifies and dominates with a clear moat, ways in which to return cashflows to token holders make more sense. This model applies especially to protocols aiming for market dominance, like Lido.
Therefore, the impact of value accrual models needs to be considered on a case-by-case basis for each protocol and its stage of development.
Key question to ask: Who is losing out with the redirected fees? Who is bearing the cost? What impact will this have on the future growth of the protocol?
Pendle Case Study
Pendle launched its v2 on November 29th with a variant of the ve model taken from Solidly’s ve(3,3). However, it is more similar to the original ve model in practice, but changes include that it incentivizes voters to direct liquidity to the most productive pools i.e. with the greatest volumes. How? Voters are rewarded with trading fees from the pools they vote for, encouraging more active engagement and logically incentivizing the best pools. The token has since experienced a parabolic price run.
To be clear, tokenomics revamps do not mean price runs (ask Balancer). The TVL and price improvements can largely be attributed to significant improvements in the product itself. However, the tokenomics aspect of it cannot be ruled out as inconsequential.
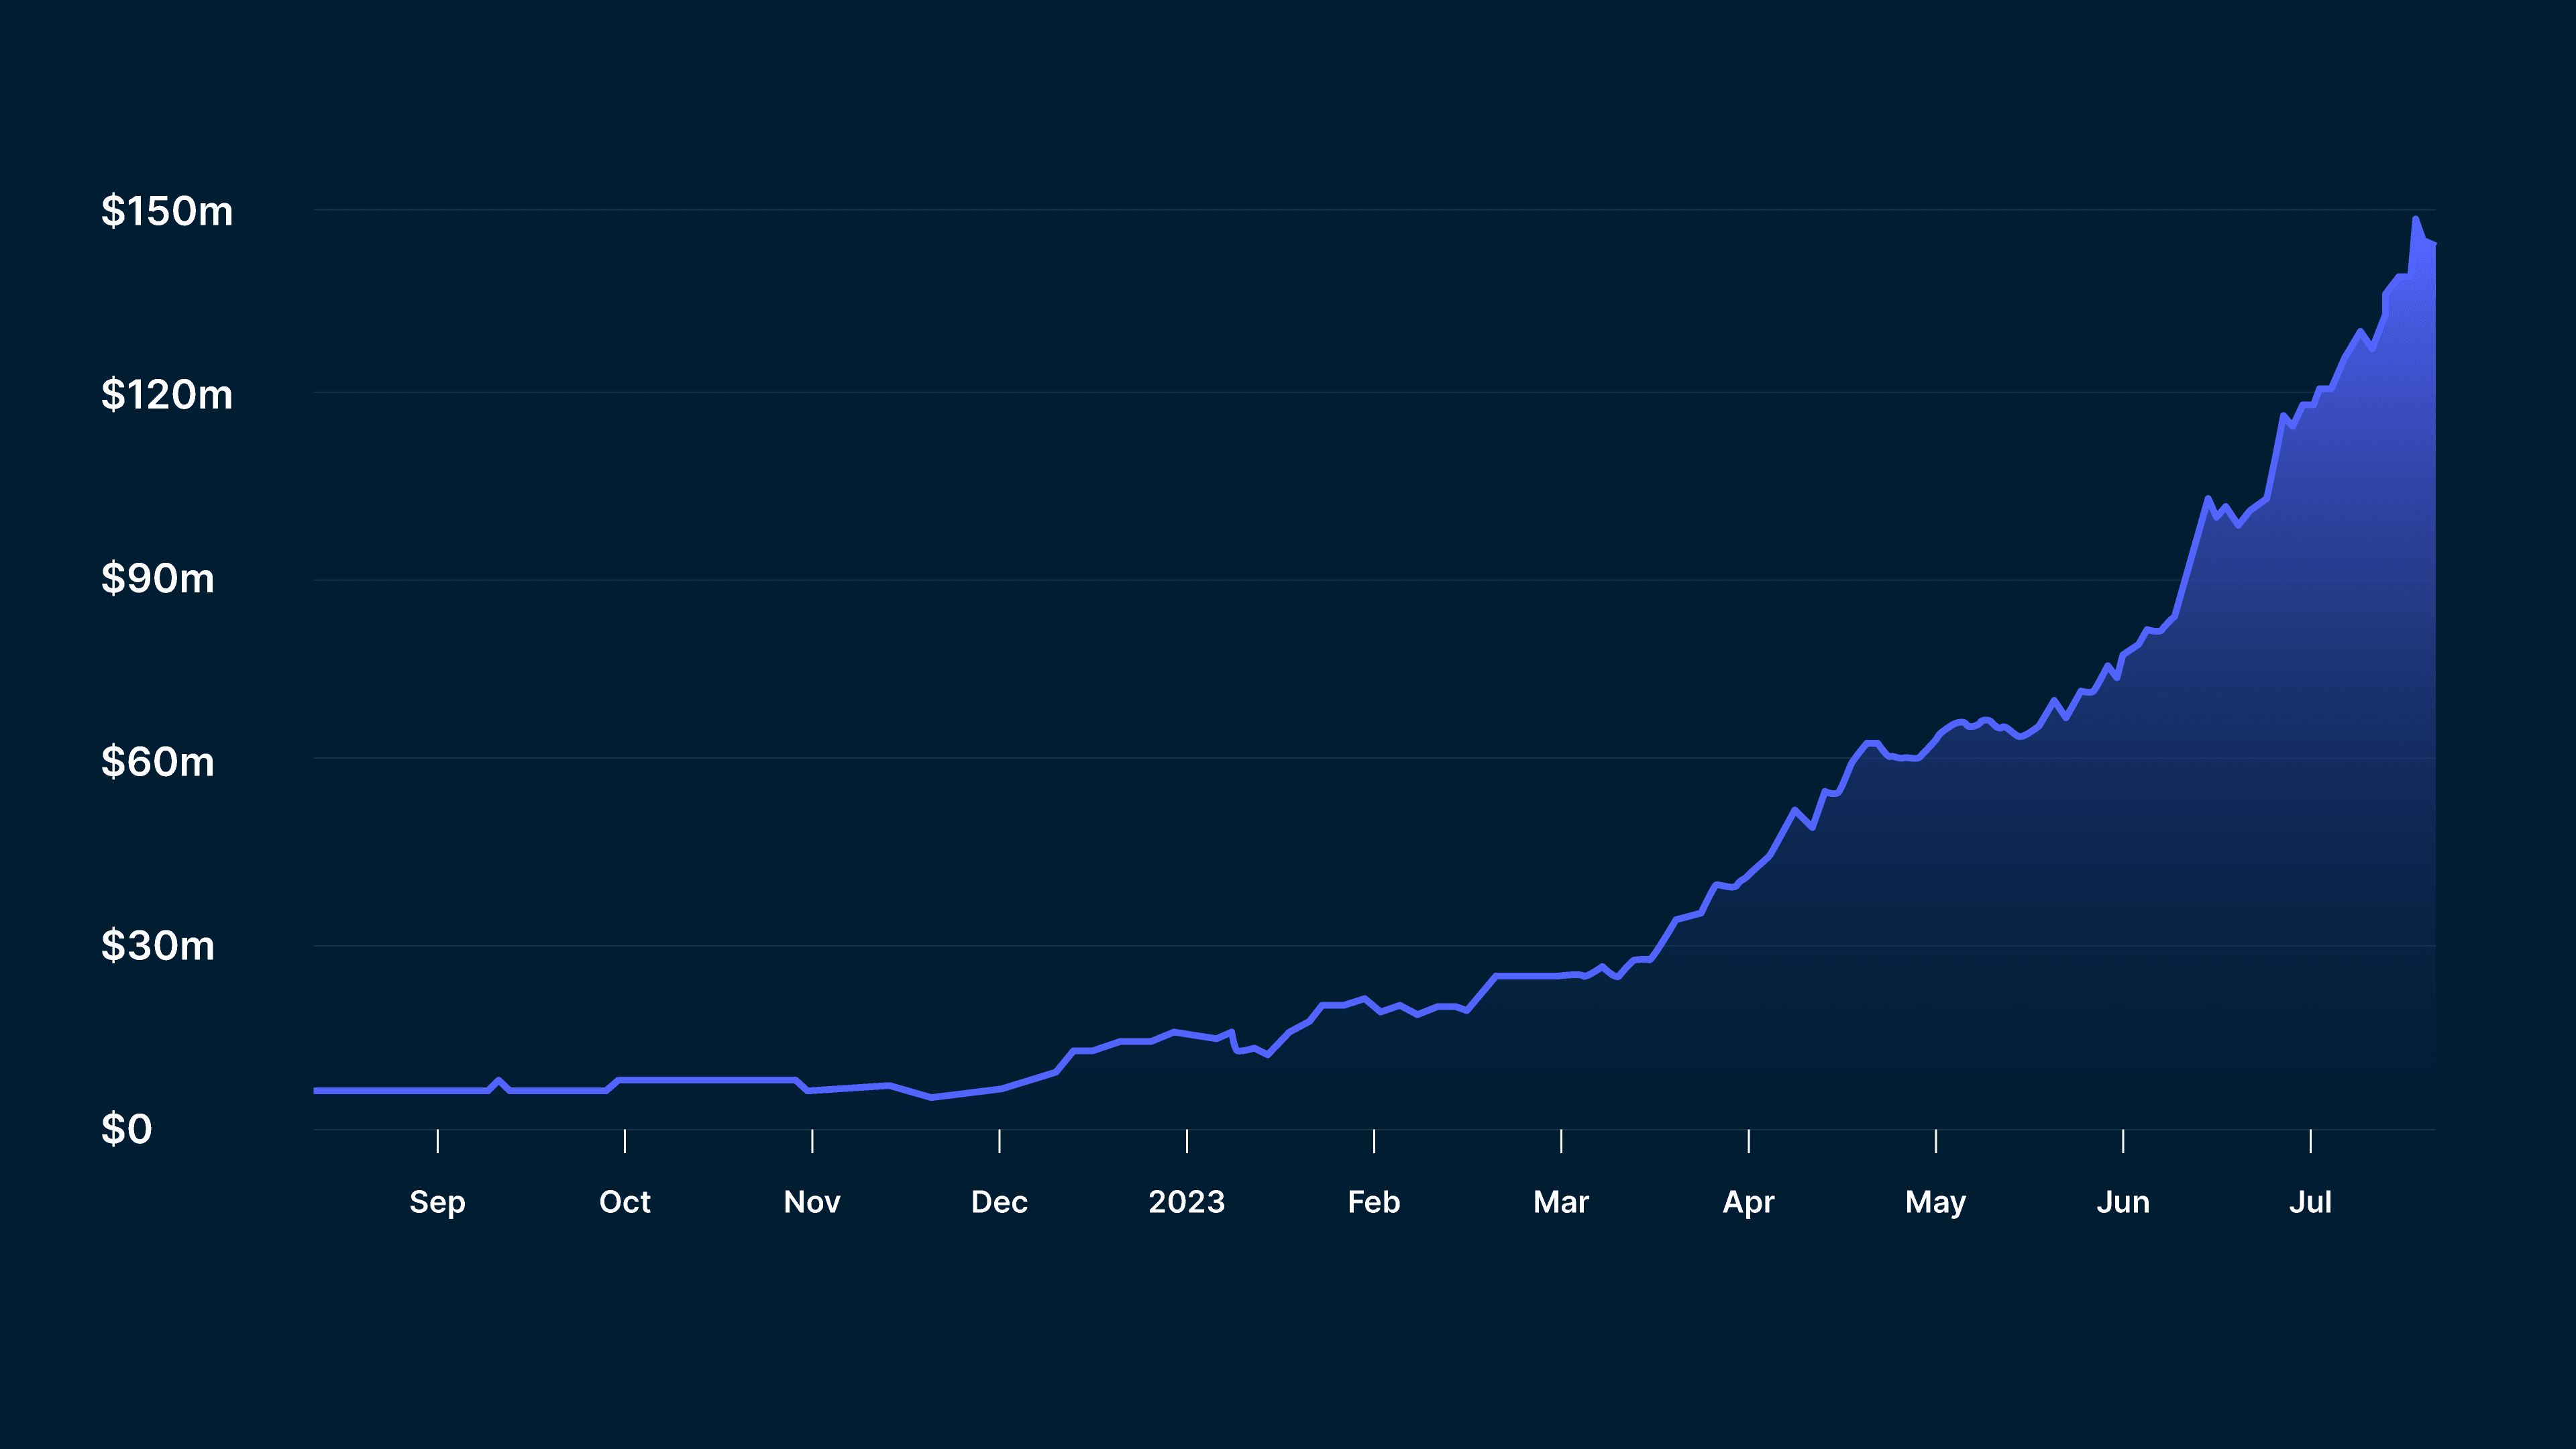
The chart below shows the TVL growth over the same period. Notice how TVL started increasing in December (essentially when v2 launched). This TVL growth was then followed by price action growth. Pendle actually does have an innovative product and has few competitors in the space, so large TVL and price growth is not surprising.

Are Ve Tokenomics Effective?
Ve tokenomics make the token a core part of the product itself and need to generate consistent cash flow to sustain themselves. A protocol must consider whether or not it can justify giving token holders revenue in a crowded and competitive market.
Pendle experienced significant success due to its greatly improved product, not because it strictly moved to ve tokenomics. However, the rationale for the ve tokenomics may have been a contributing factor. It does create some fundamental demand for the token, which in turn attracts TVL to the protocol. However, to maintain this in the longer-term the protocol needs to generate satisfactory and consistent revenue.
Emissions > Revenue
Emissions exceeding revenue does not necessarily mean that a project is unsustainable. Ve Protocols logically can suffer from a negative flywheel death spiral where:
Lower TVL = lower volume = lower veAPY = lower CRV price = lower TVL (less incentives)
While Curve’s revenue is less than CRV emissions, there is more utility to CRV than just the revenue from emissions. This includes:
- Governance value over emissions (supporting stablecoin projects)
- Speculation and future protocol growth
- Access to bribes
- Locking CRV to vote on emissions
Taking this to be true, it still begs the question of whether or not these protocols are still highly overvalued.
Upcoming Ve Tokens
Yearn is expected to launch veYFI soon. It will be interesting to see how this affects the protocol's performance. The emissions of YFI have expired, so any emissions are derived from buybacks. While the market may react positively to the implementation, positive price action likely won’t come from this as the market has been expecting veYFI for over a year. If it improves the functioning of the protocol and causes a healthy amount of YFI locking, then it may have a net positive impact on the protocol and the token price.
However, the functionality of the protocol and its usage will be the determining factors here. For the model to work, it will be necessary for the protocol to increase and maximize its revenue. This will make it worthwhile for more YFI locking and also more buy pressure from buybacks.
What ve Tokens Will Survive?
The only ve protocols that can survive will generate sufficient fundamental revenue to justify doing so and to support its price. While a protocol may generate good revenue in its early days - this is often due to the incentivization of activity on its platform with high token emissions. As these inevitably fall, it relies on the protocol generating sufficient and even increasing revenue to survive.
This is a reason why Curve Finance launched crvUSD; to increase liquidity, trading volume and thus revenue on the platform to continue incentivizing veCRV. Curve’s challenge will be to maintain / grow its activity and fees to maintain the price of CRV and continue incentivizing locking. Its continuous emissions will need to be met and offset by protocol fees and willingness to lock. Yearn, on the other hand, has no emissions, so will need this fundamental revenue to buy back YFI and redistribute to lockers. Thus, it is important for the protocol to securely grow its revenue sources to adequately reward token holders and lockers.
There appears to be no ‘best practice’ for tokenomics. Although some governance tokens that return no cash to holders are criticized, this model may actually be best suited to their current requirements. For example, Lido and Uniswap have achieved near monopolies which could better enable them to competitively implement value accrual mechanisms in the future.
Meanwhile, other protocols such as Curve and Maker have token models that seek to return cashflows to token holders. As incentives further dwindle, the ‘real revenue’ and profitability of such protocols will come into question. Some protocols such as Pendle Finance have performed very well since implementing ve tokenomics, whereas others such as Balancer have not (although would have arguably done worse without it). ve Protocols price performs well if considering the fees and revenue generated relative to valuation.
Token models reliant on cashflows will require consistent and ideally increasing cashflows to support their price and sustain the protocol in the long term. Protocols that charge fees will need to ensure that they can still remain competitive in the market.


