TLDR
- Smart Money generally outperforms the market in terms of profitability with their trades. This report will dive deeper into Smart Money behavior and other top wallets to explore some of the on-chain signals Nansen gives its users.
- Looking at token balances alone is insufficient in determining Smart Money behavior since it can be skewed by actions such as staking or depositing/withdrawing from liquidity pools.
- Token God Mode - Smart Money allows you to drill down to specific transactions and filter for inflows/outflows from CEXes, liquidity pools and smart contracts individually which is a good complement to Smart Money Token Balances.
- Apart from Smart Money behavior, external factors such as token unlocks, token inflation, macro environment and trending narratives have a significant impact on token prices - which the report looks into at the end of each case study.
- Overall, the trend shows that certain entities have consistently performed better in terms of being profitable - such as Alameda Research as shown in the examples below.
Introduction
This report will cover tokens that have done exceptionally well in the past year. Specifically, it will attempt to uncover the reasons for their success by looking at Nansen on-chain data prior to the price action. Along the way, there will be tips on how to better utilize Nansen dashboards to (perhaps) pick out the next successful token or to simply defend positions from volatility.
Tokens used as case studies for this report were picked based on 2 core metrics that were representative of it being a success:
- An increase in token price by at least 5x over a period of 3-5 months
- To filter down for tokens with high profitability
- Market cap greater than or equal to $100m (during the period of analysis)
- To ensure that the project had enough traction for an analysis of Smart Money to be useful
To aid in the analysis, the report focused on Nansen’s Smart Money wallets to look at their actions before, during and after a rally on a certain token. Smart Money covers entities, whales and individual traders who have a proven track record of being profitable. Hence, their actions could stem from being able to identify opportunities early and exiting a position at an opportune time, which can be uncovered on-chain. A detailed explanation of Nansen labels can be found here, where Smart Money is further segmented per industry.
Besides Smart Money, the report also looked into background information about a token - such as their early investors and their cost basis. Such information can be found under each protocol’s documentation or on websites such as Cryptorank (under “Token Sale” section). Using Nansen Portfolio will give an overview of a wallet’s assets across all chains, historical activity and positions in liquidity pools or staking contracts with its unlock dates.
The tokens covered in this report are SAND, MPL and CVX.
The Sandbox (SAND)
Overview
SAND is a utility token used as the basis for all transactions and interactions in The Sandbox ecosystem. The Sandbox metaverse allows users to build, own and monetize their gaming experiences on the Ethereum blockchain.
The token launched on August 14, 2020 with a maximum supply of 3,000,000,000. The table below shows a summary of allocations and the prices that respective investors bought at:
| Category | Allocation | Price per SAND (USD) |
|---|---|---|
| Seed Sale | 17.18% | $0.0036 |
| Strategic Sale | 4% | $0.0050 |
| Binance Launchpad | 12% | $0.0083 |
| Foundation | 12% | N/a |
| Team | 19% | N/a |
| Advisors | 10% | N/a |
| Company Reserve | 25.82% | N/a |
Source: Binance
Tokens for investors from the seed and strategic sale, as well as team and advisors were locked for 1 year with regular unlocks scheduled till 2024. The chart below shows the token release schedule for SAND:

The token had been trading below a dollar since it was launched, until the project gained massive traction at the end of 2021 - with the price of SAND rising from $0.66 on Oct 1 to its peak of $8.40 on Nov 25, achieving a 12x in just under 2 months.

Catalysts
There were many events that happened leading up to the price rally that helped to propel SAND’s price action.
On Oct 29, Facebook rebranded to Meta which sparked a rally in metaverse coins including SAND. Furthermore, the announcement of a $93 million Series B round led by SoftBank Vision Fund on Nov 2 continued the positive momentum. Following the raise, the price of the token tripled in 5 days to its first peak of $3.03 on Nov 3.
With Sandbox Alpha’s launch planned for Nov 29, the long-awaited event further propelled SAND’s price to its all time high of $8.40 on Nov 25.
Smart Money
General Smart Money behavior

From the chart, it shows that Smart Money has been slowly accumulating since July 2021. Smart Money balance saw the greatest increase in Sept - from 6.19m to 16.5m. The sharp decrease in balance happened from Nov 2 - 3 - from 15.4m to 5.9m, which coincided with SAND’s first price peak at $3.03 on Nov 3. Smart Money balance continued to decrease with SAND’s run up in price to $8.40 on Nov 25, reaching a low of 2.5m on Jan 12.
Diving deeper into the sharp decrease on Nov 3, it was attributed to a single transaction from 🤓Sandbox to 🏦Binance: Deposit of 10 million SAND. Based on Nansen data, the address is “TheSandboxGame" on OpenSea.

The price of SAND fell shortly after that transaction to Binance, to a low of $2.29 on Nov 11 before rallying to its all time high on Nov 25. It is hard to determine whether the 10 million transaction had significant impact on the price, but it is clear that most Smart Money wallets did not sell at the first peak; instead most sold during the period of SAND’s rally to its all time high.
Analyzing the token balance held by Smart Money as a percentage of total supply vs. price - it shows negative correlation as Smart Money held a higher percentage of supply when the price of SAND was low as compared to higher prices. In contrast, the number of Smart Money holders vs. price had a positive correlation as the number of holders went up as price increased. This could suggest that while there was increasing interest from Smart Money as SAND gained traction, they were also de-risking by reducing the amount of SAND in their holdings.

Top transfers
To pick out potential opportunities, it would be important to look at all of Smart Money movements prior to a token’s rally as they may have asymmetric information to “front-run” these trades. Looking at the period of Sept to Nov for SAND, the Top Transfers for Tokens section under Smart Money shows that several Smart Money wallets were accumulating before the run-up. Prominent wallets include “Wintermute Trading” and “ParaFi Capital: Fund”.
It is important to note that for transactions from LPs to a Smart Money wallet, it would mean that they are removing liquidity from the pools. Hence, it does not signal accumulation but rather it could likely be a sign of selling. Therefore, it is important to check the individual transactions to fully understand the context of the data.

Top wallets
The wallet is a close counterparty to Wintermute Trading, with over 56% of incoming SAND tokens received from the Wintermute wallet. The wallet is also frequently funded by Binance and ctm.eth. Accumulation seems to have started from early Sept, with 1.4m and 4.6m SAND tokens received from Wintermute Trading and Binance respectively from Sept 1 - 2. Transactions to ctm.eth were used to interact with Cream Finance, but the funds were eventually sent back to asiv.eth by Oct 4.
Reduction in SAND exposure for the wallet seems to have begun from late Sept. Here are some notable transactions from that period till SAND’s all time high:
- Sept 26 - 30: 5.1m SAND tokens sent to High Activity and Wintermute Trading eventually ended up in Binance, with SAND’s price ranging from $0.60 - $0.66.
- Nov 3: 375k SAND tokens received from High Activity and Gemini eventually ended up in Binance, during the period of SAND’s first peak at $3.03.
- Nov 17 - 24: 1.8m SAND tokens were sent to Binance, during SAND’s run-up to its all time high.
- Nov 24 - 25: 5.2m SAND tokens were sent to asiv.eth from Wintermute Trading, of which the funds were held in the wallet till at least February 2022.
Overall, Wintermute was continuously reducing their exposure to SAND from Sept to Nov - with over 7.2m SAND tokens sent to Binance during that period. However, do note that they still held over 9m SAND tokens until Feb 2022.


The wallet sent over 1.58m of SAND tokens to FTX, Binance, OKX and Huobi from Nov 19 - 24, nearing the peak of SAND’s price. The funds were received from another one of Alameda’s wallets: Alameda Research: 0xd09, which received these SAND tokens from another close counterparty wallet labeled High Activity. Based on Nansen data, the accumulation of SAND tokens could have started as early as August, which meant that Alameda was up more than 10x on their investment.
Alameda uses a lot of proxy wallets when trading - hence, it might be difficult to track when they are accumulating. However, based on Nansen’s Wallet Profiler - it shows a trend whereby Alameda Research: 0x4c8 is a wallet that interacts closely with CEXes. Therefore, setting up a smart alert for this wallet could help to defend your positions as it shows when Alameda is offloading their assets (on the assumption that they are sending to CEXes to sell). Using the example of SAND, following in Alameda’s footsteps for this trade would have been a good move, given that the price of SAND fell shortly after and never recovered to its all time high.

As shown above under “Top Transfers”, the wallet made several large transactions removing liquidity from the Uniswap SAND-WETH pool in Sept and late Oct. Focusing on the transactions in late Oct, the wallet swapped over 633k SAND for ETH on Uniswap and sent 4.9m SAND tokens to Binance between Oct 29 and 30. The period of these transactions coincides with SAND’s first run up sparked by the announcement of Facebook rebranding to Meta.
Even though the wallet did not sell at SAND’s all time high, it still netted a 3x across their investments given that the tokens were acquired between $0.82 - $1.17.

Factors to consider
Other than Smart Money behavior, it is important to take note of external factors that could have affected the price action of SAND significantly.
Based on this article by Binance, SAND had a token unlock for seed and strategic sale investors as well as team and advisors in Dec 2021. A total of 126.8m tokens from seed and strategic sale, plus 121.2m tokens from the team and advisors were unlocked. Given that these investors were up over 1,000x, it may have added to sell pressure on SAND. Furthermore, the macro environment was risk-off at that time with majors such as BTC and ETH being over 40% down from all time highs.
Therefore, these factors could have contributed to the 50% fall in prices from Dec 2021 to Jan 2022.
Maple Finance (MPL)
Overview
MPL is the governance token of Maple Finance - a DeFi credit protocol focused on providing undercollateralized or uncollateralized loans to institutional borrowers. Read more in our report on Maple Finance here.
The token launched on Apr 28, 2021 through a Balancer LBP. The maximum supply of MPL is 10,000,000. The table below shows a summary of allocations and the prices that respective investors bought at:
| Category | Allocation | Price per MPL (USD) |
|---|---|---|
| Seed Sale | 26% | $0.50 |
| Public Sale | 5% | $17-45 |
| Liquidity Mining | 30% | N/a |
| Team & Advisors | 25% | N/a |
| Treasury | 14% | N/a |
Source: Cryptorank/Twitter
5% of tokens from the seed sale were unlocked at TGE while the remaining vests linearly across 18 months. All tokens for team and advisors go through a 24-month vesting period.
Further fundraising rounds were also carried out in Jan and Mar 2021 - whereby a total of $1.4m at $3 per MPL and $0.5m at $5 per MPL respectively were sold from the Treasury as OTC deals to investors. Tokens for both rounds go through a 12-month linear vest. Notable investors from the seed and fundraising rounds include Framework Ventures, FBG Capital and Alameda Research.
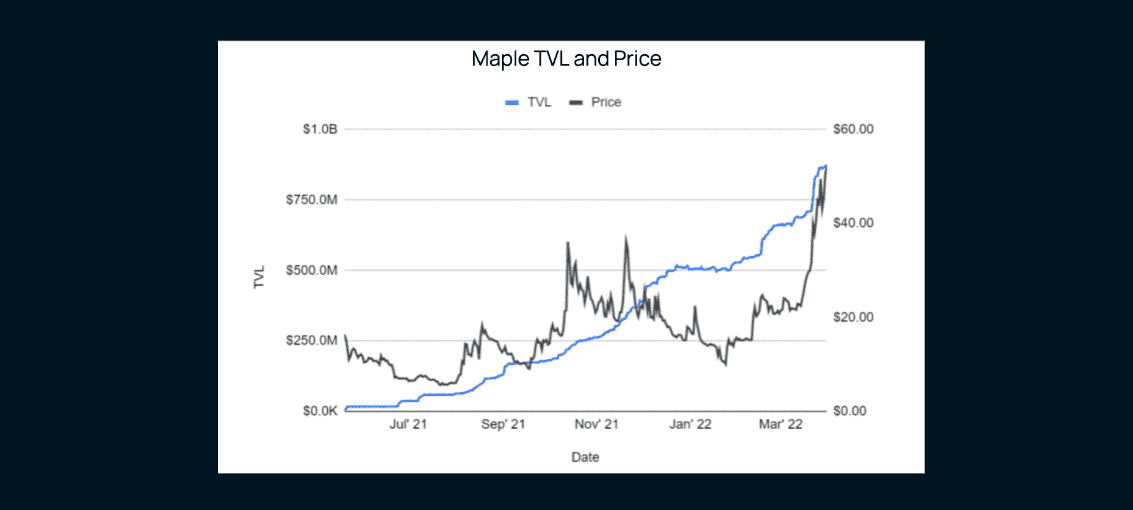
The price of MPL had been ranging from $11-21 from the start of Jan 2022 before gaining traction in Feb and reaching an all time high volume of $30.2m on Feb 12. From then, the price stabilized at around $21-25 until Mar 17 whereby it shot up to an all time high of $64 in just under a month, on Apr 11.

Catalysts
In a short period of time, Maple Finance became one of the top DeFi institutional lending protocols. The protocol was already highly anticipated before launch, with prominent individuals tweeting about it during the sale.
Maple made changes to their tokenomics in Feb - mainly introducing xMPL which allows the protocol to share revenue with their holders and induce more utility for MPL. The announcement of expanding into Solana in Q1 2022 could have spurred further price action as well. In the same period, Maple also exceeded TrueFi in terms of the amount of outstanding uncollateralized loans.
The narrative of investing in protocols with good cash flows also gained traction this year, which put Maple on many radars as the protocol became profitable just 9 months after its launch. As utilization of Maple went up, so did its token price - which was a win for investors and the team alike.
Smart Money
General Smart Money behavior

From the chart, it shows that Smart Money had been slowly accumulating since Jan 2022. Smart Money balance more than doubled from 215k on Jan 24 to 471k on Jan 25.
Zooming into the top transfers to Smart Money during that time period, it shows that most transactions were initiated by “🤖Gnosis Safe Proxy”, which is a smart contract that is likely used to distribute tokens to early investors. Hence, it is important to dive deeper into individual transactions as an uptick on the balance chart does not necessarily mean that Smart Money is actually buying.

Comparing the percentage of total supply and number of Smart Money holders vs. price shows that both have a positive correlation. As the price of MPL hit its peak, the percentage of total supply held by Smart Money decreased slightly while the number of holders remained similar. This could be a signal that Smart Money was not buying but they were not necessarily selling either, since the number of tokens emitted throughout the period would decrease the percentage of supply held by Smart Money even without a change in balance.

Top transfers
Looking at the top transfers for MPL to Smart Money wallets between Jan to Mar, it shows that most of the “accumulation” were transfers from contracts to Smart Money wallets - which could mean that most of these wallets were seed or private investors of Maple Finance. Sablier is a protocol that allows automation of token transfers based on criteria set by the deployer - which is a tool commonly used for handling vesting of tokens.
Assuming that the wallets were part of the seed or fundraising rounds, their cost basis for MPL is extremely low - ranging from $0.5 to $5. Therefore, any run up in token price could be subject to large sells given that these wallets hold a large amount of MPL and were already up significantly from their initial investments.

Top wallets
Alameda Research was one of the seed investors for Maple Finance and this wallet receives the tokens from investor unlocks. Tokens received were sent out to the wallet labeled High Activity, except for the transactions on Apr 17 whereby 18.6k MPL tokens received from Sablier were sent to Coinbase.
Looking at the activity of the wallet labeled High Activity - it shows that funds in the wallet were all received from Alameda Research: 0xe5d. All of the wallet’s MPL tokens were sent to Gate.io on Apr 27, slightly before MPL rapidly decreased in price.


Similarly, Bitscale Capital was another seed investor of Maple Finance. This wallet received tokens from “🤖Sablier'', a protocol that is commonly used for vesting of tokens. Hence, this is likely a distribution contract for seed investors. Funds received were sent out to High Activity and it was dispersed from there. The majority of the funds were sent to BitScale: 0x510 which swapped over 9k MPL for USDC from Mar to Apr.


FBG Capital was another seed investor in Maple Finance and this wallet receives tokens from “🤖Gnosis Safe Proxy” and “🤖Sablier”. Funds received from the contracts were immediately sent out to FBG Capital: 0xb07.
Looking at the activity of FBG Capital: 0xb07 - it shows that they have never sold their tokens and even staked 186k MPL tokens on May 31.


ParaFi swapped 800k USDC for 22.7k MPL tokens on Mar 21 when the price of MPL was at $31.42. These MPL tokens were then sent to Coinbase from Apr 28 to May 3, where the price of MPL was ranging at $48-50.
Though such actions may seem like they have turned bearish on MPL (assuming transactions to Coinbase were meant to sell), Parafi still holds over 375k MPL, all of which was staked for xMPL on Jun 7. These funds originated from another ParaFi wallet - ParaFi Capital: 0x05b which received the MPL tokens from Coinbase from April 25 to May 13. The tokens were sent through a proxy wallet that is labeled as ParaFi Capital: 0xe7d.

Thus, it is important to consider the amount of tokens that entities are selling as a percentage of their total funds, which would provide a better sentiment check on the particular token. Similar to FBG Capital, it shows that there is sufficient utility for both of them to hold and stake a huge amount of MPL despite the price falling by over 80% from its peak. These would be important wallets to track as they hold over 9% of MPL’s circulating supply as of July 19, 2022. Setting up a Smart Alert for these wallets will allow you to track any movements, including when the tokens are unstaked - which could be a signal for further movement. An example of the Smart Alert can be shown here. Parameters such as min. USD value can be adjusted based on your preference.
Factors to consider
While Maple did not have massive unlocks, the short vesting time meant that the circulating supply of the tokens are quite sizable in relation to the total supply. As of July 19, 2022, over 6.2m MPL tokens are in circulation - equivalent to 62% of the total supply. This is a significant percentage for a protocol that just launched a year ago, whereby the initial token inflation could have contributed to the price of MPL decreasing rapidly after hitting its peak.
The macro environment could have had an impact on the price of MPL as well. The macro outlook has been bearish for the past few months since the outbreak of the Ukraine war and persistent inflation, which could have caused many to de-risk when MPL’s price went up. This possibly contributed to MPL’s rapid price decrease in May.
Convex Finance (CVX)
Overview
CVX is the utility token of Convex Finance - a protocol built to provide more opportunities for liquidity providers on Curve through boosted rewards and no locking periods. Convex Finance has now expanded to serve Frax Finance as well, which employs a similar token locking model like Curve with veCRV. Convex aims to expand into more protocols in the future which will provide greater utility for CVX holders.
The token launched on May 17, 2021 with a maximum supply of 100,000,000. The table below shows a summary of allocations and the prices that respective investors bought at:
| Category | Allocation | Price per CVX (USD) |
|---|---|---|
| Curve LP rewards | 50% | N/a |
| Liquidity Mining | 25% | N/a |
| Treasury | 9.7% | N/a |
| veCRV holders | 2% | N/a |
| Investors | 3.3% | N/a |
| Team | 10% | N/a |
Source: Convex Finance
Tokens for the team, treasury and investors are vested over 1 year while the Curve LP rewards and airdrop for veCRV holders were instantly claimable. The amount of CVX minted decreases exponentially per CRV earned, which meant that the token had higher inflation at the initial stages.
There was a lot of interest in CVX since its launch but it properly gained traction during the start of the bull market in 2021. The price of CVX increased by almost 6x from $6.6 to $35, from Sept to mid Nov. The token had a period of consolidation from late Nov to mid Dec, with the price ranging from $22 to $30. CVX then ran up to its all time high of $50 on Jan 2, before falling to lows of $16 in Mar.

Catalysts
The Curve Wars narrative was one of the most popular narratives in late 2021, which definitely helped in the price action of CVX. Convex gained over $1 billion in TVL just two weeks after launching and continued growing to hit a peak of $21.1 billion on January 5. Naturally, Convex became the largest veCRV holder and the voting power on liquidity pool emissions on Curve went to CVX lockers. CVX lockers are holders who locked up their CVX for at least 16 weeks for vote-locking CVX (vlCVX).
Protocols would want higher emissions for their pools as that would mean higher APRs that could attract more liquidity and ensure stability of the pool. Therefore, they are incentivized to ‘bribe’ CVX lockers by offering rewards such as free tokens for them to vote on their pool. One example of this was a LUNA incentive for CVX lockers who voted for the UST pool.
In order to enjoy these rewards, users have to lock CVX for at least 16 weeks which reduces the circulating supply of CVX. Coupled with the fact that protocols were also accumulating CVX in order to vote for their own pools, this created an upward pressure on the price of CVX due to a supply crunch.
Smart Money
General Smart Money behavior
From the chart, it shows that Smart Money has been accumulating since September 2021, with increases from the period of October to November as well as a sharp increase in early December.

Zooming into the top transactions from early December, it shows that part of the sharp increase was attributed to Tetranode removing liquidity from the SushiSwap CVX-ETH pool on Dec 4 and the tokens were added back to his balance. Another top transaction would be analytico.eth claiming CVX rewards on Dec 8. Meanwhile, 0xSifu swapped ETH for 1.0m CVX tokens through SushiSwap from the period of Dec 4 to Dec 9. Many other Smart Money wallets were seen to be accumulating through this method as well such as Smart Dex Traders and First Mover LPs wallets on Nansen.

Analyzing the percentage of total supply and number of Smart Money holders vs. price of CVX shows that both have a positive correlation. As the price of CVX reached $30, holders began to reduce their exposure to CVX as Smart Money holdings as a percentage of total supply continued to decrease with CVX’s run up to its all time high. Meanwhile, the number of Smart Money holders continued to increase with the price of CVX, which suggests that although they may be reducing their exposure, many are still holding onto CVX perhaps due to its utilities.

Top transfers
Looking at the period of Sept to Nov, it shows that most of the increase in holdings were attributed to wallets claiming their CVX rewards. Over 50% of the supply of CVX was airdropped to Curve LPs and veCRV holders, which they can stake to earn protocol revenue or lock it up for additional rewards and voting rights. This means that the cost basis for most holders would likely be negligible. Given that CVX was part of the strong narrative of Curve Wars, users were probably incentivized to hold and stake for rewards.

Top wallets
The wallet withdrew 145k CVX from the Curve: CVX - ETH Liquidity Pool and swapped it for USDC on CowSwap on Jan 5. It also received 121k CVX from the CVX Locker contract on Jan 14 and swapped over 21k CVX for USDC through ParaSwap and traded the rest in the Uniswap: CVX - USDC pool. The funds were eventually swapped for ETH on Paraswap between Jan 22 and Jan 30.
Overall, the wallet had reduced most of its exposure to CVX by end Jan 2022, when the price of CVX was sitting between $20 - $30.

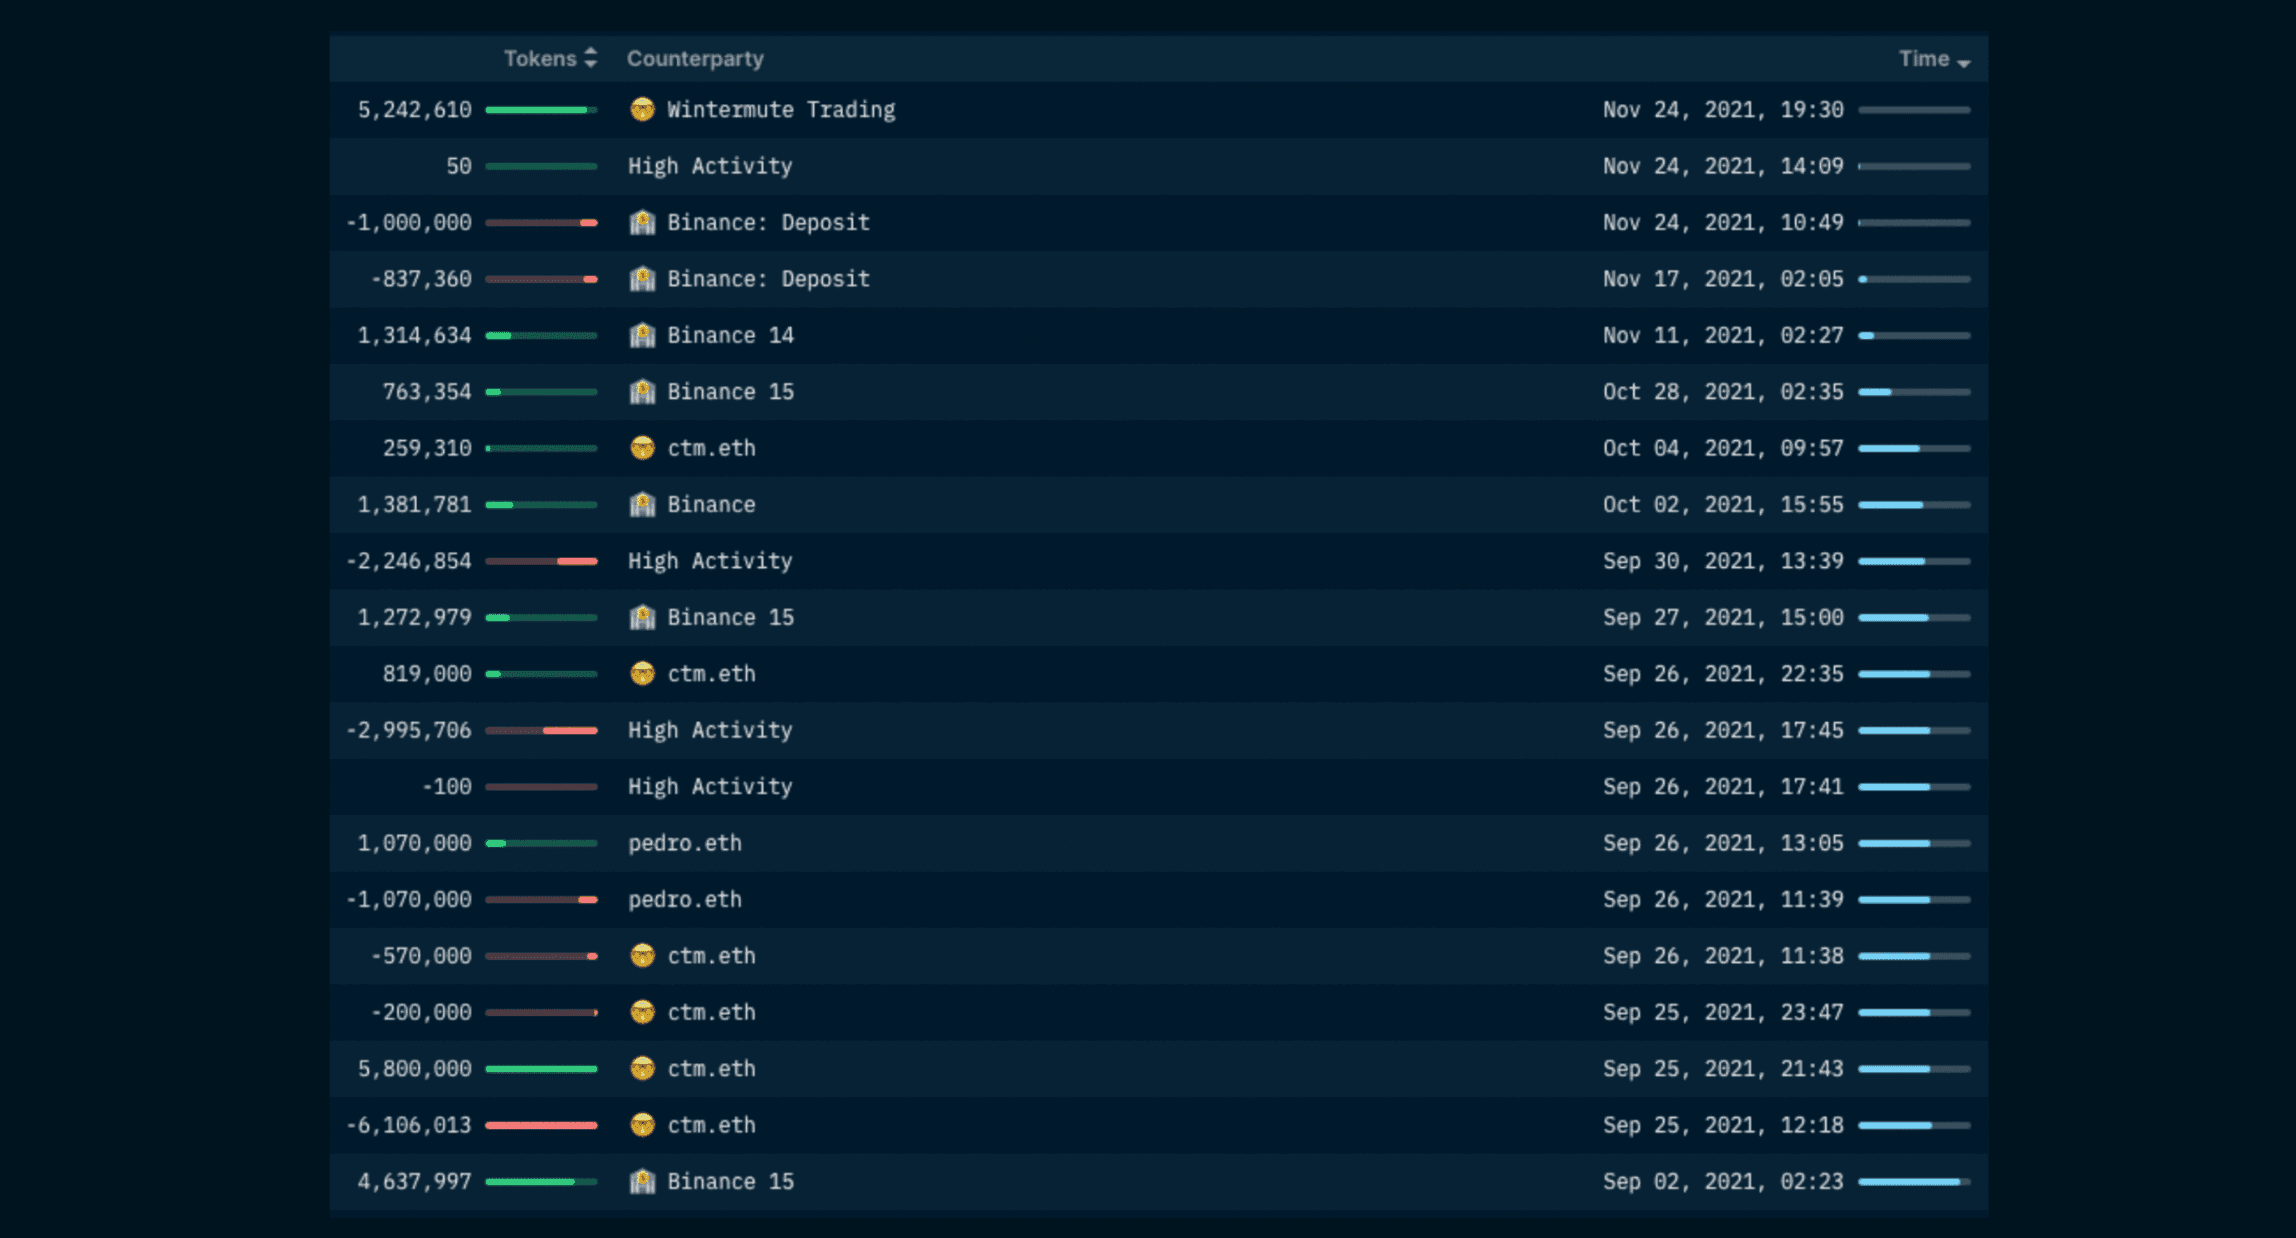
Alameda is an active trader of CVX and transactions date back to when the protocol was first launched. The wallet has been claiming rewards frequently from Convex including airdrops such as SPELL and ALCX, which is labeled under “Burn Address: 0x00000” in the image below. It then began to unstake assets from Convex on Nov 22 and started swapping over 173k CVX for (mostly) ETH through CowSwap from Nov 24 to Dec 15. There was consistent outflow from the wallet as it sent over 214k CVX to Binance from Dec 27 all the way till Jan 28.
Overall, the wallet has sold a sizable amount through the peak of CVX’s price.

Tetranode was another large holder of CVX. The wallet had large amounts of liquidity in the SushiSwap CVX-ETH pool which it pulled out of on Dec 27 to deposit in the Curve pool instead. This was probably due to CVX incentives being moved from the SushiSwap pool to the Curve pool on the same day.
Similar to Alameda, the wallet had also been claiming rewards from Convex frequently but there are no signs of huge selling. The only transactions that signified clear selling was when the wallet swapped 3.9k and 4.3k CVX for ETH on Jan 25 and Feb 9 respectively. The funds were mostly received from Votium, a protocol used to reward CVX lockers for voting on certain pools.


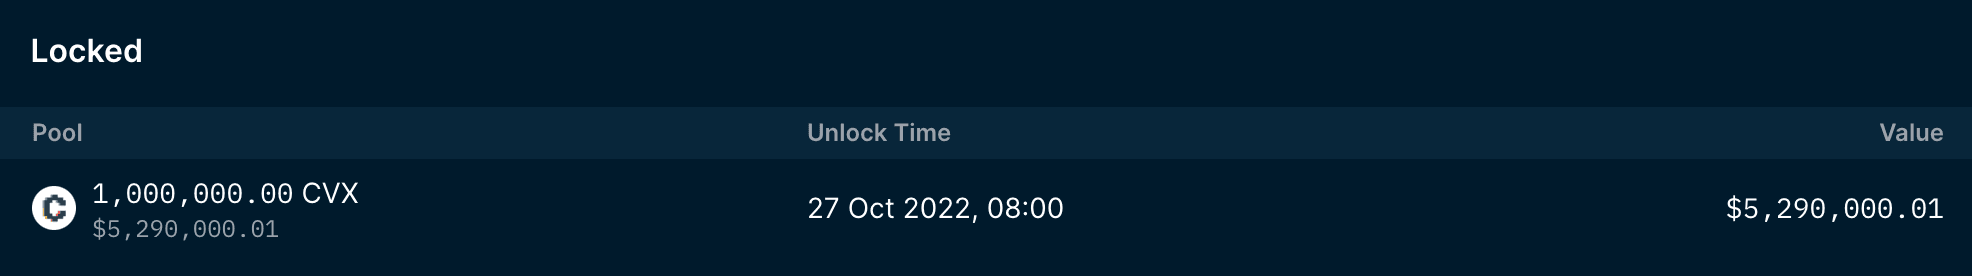
Overall, the wallet still holds a large amount of CVX - including 1 million locked CVX tokens which is scheduled to unlock on Oct 27. Hence, this would be an important wallet to keep track of using Smart Alerts for CVX holders.
Factors to consider
CVX’s run up could be largely attributed to the strong narrative surrounding the Curve Wars and holders had to lock CVX in order to vote and receive additional rewards such as bribes. From Sept 2021 to Feb 2022, the amount of vlCVX was continuously increasing. The first epoch for vlCVX started in Sept 2021, which meant that the first unlocks started in end Dec 2021 as shown in the second image below.
Assuming that these investors bought CVX between Aug to Sept where prices were fluctuating around $5-9, they were up around 5-8x on their investments at the first unlock on Dec 30. The unlock of 6.1m CVX was also around 14% of circulating supply at that point in time, which is a huge amount. This probably added sell pressure on CVX. Furthermore, the continuous weekly unlocks of around 2 million CVX tokens was probably also a huge contributing factor to driving prices down from Jan to Mar.


The trend of vlCVX unlocks is a good gauge for CVX’s price action as well. Sizable unlocks in Apr could have sent the price of CVX further down between Apr and May from $37 to $13. It is also important to use Smart Alerts as an unlock might not always signify a sell-off. The narrative of a huge sell-off happening during unlock of around 27m CVX tokens from 30 Jun was circulating on Twitter but the reverse happened instead - as the price of CVX went up from $3.8 to $5.8 in a week. Based on the Smart Alerts channel in the Discord, it seems like most of the top recipients chose to relock their CVX. Thus, the amount of unlocked CVX was greatly reduced, which could have helped in preventing the price of CVX from falling.
Overall, when considering to enter a position it is crucial to look at circulating supply vs. total supply, as well as the significance of unlocks in the coming months in order to defend your position.
Tips on Utilizing Nansen’s Dashboards
This report analyzed Smart Money behavior using past successful tokens as case studies.
Nansen’s Token God Mode - Smart Money tool offers insights to top balances and latest transfers made by Smart Money. Looking at top balances is useful for knowing which wallets to track to defend your positions. In the case where a token is not held by a lot of Smart Money, using Token God Mode - Token Distribution will allow you to view top balances across all wallets, including exchanges and the percentage of supply that they own.
Token transfers allow you to view all of the latest Smart Money transactions which can be filtered by time, value and senders/recipients. For example, entering “🏦🤖” under the “To” category allows you to filter for outflows to Liquidity Pools, vice versa. CEXes are represented by “🏦” while Smart Contracts are represented by “🤖” which includes vesting and claim contracts etc. This allows you to break down each transaction which would be much more accurate than just looking at balances since outflows are not always an indication of selling (e.g. depositing into liquidity pools).
After identifying top balances, use Wallet Profiler for Token to look at their historical activity for that token. This allows you to look at the counterparties for that particular wallet which may signal more movement as well. Using the example of Alameda - setting up a Smart Alert for the wallet with the top balance would not be sufficient, since they use many proxy wallets to mask the transactions of interest (such as sending to CEXes). Using Wallet Profiler for each of the related addresses can also help to identify the trend of activity for certain entities - such as the example under SAND on Alameda’s wallet which mostly interacts with CEXes.
For deeper analysis into individual wallets and their positions, you can utilize Nansen Portfolio as well. It presents an overview of the wallet’s total assets across all chains, positions in liquidity pools or staking contracts as well as transaction history. You can also create profiles to track multiple wallets under one dashboard, which is especially useful for funds that have many wallets such as Alameda Research or ParaFi Capital.
Key Takeaways
Nansen data provides a clear overview of each token’s metrics and allows you to trace transactions down to an individual level. Coupled with Smart Money labels unique to Nansen, it becomes easier to surface important signals in the data.
However, it is also important to consider external factors that have significant impact on the price action of the token as well. From the examples, the data shows that factors such as circulating supply vs total supply, unlocks, macro outlook as well as trending narratives played a big part in the tokens’ trajectory. Researching into the background of the token is also important - to find out which entities were seed investors and their cost basis. Such information will give more context and a greater understanding of what the data tells you on Nansen, making it much more actionable.