Introduction
In this note, we track the best-performing Dex traders on-chain and test how they perform over time. The first part of the note reviews data and methodology underlying Dex trading P&L calculations. The second part proposes some thresholds to identify the smartest traders. The third part tests a quantitative strategy that mimics the token allocation of traders selected in part two. The last part introduces other insights emerging from Dex traders’ P&L data.
The charts of this report and additional signals are gathered in this Nansen Query dashboard.
Special thanks to the following Nansen Explorers:
- Davide Passaniti
- Jake Kennis
- Tammie Ong
Data and Methodology
How to define a “Smart” Dex Trader? We choose a simple definition: Smart Dex Traders have generated superior historical returns by buying and selling crypto tokens on decentralized exchanges.
Each wallet’s historical P&L is calculated on an hourly basis. The model, developed by our colleague Davide Passaniti, parses on-chain transactions on Uniswap v2, Uniswap v3, Sushiswap, and Curve (3pool, Tricrypto2 pool, sUSD pool, sETH pool, stETH pool). Collectively, these pools account for ~95% of Dex swap volume on Ethereum.
The realized P&L of token swaps is calculated by multiplying the number of tokens bought (-) or sold (+) on Dexes by their respective hourly prices, at the hour when the swap occurs. The primary source for price data is Coinpaprika, with a secondary Coingecko daily source used when hourly data are missing.
We also calculate hourly token balances by wallet, based on the same parsed Dex on-chain data. This allows us to estimate the investment of each wallet in a specific token, and then compute a return on investment. This return on investment is the key metric used to select the “smartest” traders over time.
Selection of the Smartest
Even if USD P&L data is available at a very granular level (by hour), we take a step back and consider quarterly P&L performance by wallet. The underlying assumption is that three months is a long-enough observation period to assess the performance of a wallet but not too long that we would run the risk of only tracking wallets that have done well in the past, but are no longer active or are less active because the owner has moved to other wallets to trade. In traditional finance, the longer the published track record, the better. In crypto, it is more difficult to determine the track record of one specific trader because of the difficulty to allocate multiple on-chain wallets to that trader.
At the beginning of each quarter, we calculate the return on investment of each wallet across tokens over the past quarter, and then retain the wallets with superior returns. We find that selecting wallets yielding the top 10th-to-20th percentile of past returns leads to strong subsequent returns by these same wallets. When the selection threshold moves higher (above the 20th percentile), the subsequent performance starts to decline.
The bar chart below represents the quarterly returns of two cohorts of wallets: the top 15th-percentile of traders (wallets) by returns in the past quarter, vs all remaining traders. The cohorts of traders whose performance is charted for Q3 2020 have been selected in Q2 2020, the performance for Q4 2020 is that of traders selected in Q3 2020 etc.
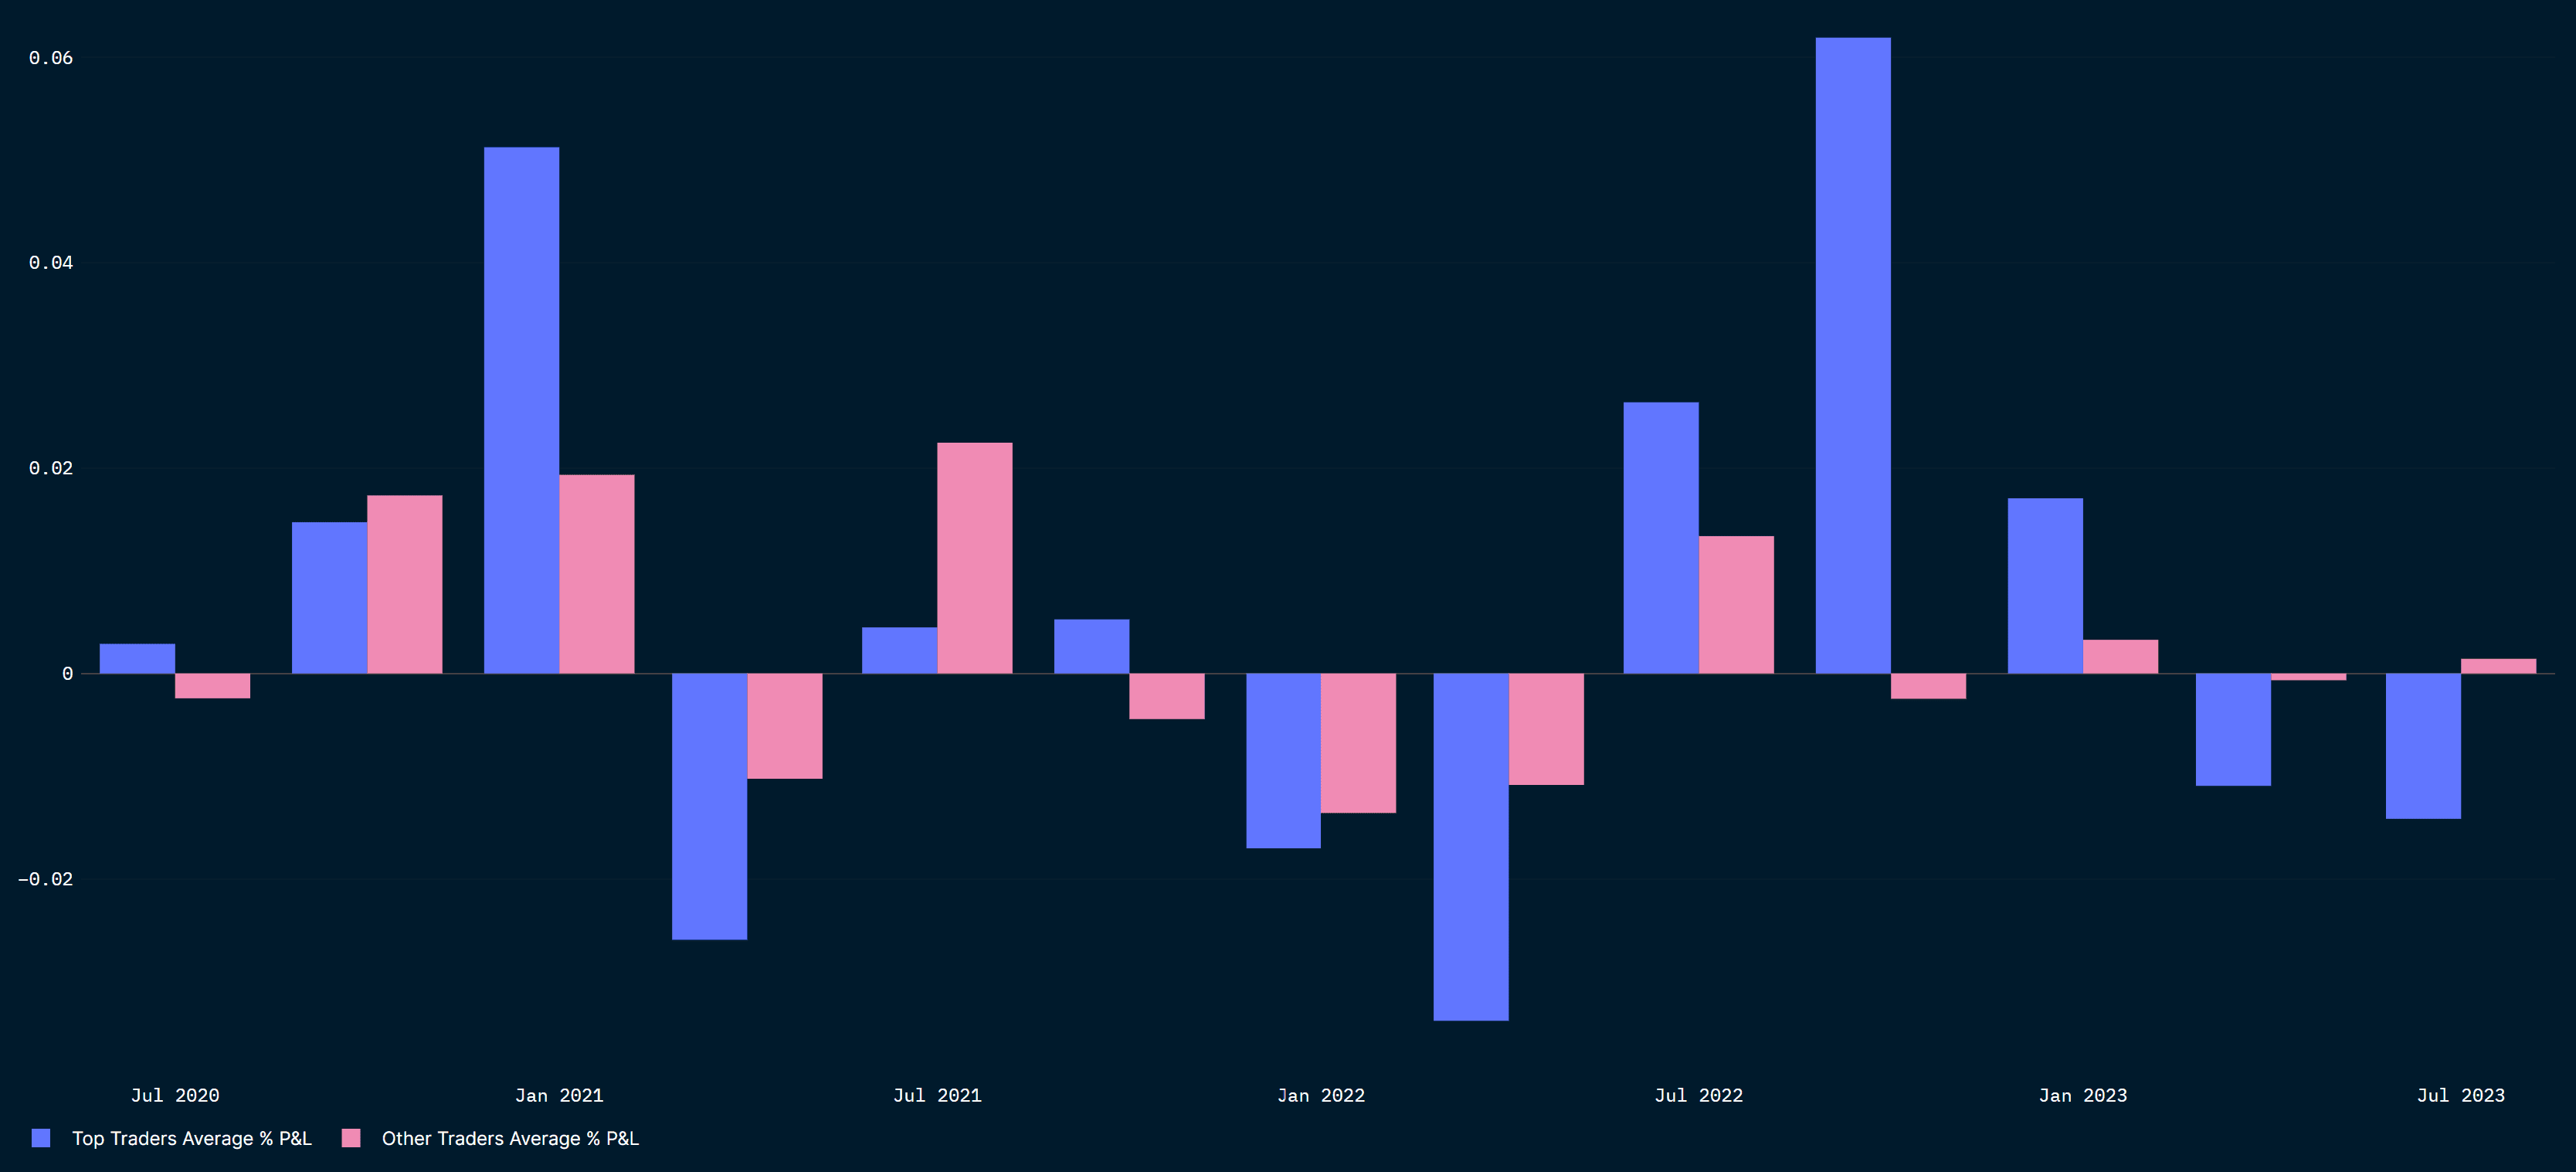
A few observations on the data above. First, the realized returns displayed in the bar chart appear less volatile than typical crypto returns.
Then, the top-trader cohort tends to outperform the other cohort when crypto markets are rallying. In periods of market weakness, e.g. Q2 2021, Q1 2022, and Q2 2022, the top-trader cohort underperforms other traders. That said, the most negative quarterly return is -3.4% for the top cohort. This compares with a maximum positive quarterly return of 6.2%, which shows a positive risk-return asymmetry.
Mimicking Top Dex Traders’ portfolios
We stick with our definition of “Smart” or “Top” Dex traders (identifying wallets with the top 15th-percentile of returns over the past quarter Q-1, and tracking these wallets in quarter Q).
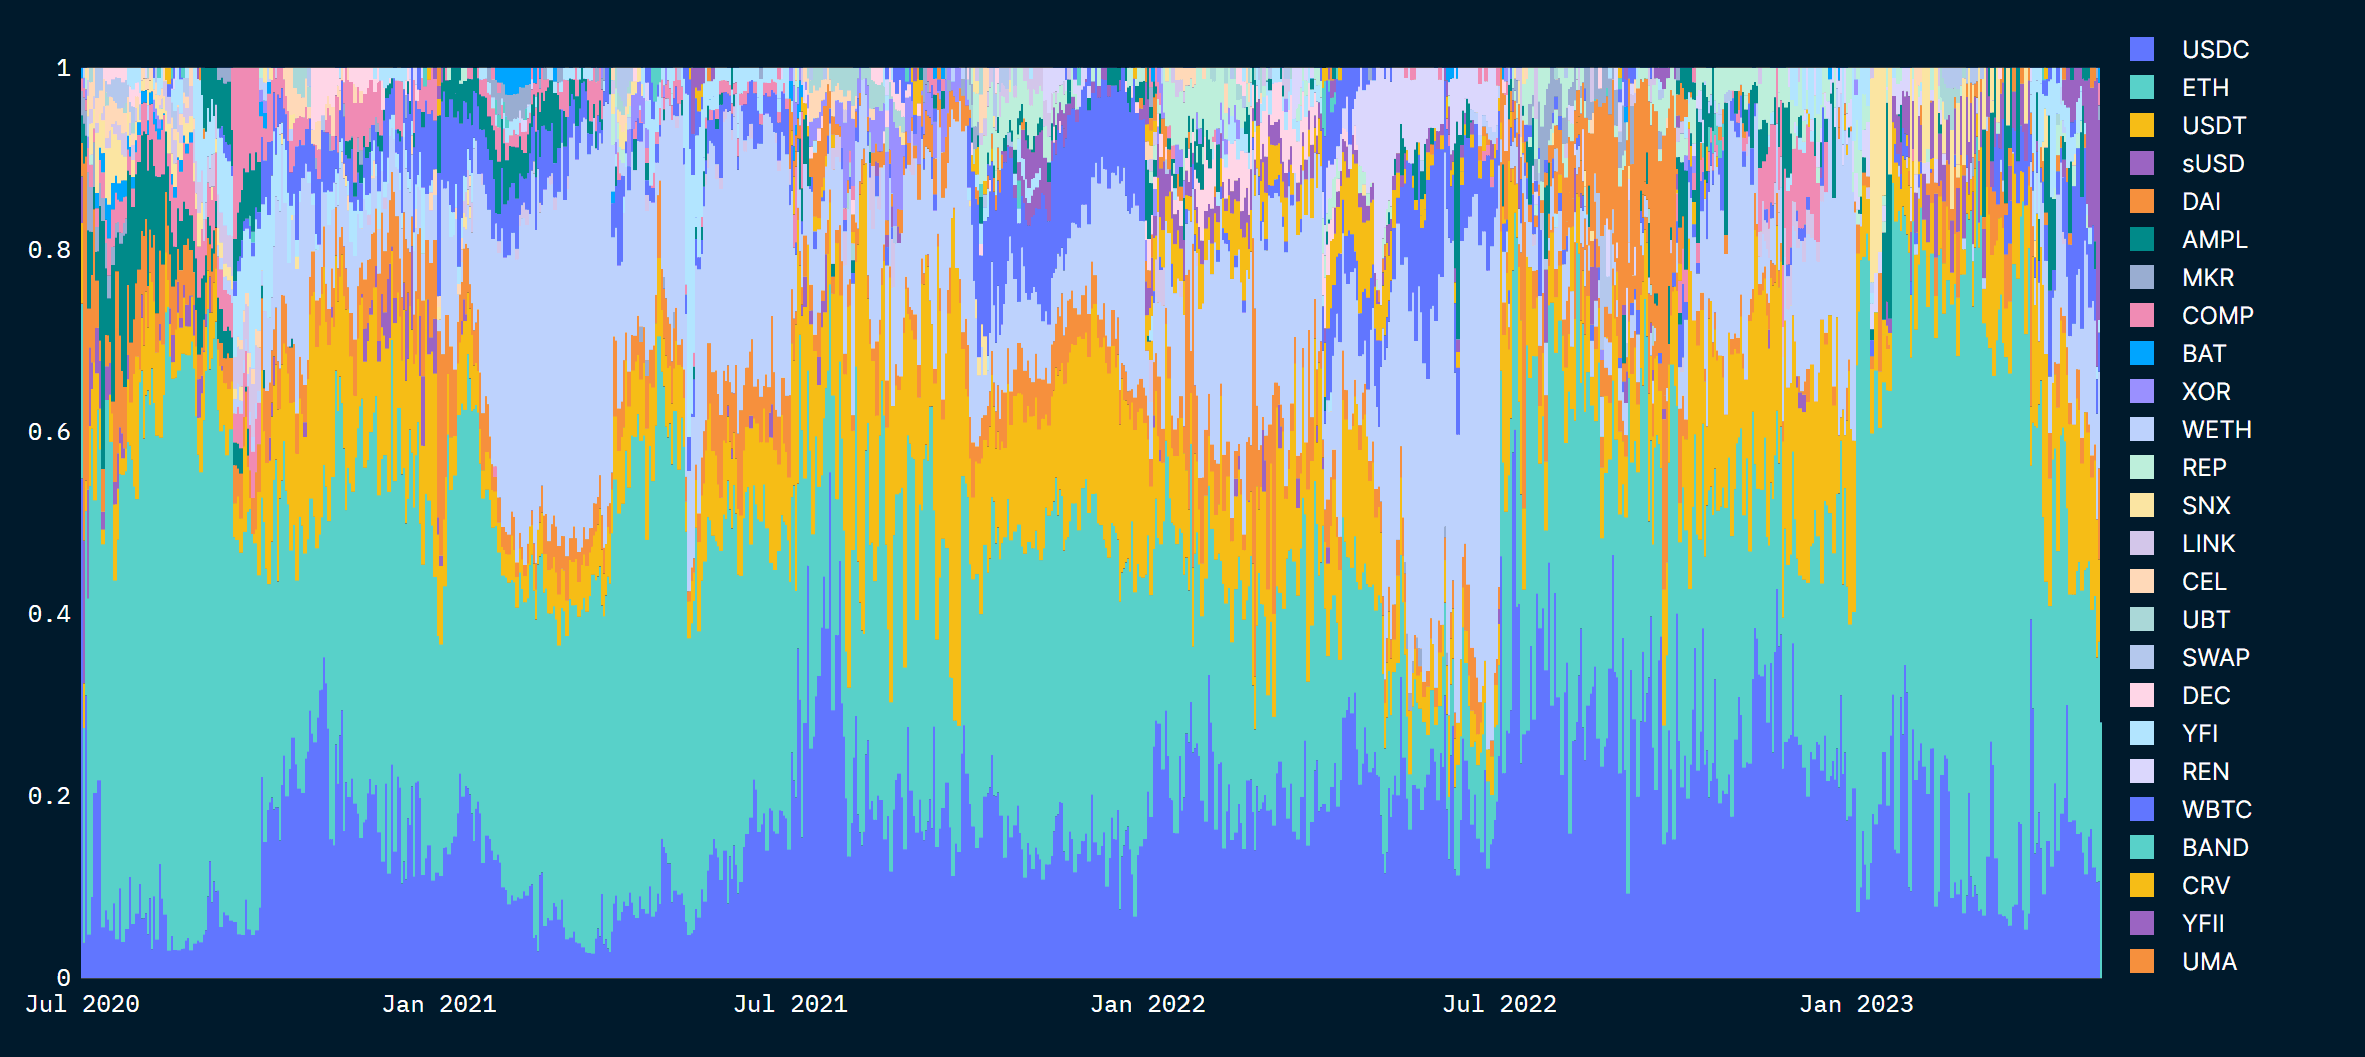
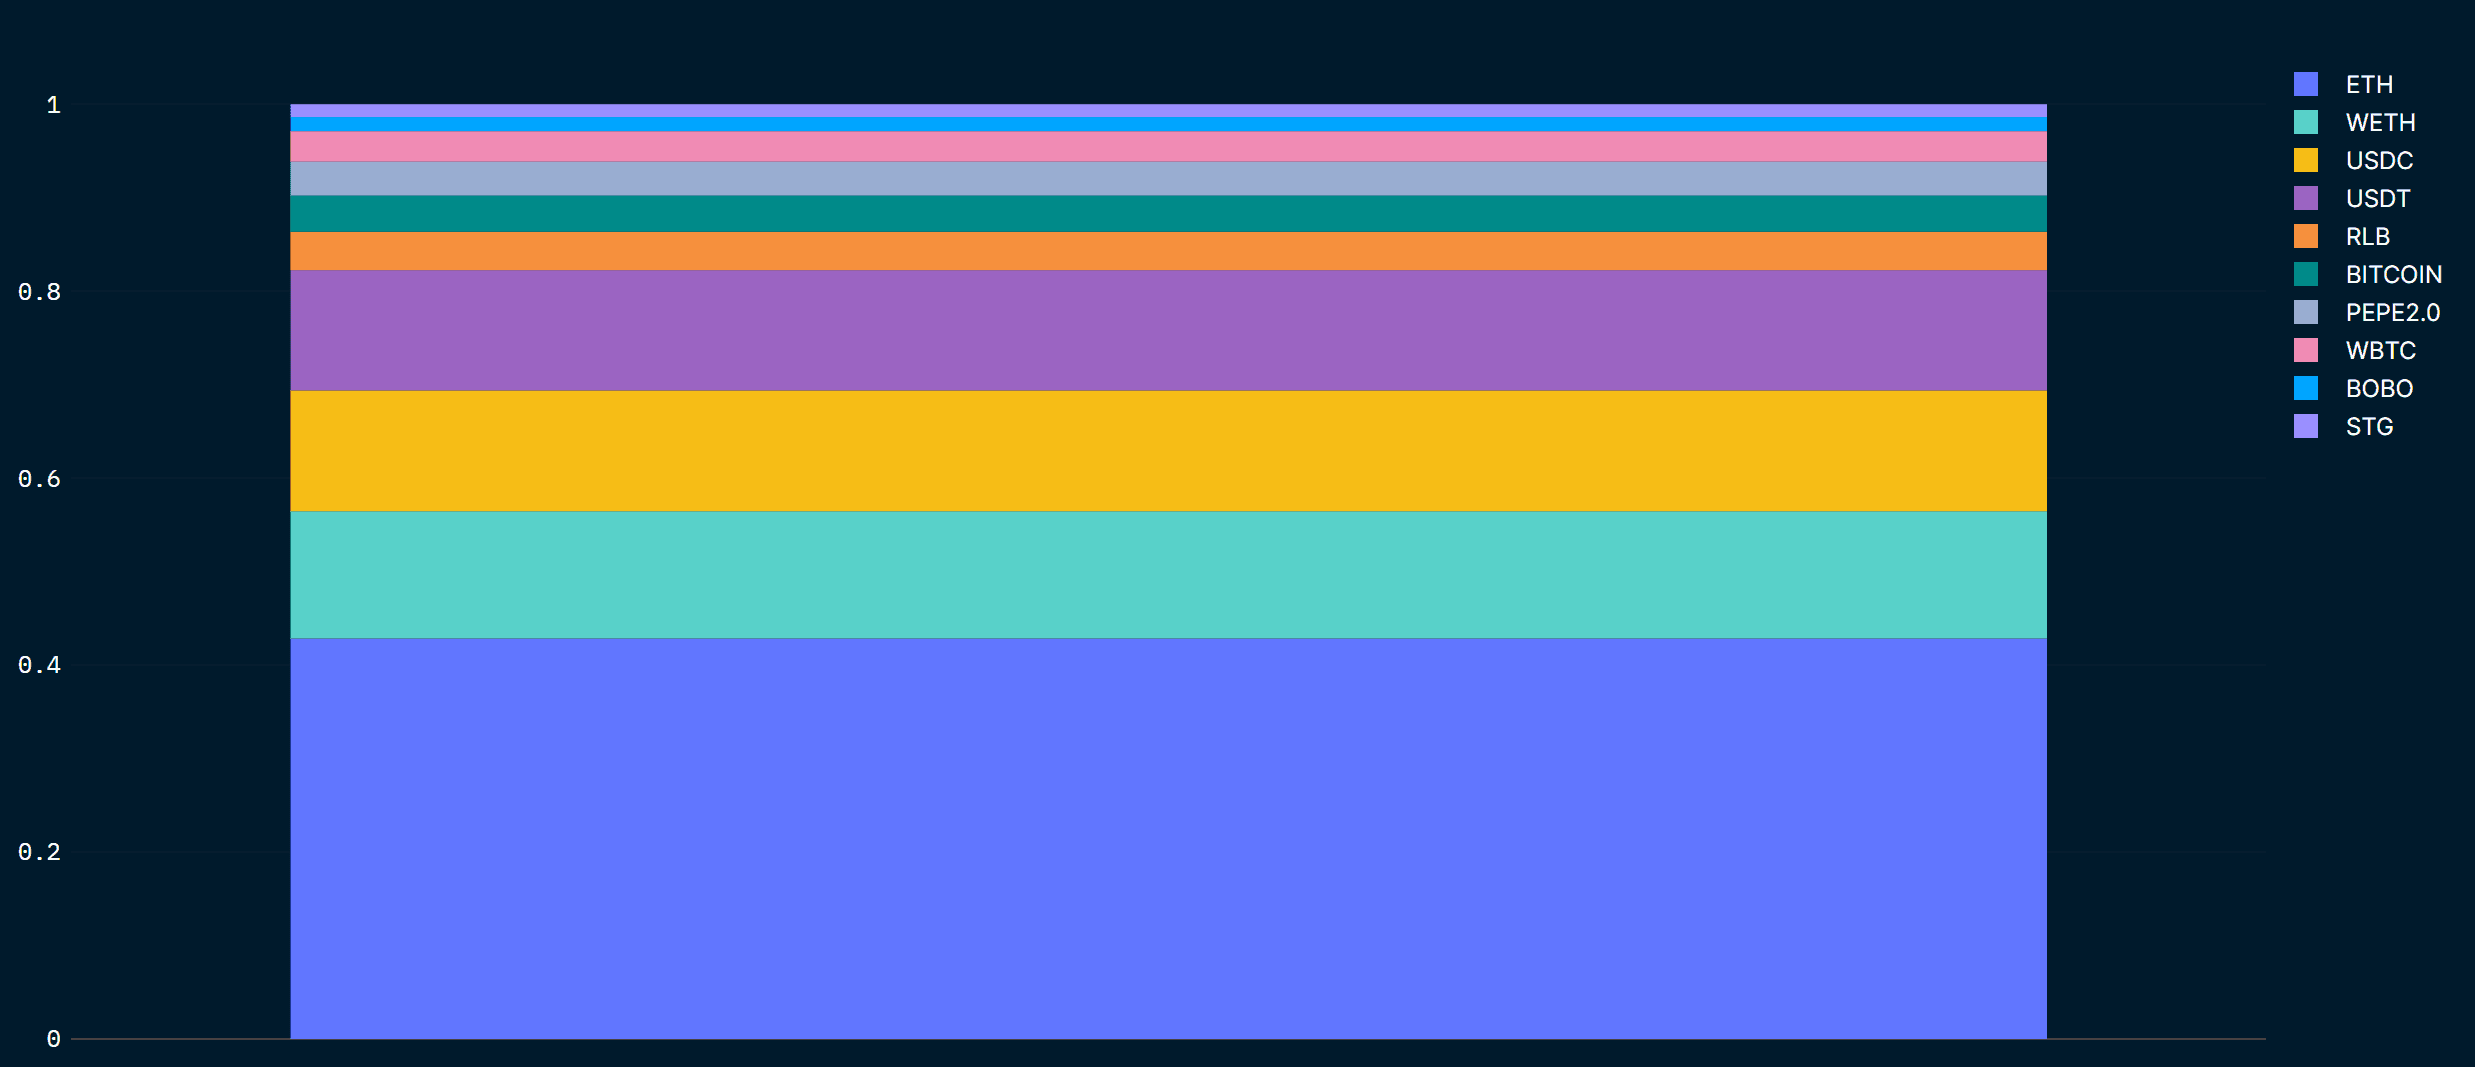
This time however, we are interested in these wallets’ aggregate token holdings. Does mimicking Top Traders’ token portfolios generate a superior risk-adjusted performance?
For this analysis, we calculate unrealized daily returns, using Coingecko price data to obtain daily returns by token. Our simulated portfolio follows the token allocation of the Top Traders daily: every day, our strategy adjusts the token allocation to follow the allocation of Top Dex Traders on the previous day.
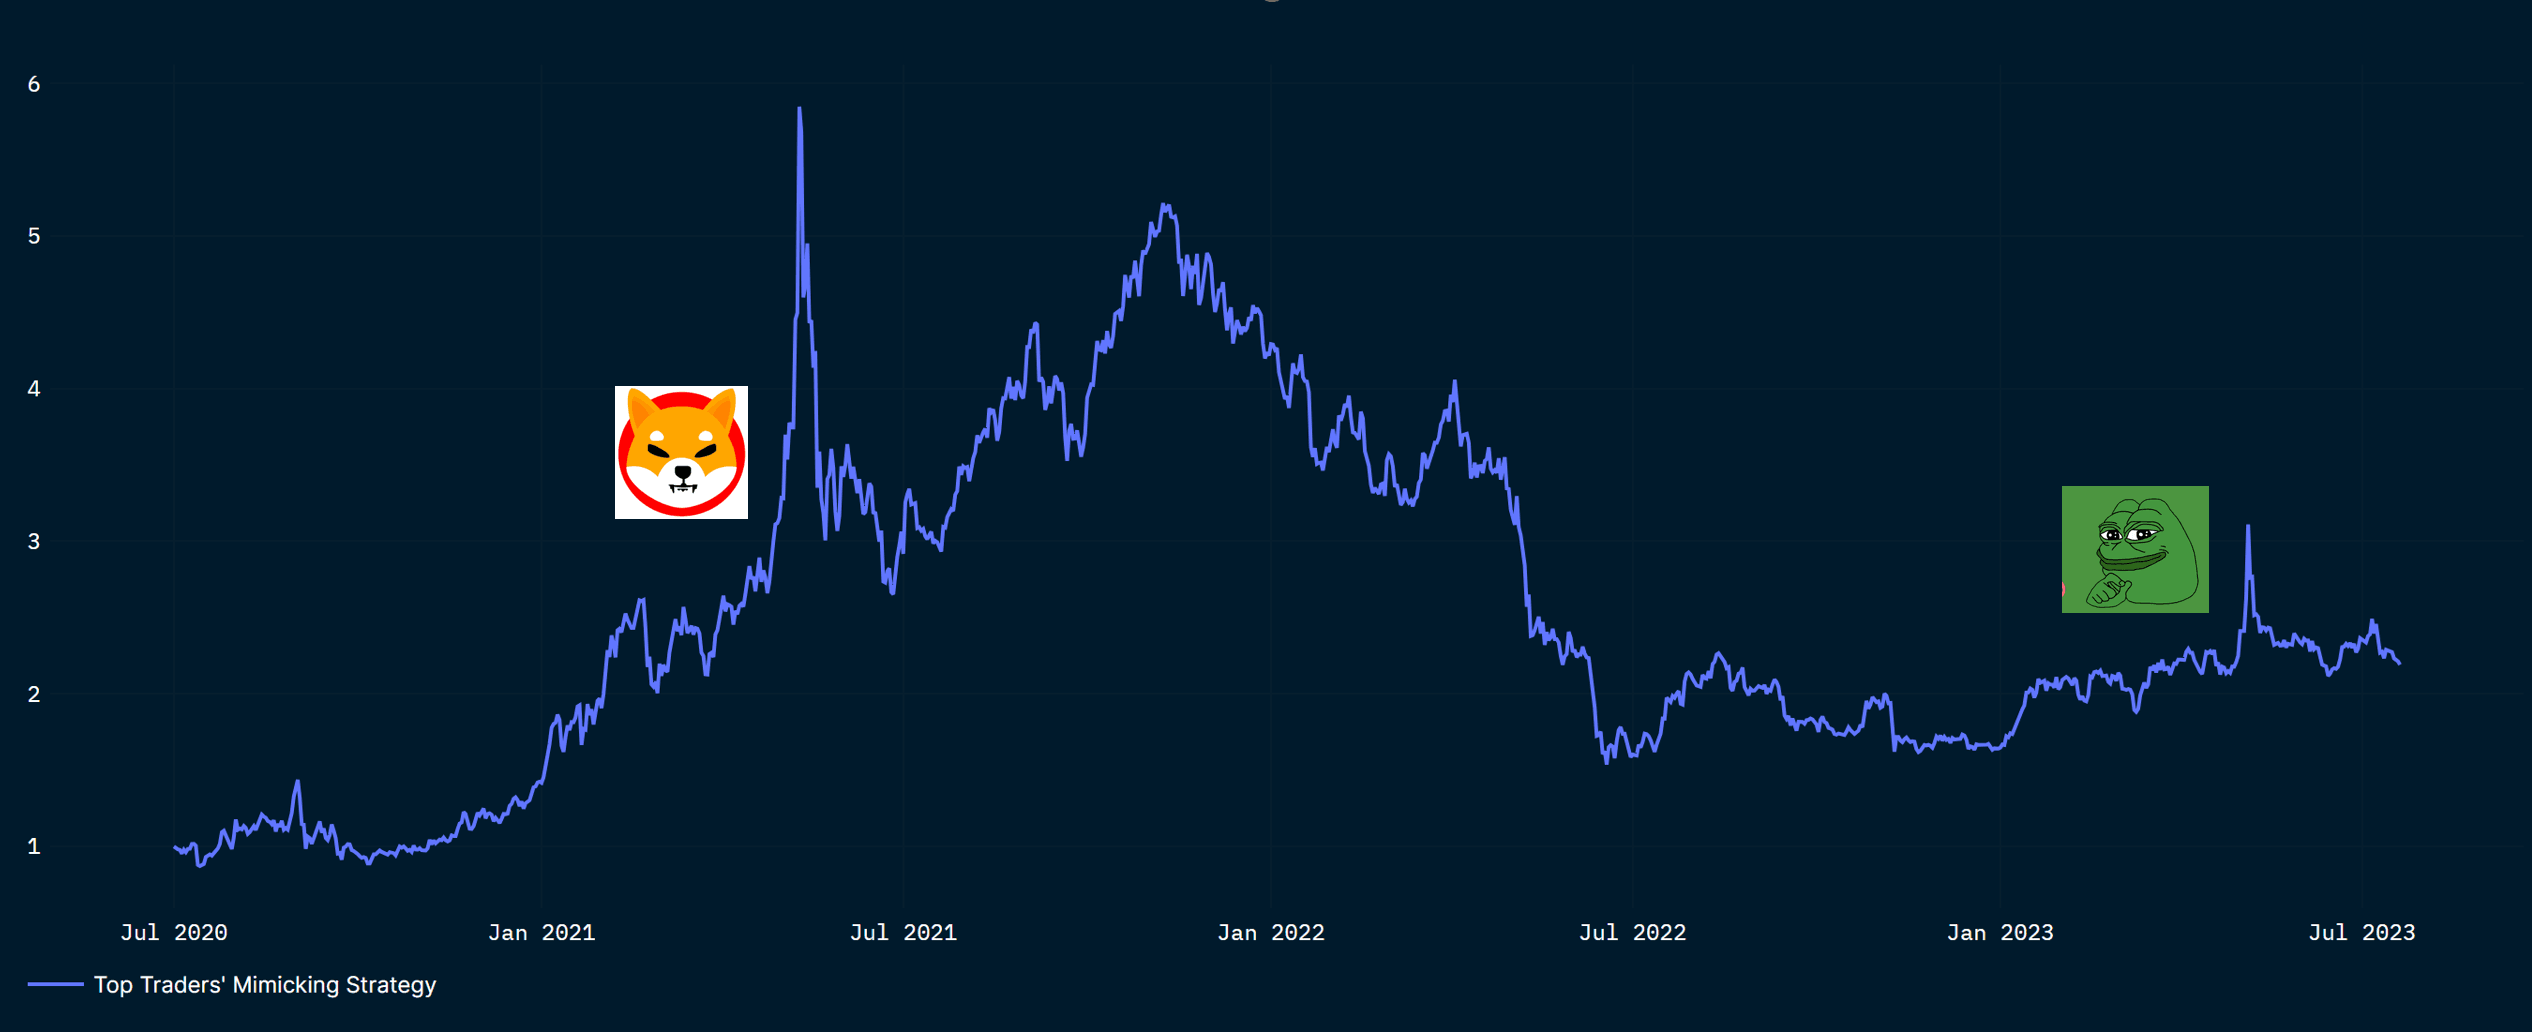
The cumulative return indices of this strategy are presented in the line chart below, vs a simple buy-and-hold strategy 100% allocated to ETH. We also show some risk and return statistics.
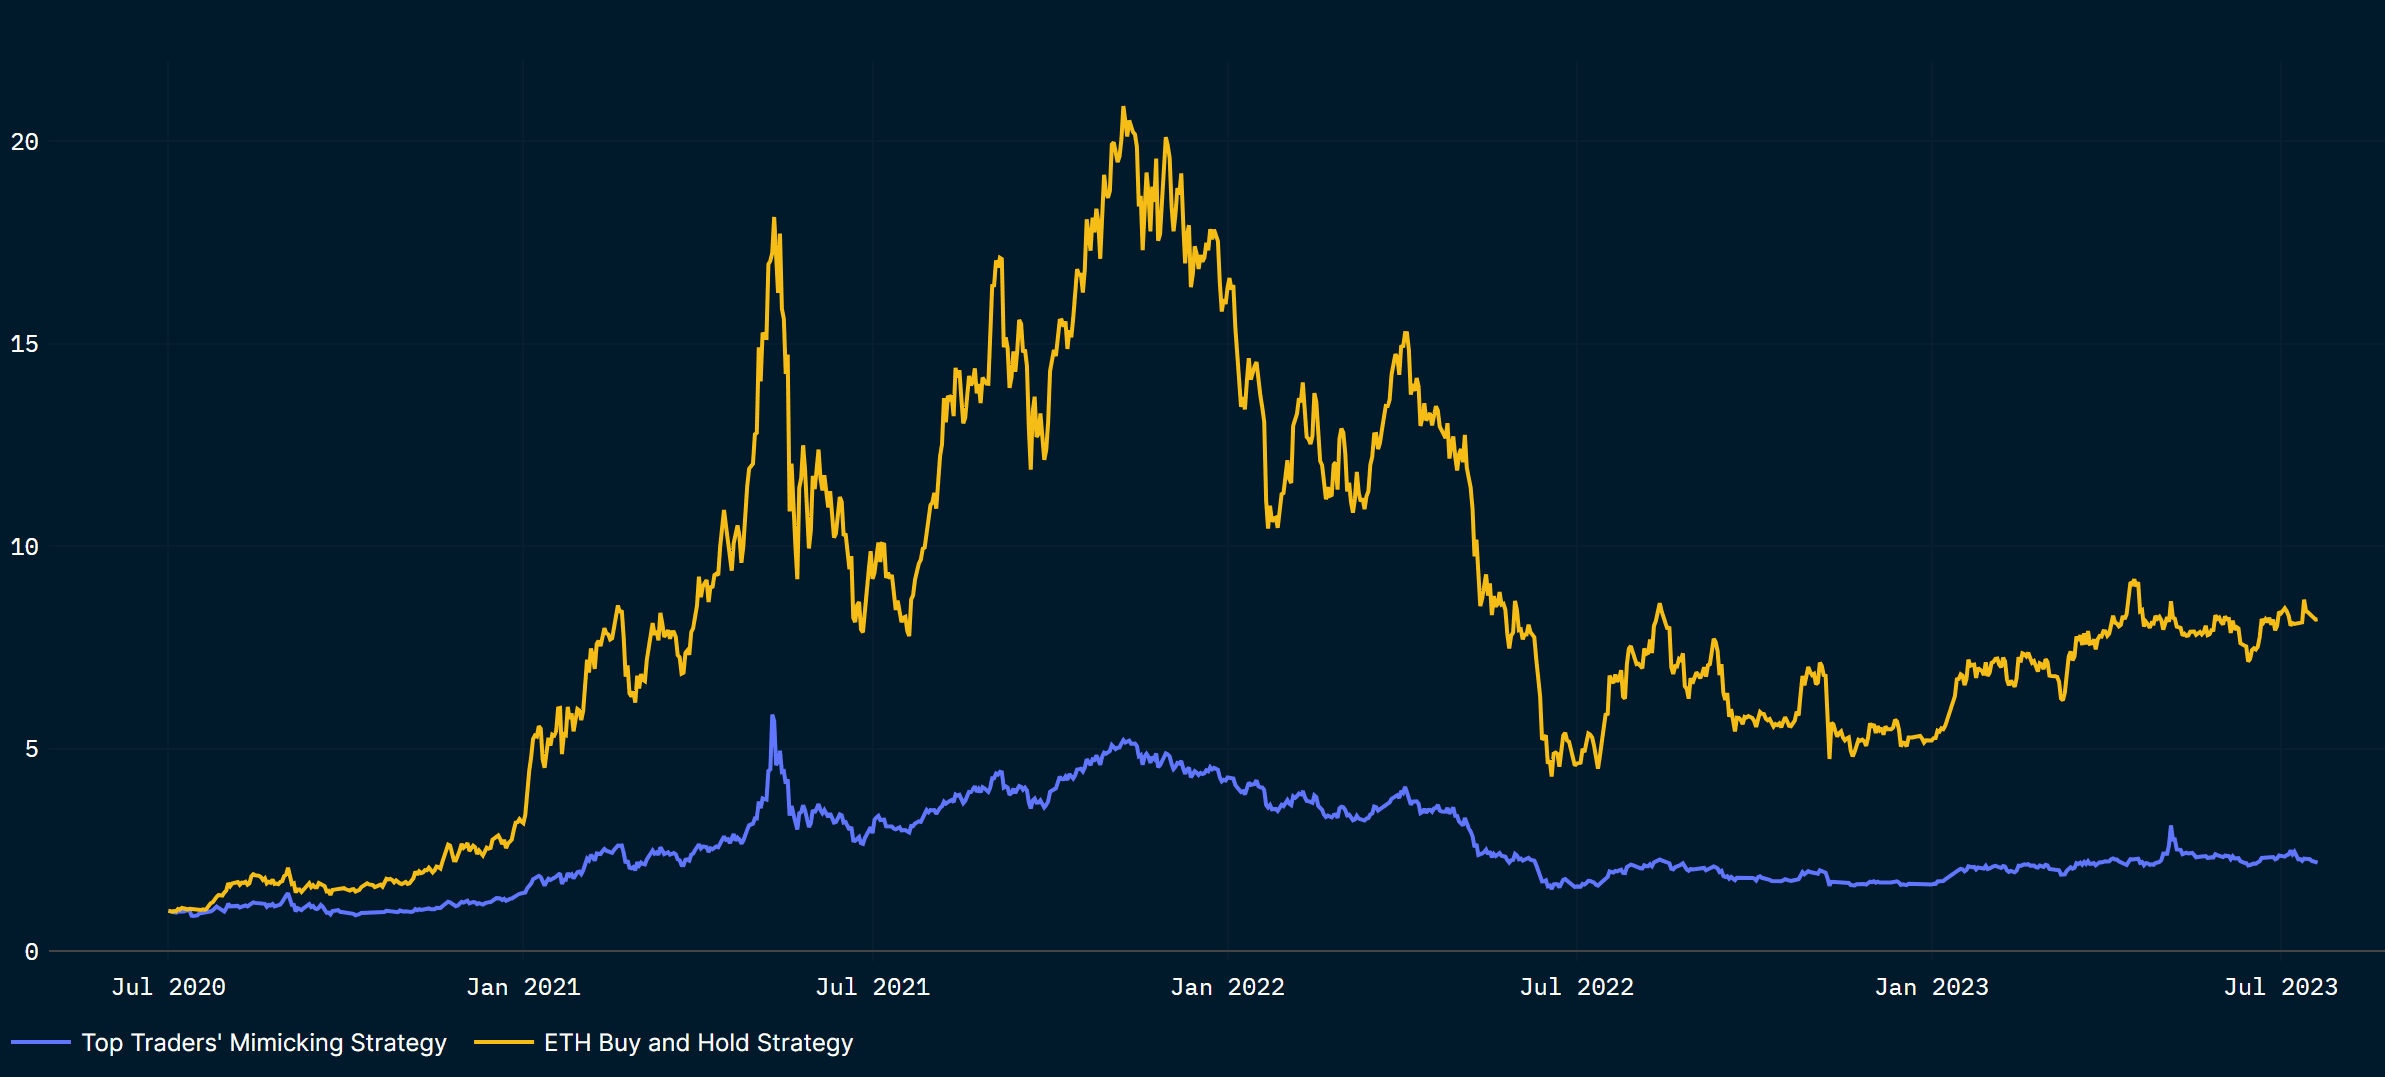
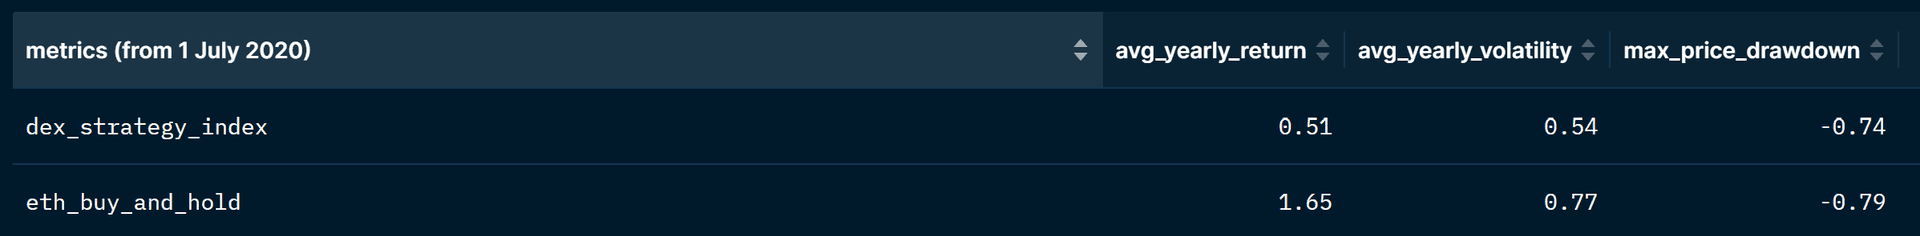
It appears that the “Top Dex Trader” strategy yields lower average returns than an ETH buy-and-hold strategy, but equally, it generates less risk. The “Top Dex Trader” strategy has a 6% points shallower maximum drawdown, and an annualized volatility of ~54% (vs ~77% for ETH buy-and-hold).
Diving into the periods of stronger returns for the strategy, we find that in May 2021, the strategy invested in SHIBA, including on May 10, 2021 when SHIBA more than doubled. From May 1, 2023 on, the strategy bought PEPE, which experienced several days of double-digit returns.
Trading nuggets
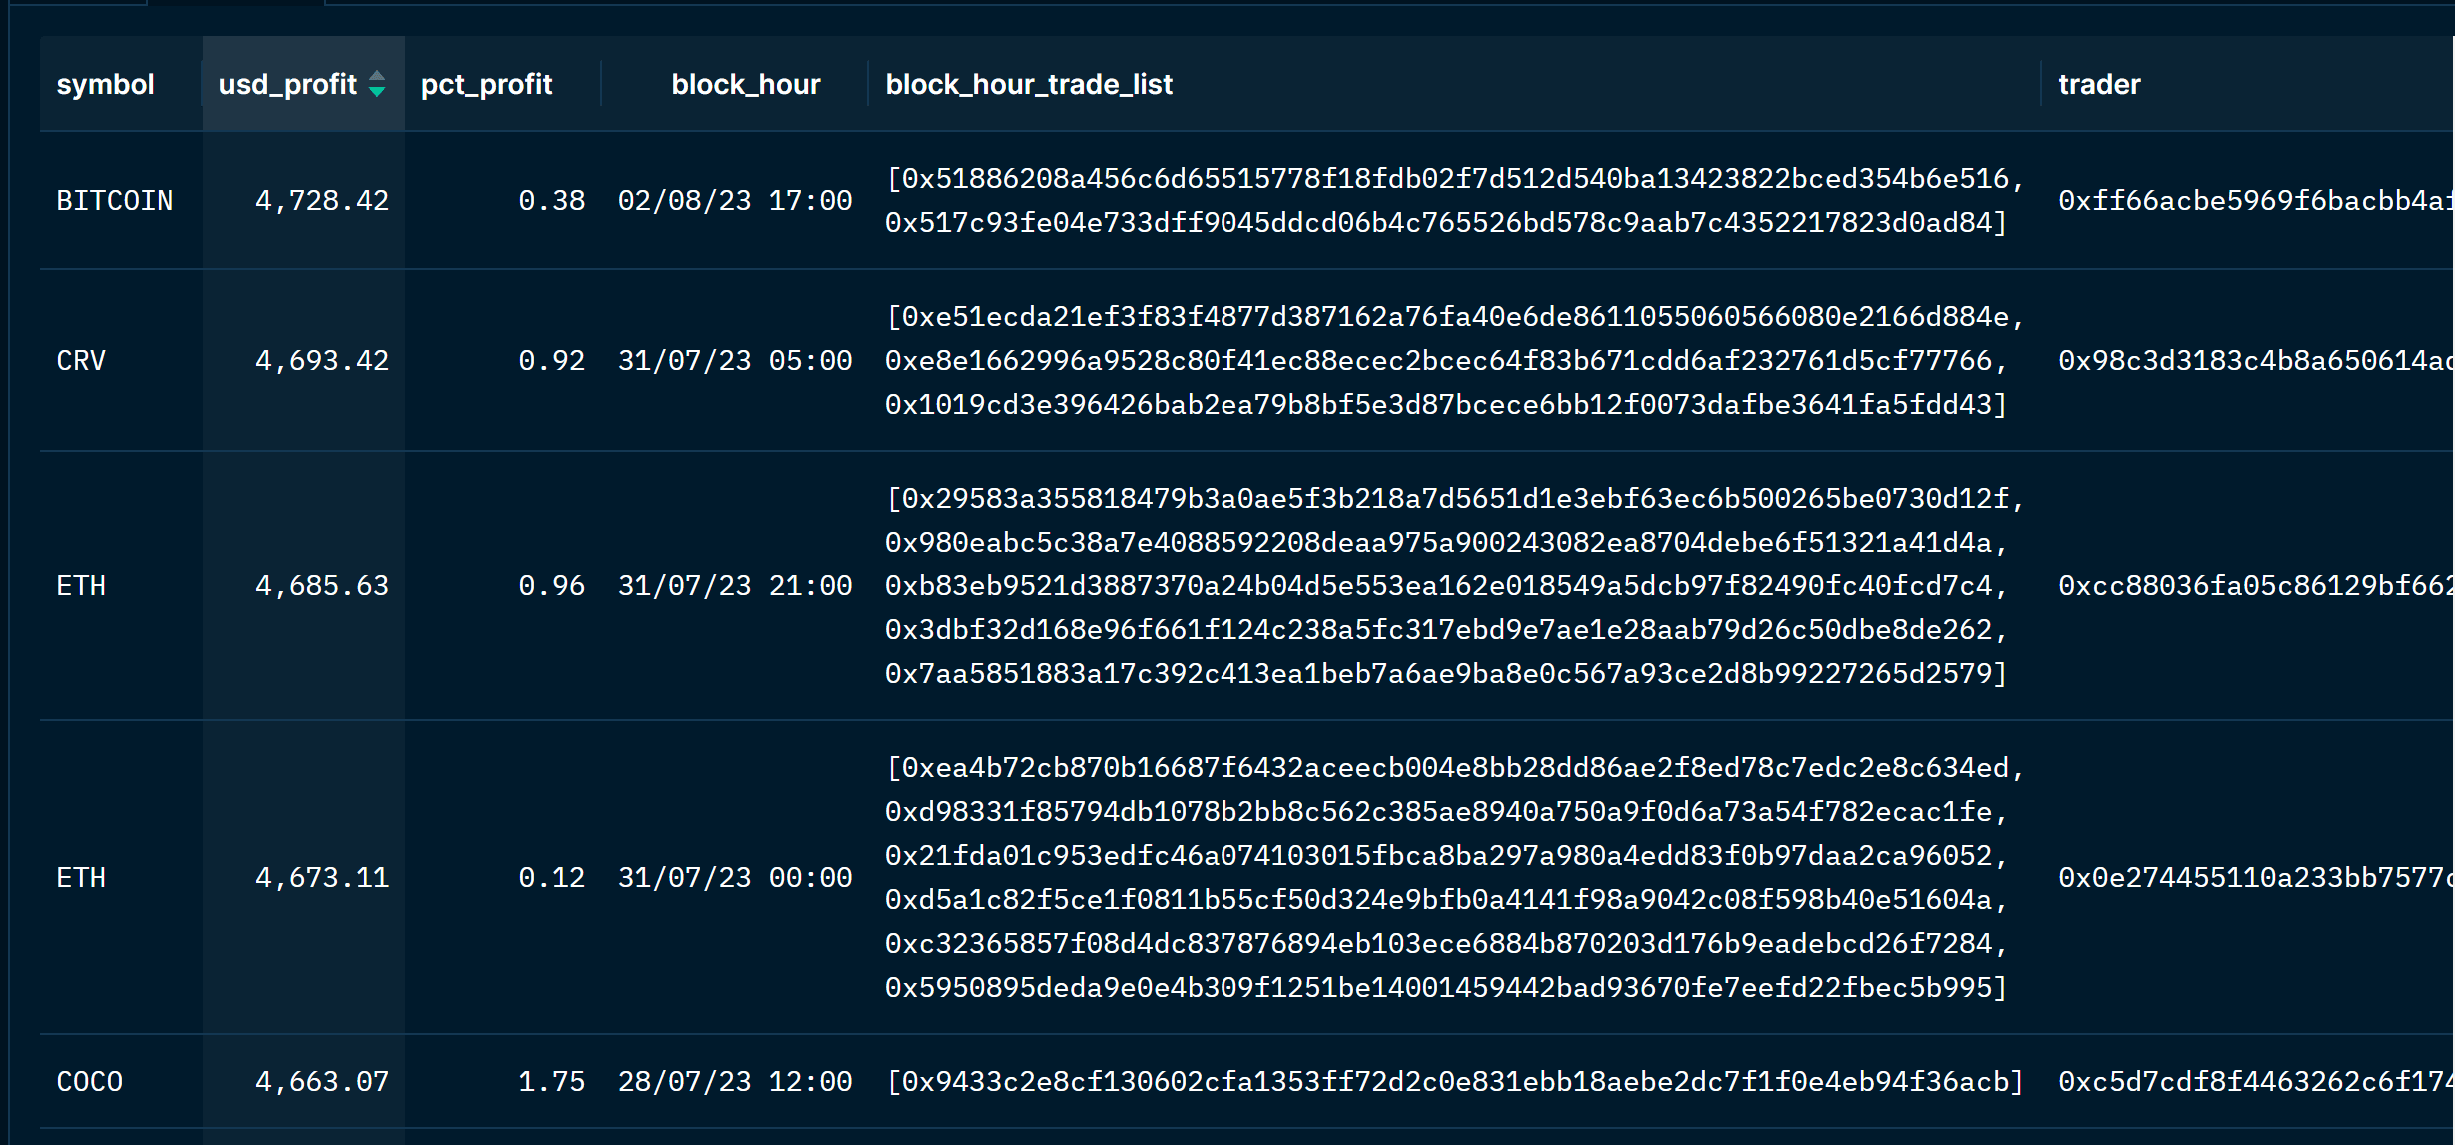
Aside from following wallets with the best track records, Nansen hourly Dex trading data can also surface outliers, in terms of P&L per trade.
While analyzing Dex data, we came across a few examples of pricing inefficiencies in liquidity pools vs off chain market prices. These inefficiencies can be relevant for traders with higher trading frequencies than daily or quarterly (the time periods considered in earlier sections).
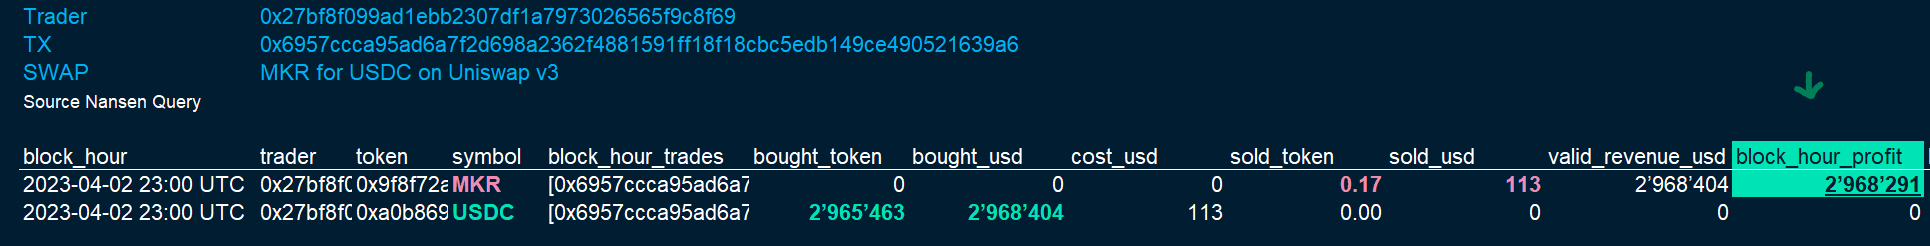
We give the example of a trade on Uniswap V2, on the MKR-USDC pool, where the trader was able to send 113 USD worth of MKR and receive 2,965,463 USDC tokens in exchange or 2,968,404 USD, for a net profit of 2,968,291 USD.
This price inefficiency persisted for a few days.
Looking at historical transactions, three large USD buying orders are visible at the same timestamp, denoting a sandwich attack with:
- An MEV bot buying a very large amount of the token
- Another trader buying a small amount at a very poor execution price
- The MEV bot selling a very large amount back
In the case of the MAKER/USDC trade above, our trader was able to insert his sell order in the midst of the sandwich, effectively front-running the MEV bot (!).
Of course, these opportunities are difficult to arbitrage because of the very low liquidity associated with price inefficiencies. Arbitraging would require strategy assumptions that take into account liquidity.