
At the heart of the summer, markets appear calm, implied volatility keeps moving down, for both crypto and equity assets. We take advantage of this apparent “recess” to review three types of crypto indicators, based on on-chain, spot price and derivative data.
This week, the US Fed, the European Central Bank (ECB) and the Bank of Japan (BoJ) meet. We analyze the potential actions and stances of the respective central banks, and the likely impact on currencies.
Crypto Compass
In this section we review the signals delivered by risk management indicators designed to help increase the ratio of returns to price drawdowns for a portfolio invested in crypto markets. The majority of indicators are based on BTC data, because BTC is the cryptocurrency with the longest existence and therefore largest historical data sample, and also because BTC price changes tend to precede the moves in the rest of the crypto market.
Aside from the signals, we also review the performance of these indicators out-of-sample and “live”, that is to say after they have been created.
Overall,
- The On-chain Smart Money Stablecoin indicator is positive crypto
- Price-based signals, the BTC Price Momentum, and the Crypto Breadth indicators are positive crypto
- The derivative indicators, BTC Call-Put Spread and Crypto Risk Premia, warrant caution
Signals and performance tests of these risk management indicators can be tracked on this Nansen dashboard.
Smart Money Stablecoin indicator
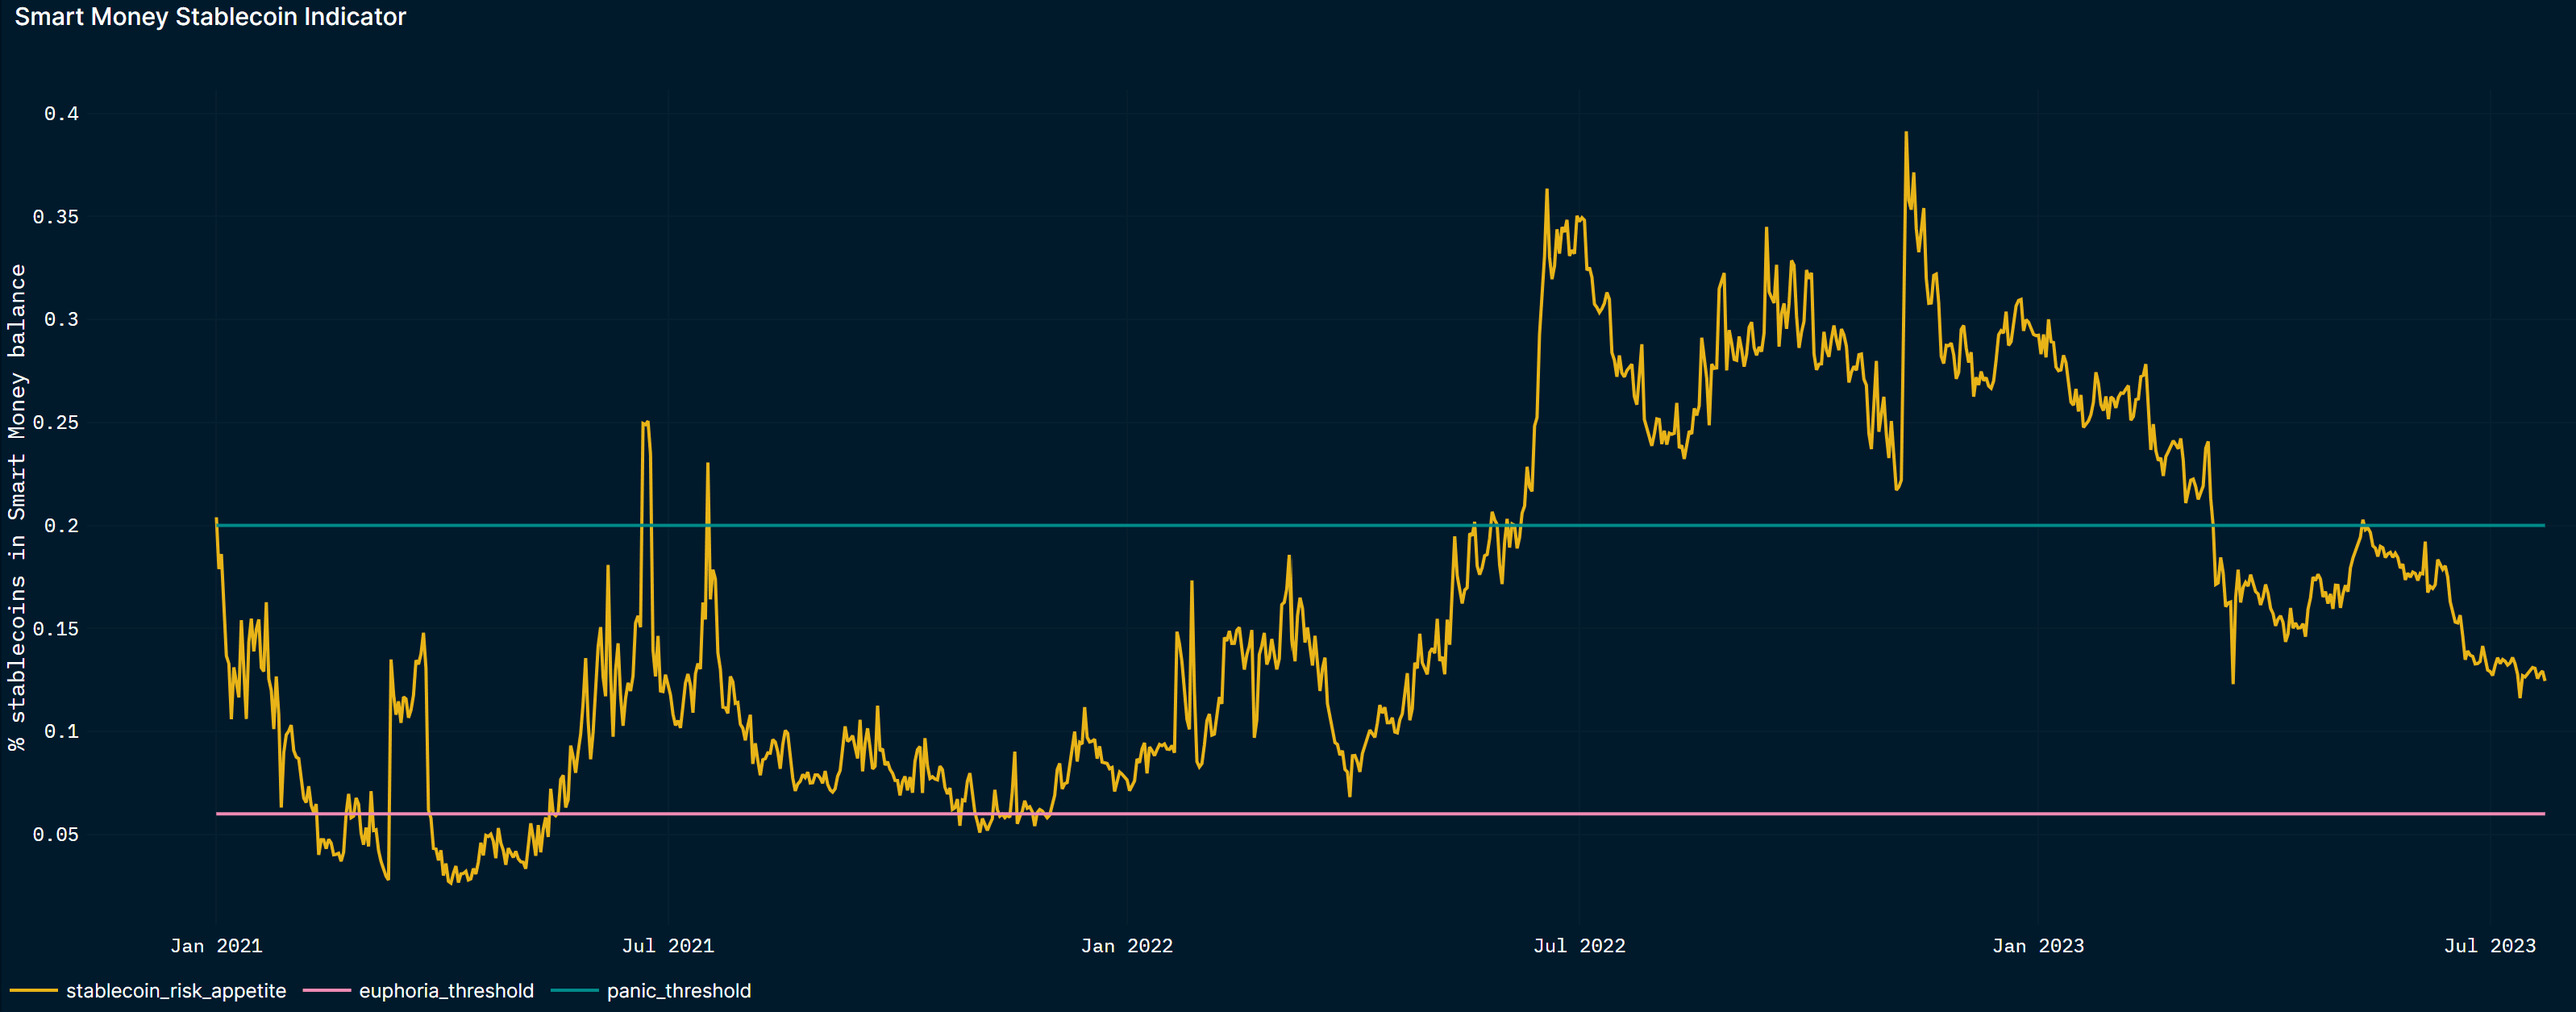
The Smart Money Stablecoin indicator measures the share of stablecoins as part of the total USD balance of Nansen Smart Money wallets. It has been “live” since the end of April 2022. The signal turned “positive crypto” in June 2022, after the UST’s de-peg, the share of stablecoin having crossed the 20% threshold. The share of stablecoins oscillated above that threshold and peaked at ~39% in November 2022, after FTX’s collapse. Since then, this share has been declining, suggesting that Smart Money investors’ non-stablecoin USD allocation has been increasing, pointing towards less bearishness.
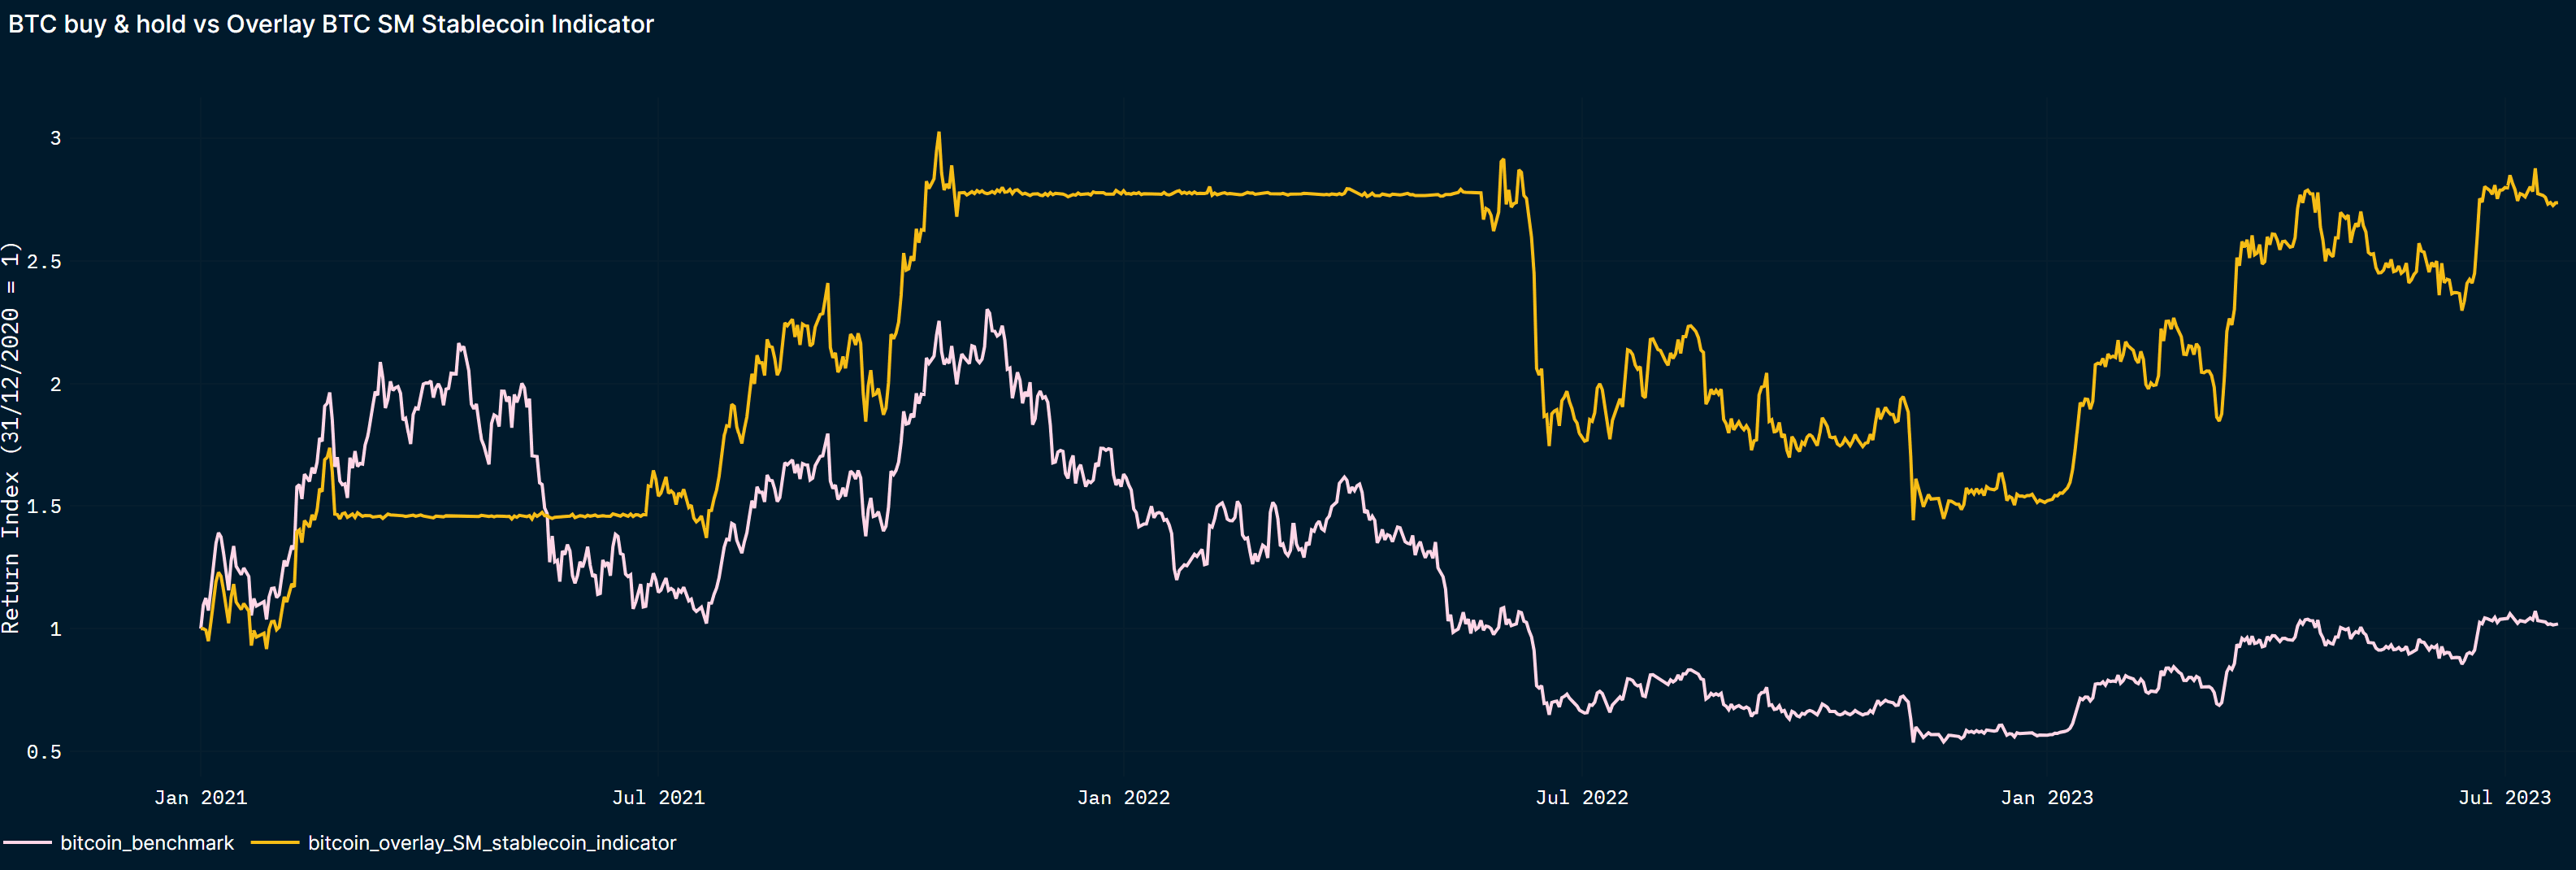
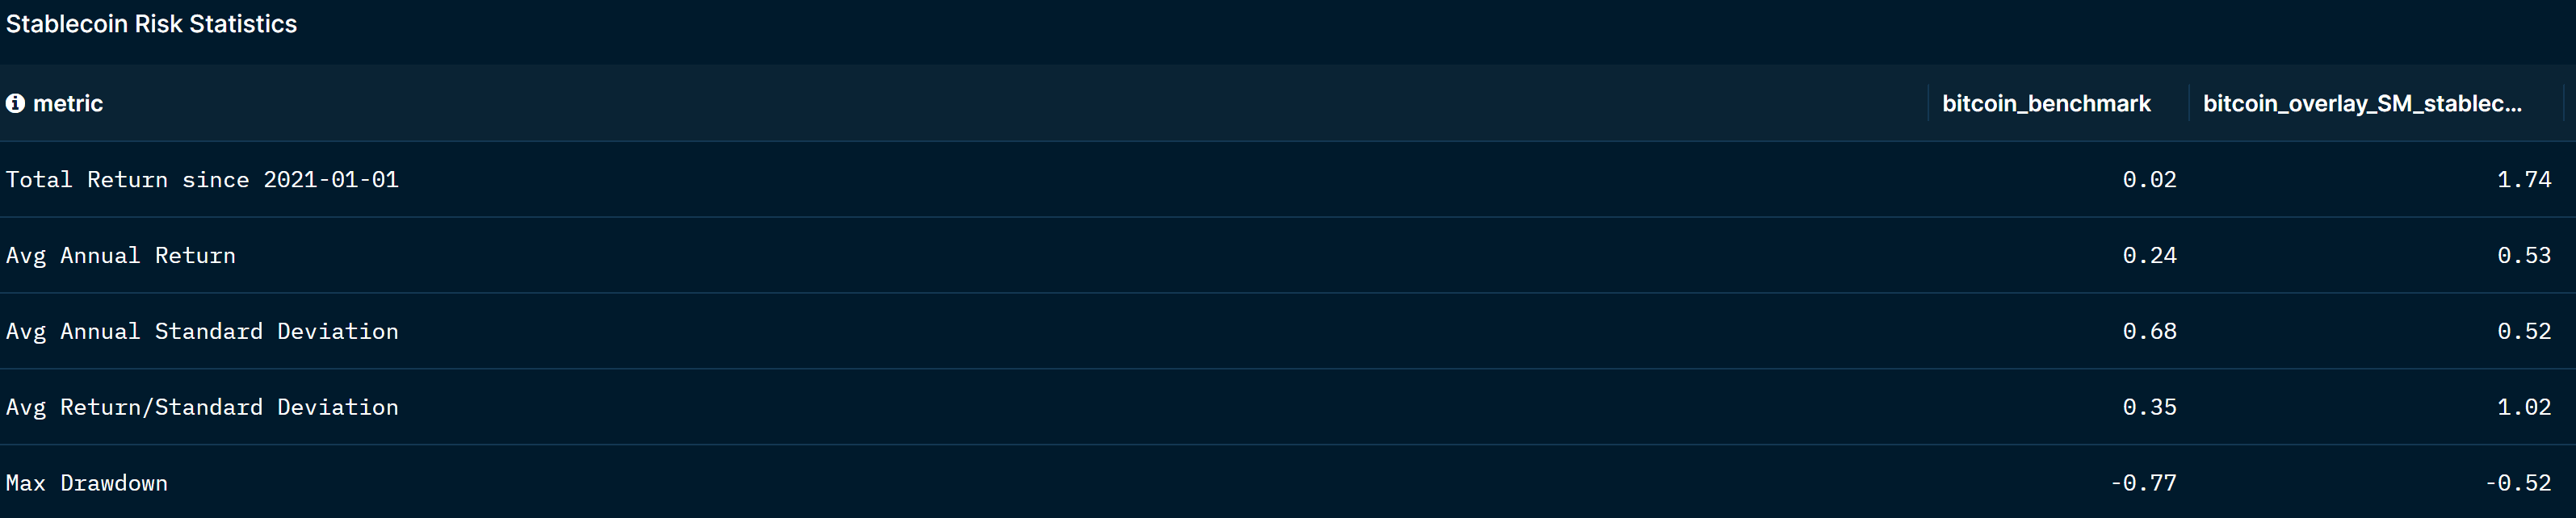
Out-of-sample and live, overlaying the signals of the Smart Money Stablecoin indicator with a BTC-buy-and-hold strategy led to shallower drawdowns (-52% instead of -77% since 2021) without sacrificing returns.
Price indicators
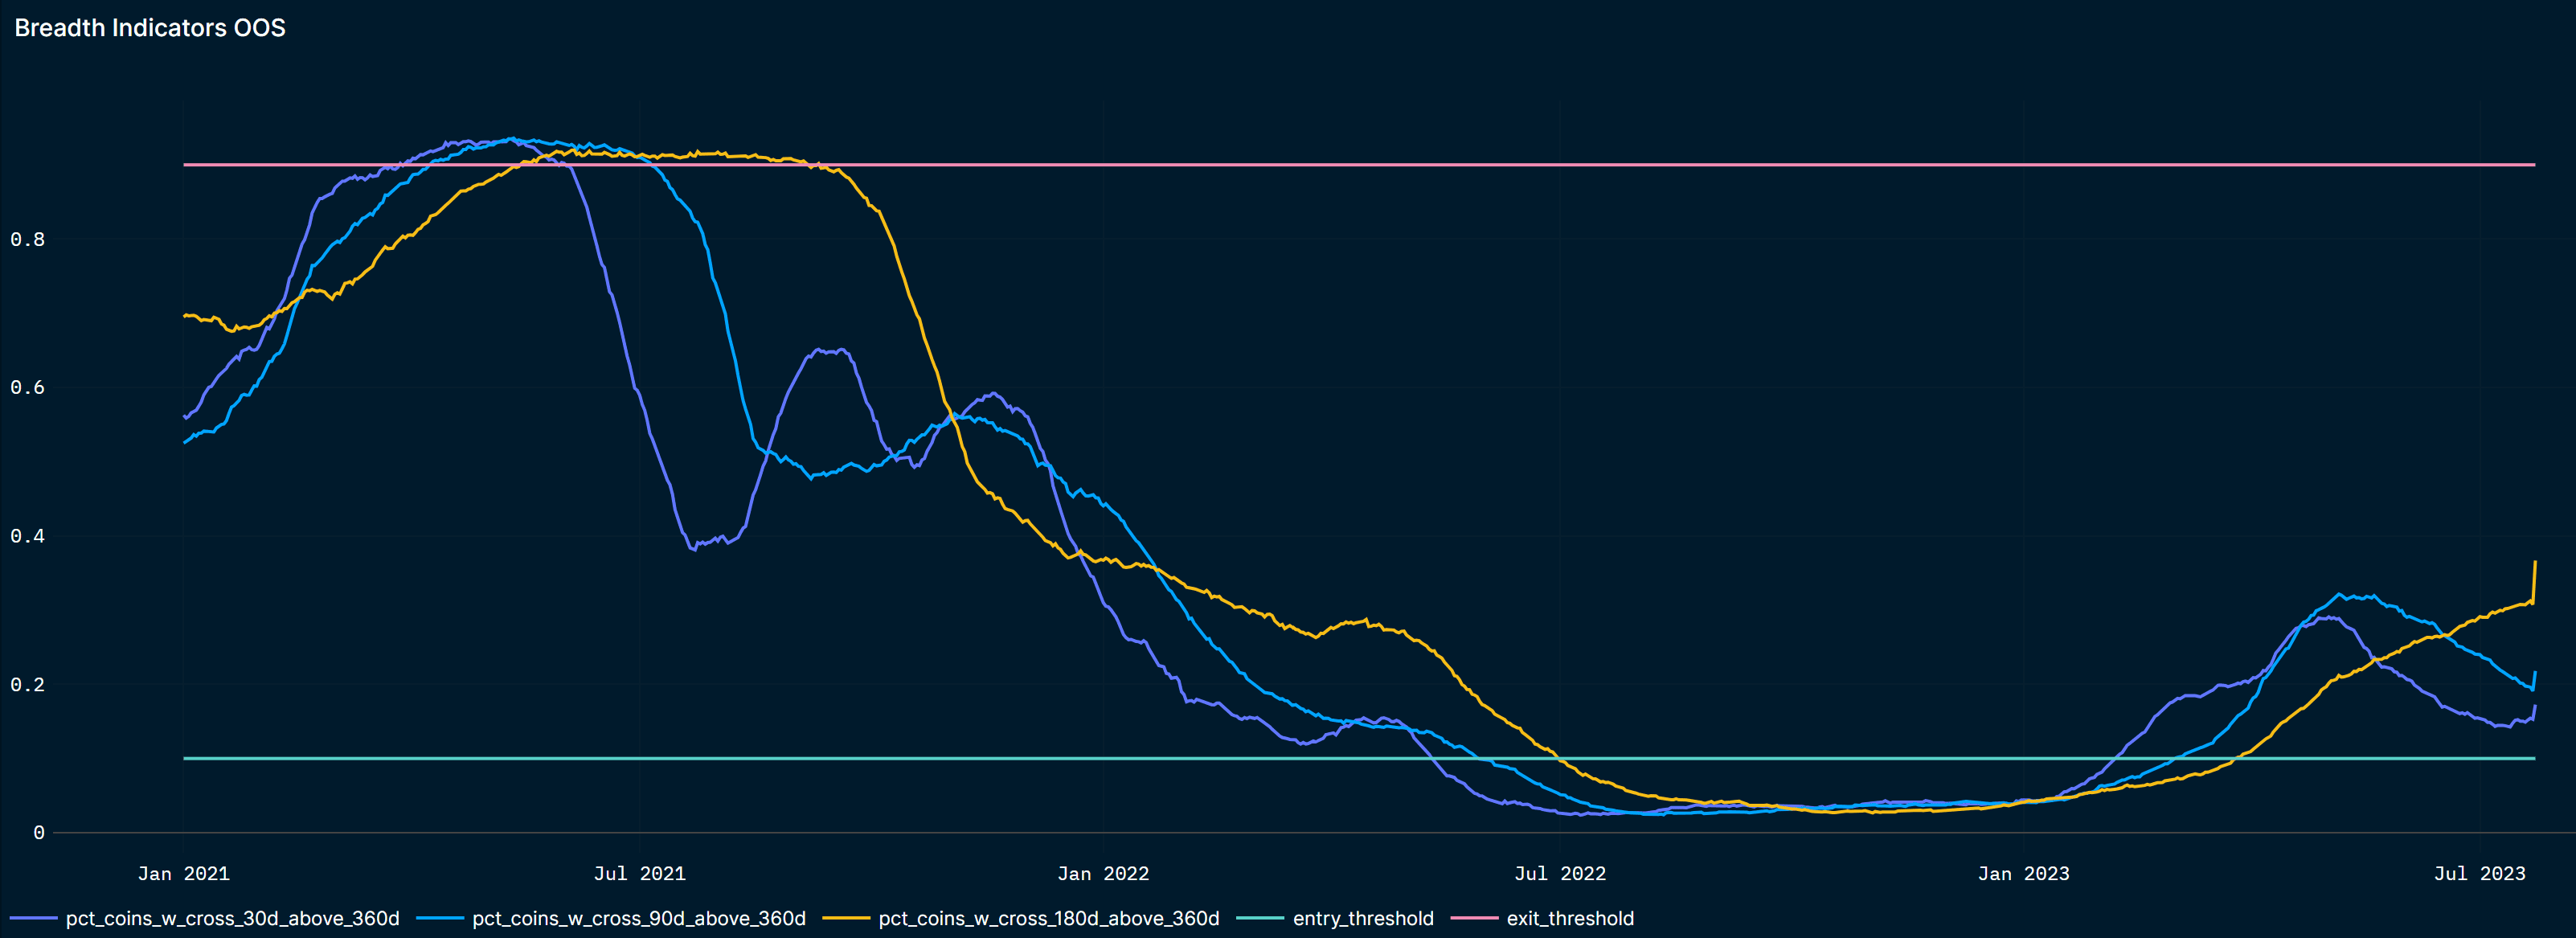
We also look at the breadth of cryptocurrencies having “improving” technicals, and we define “improving” technicals by the “fast” moving average of a price crossing above the “slow” moving average of a price. The share of cryptocurrencies with upward moving averages increased above 10% in February 2023 - March 2023 and has remained above 10% since then.
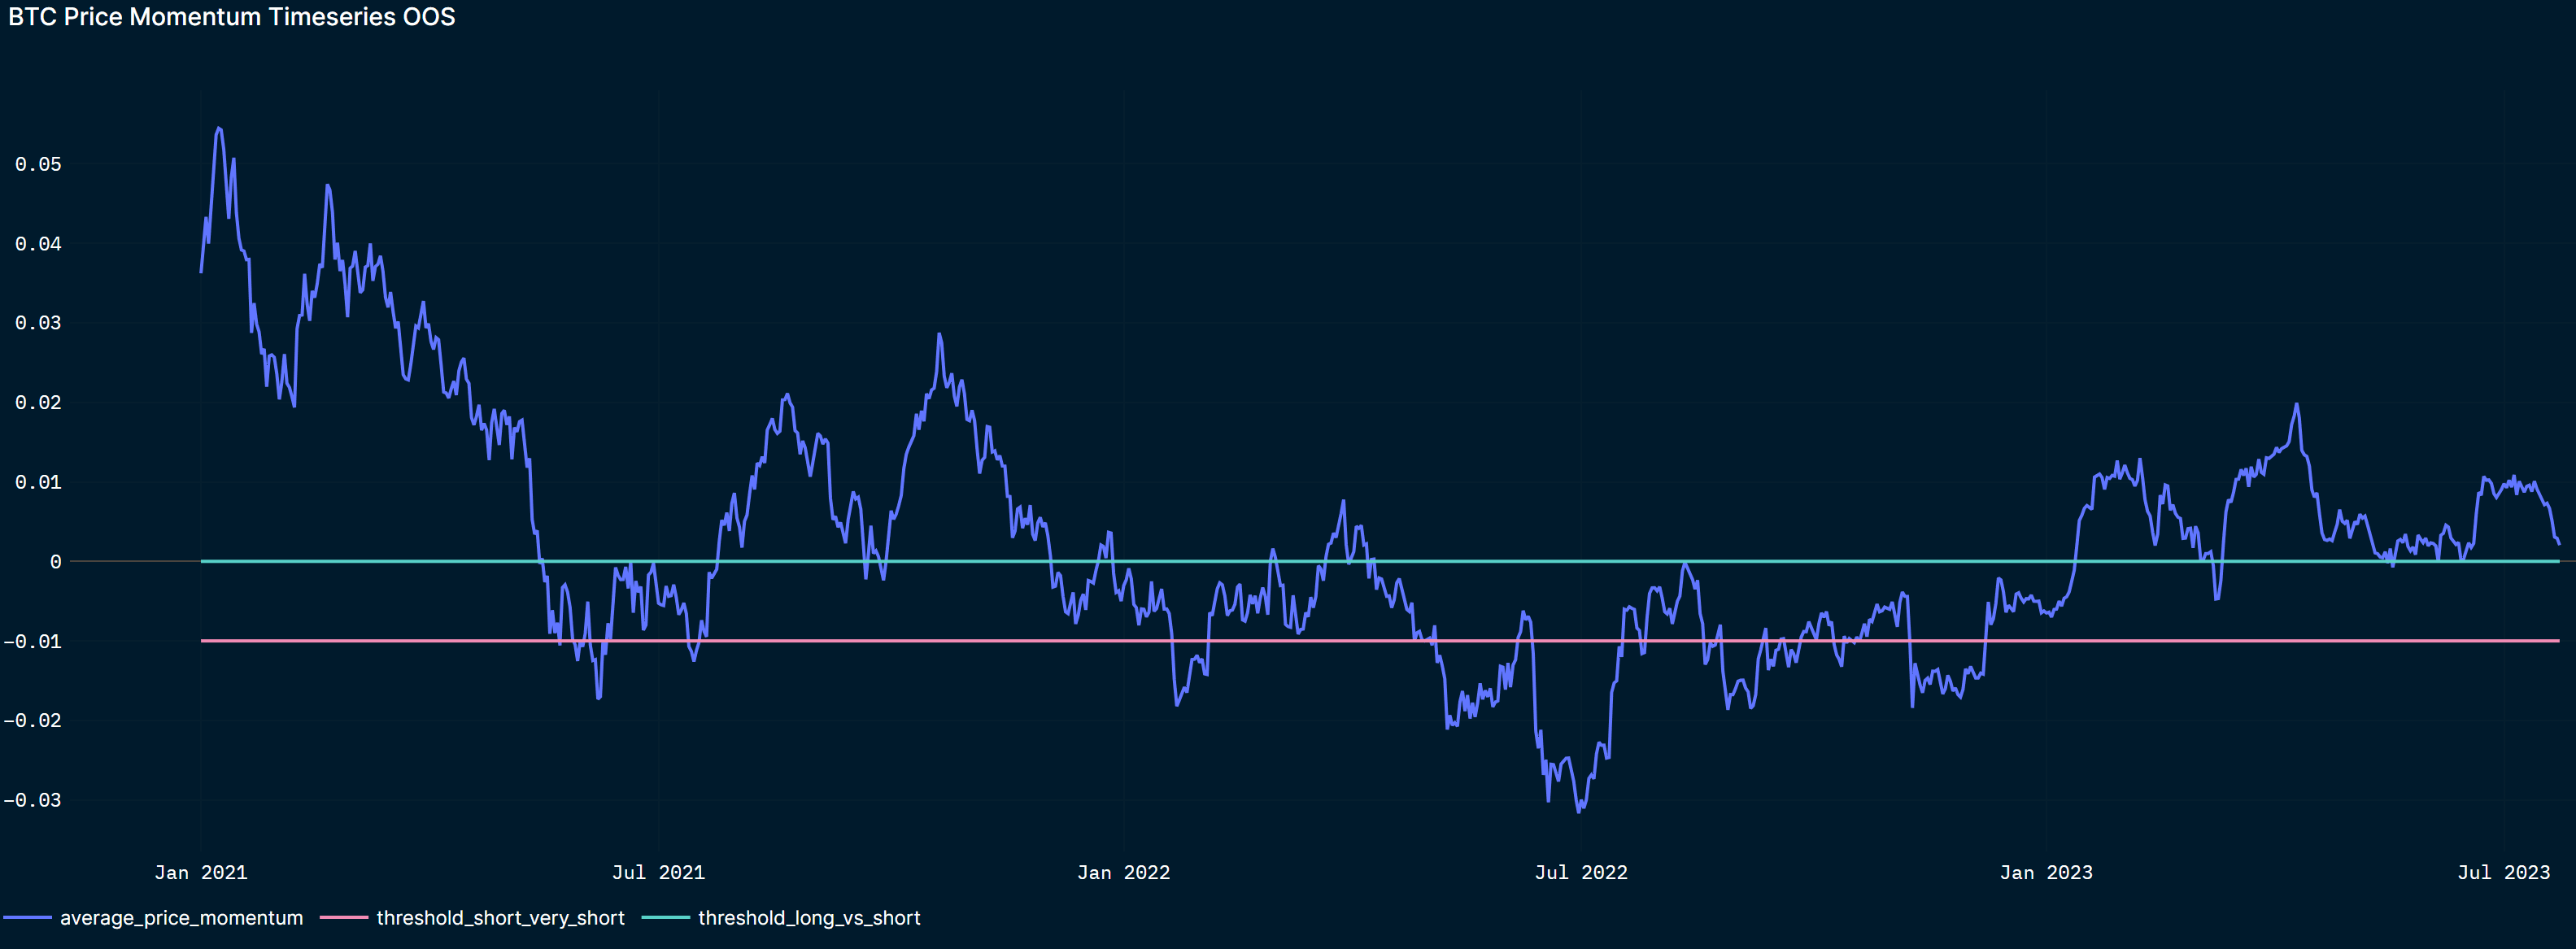
Staying with price data, calculating the return of BTC/USD over various lookback periods gives us a measure of the “BTC Price Momentum”. The BTC Price Momentum has been above zero (positive crypto) for most of 2023. In May 2023, the indicator crossed from time to time below zero, flagging the sell-off that coincided with the news of the US Securities and Exchange Commission investigating Binance and Coinbase. Nevertheless, the momentum improved and climbed above zero after May.
These price indicators have comparable to slightly lower returns than the Smart Money Stablecoin indicator:

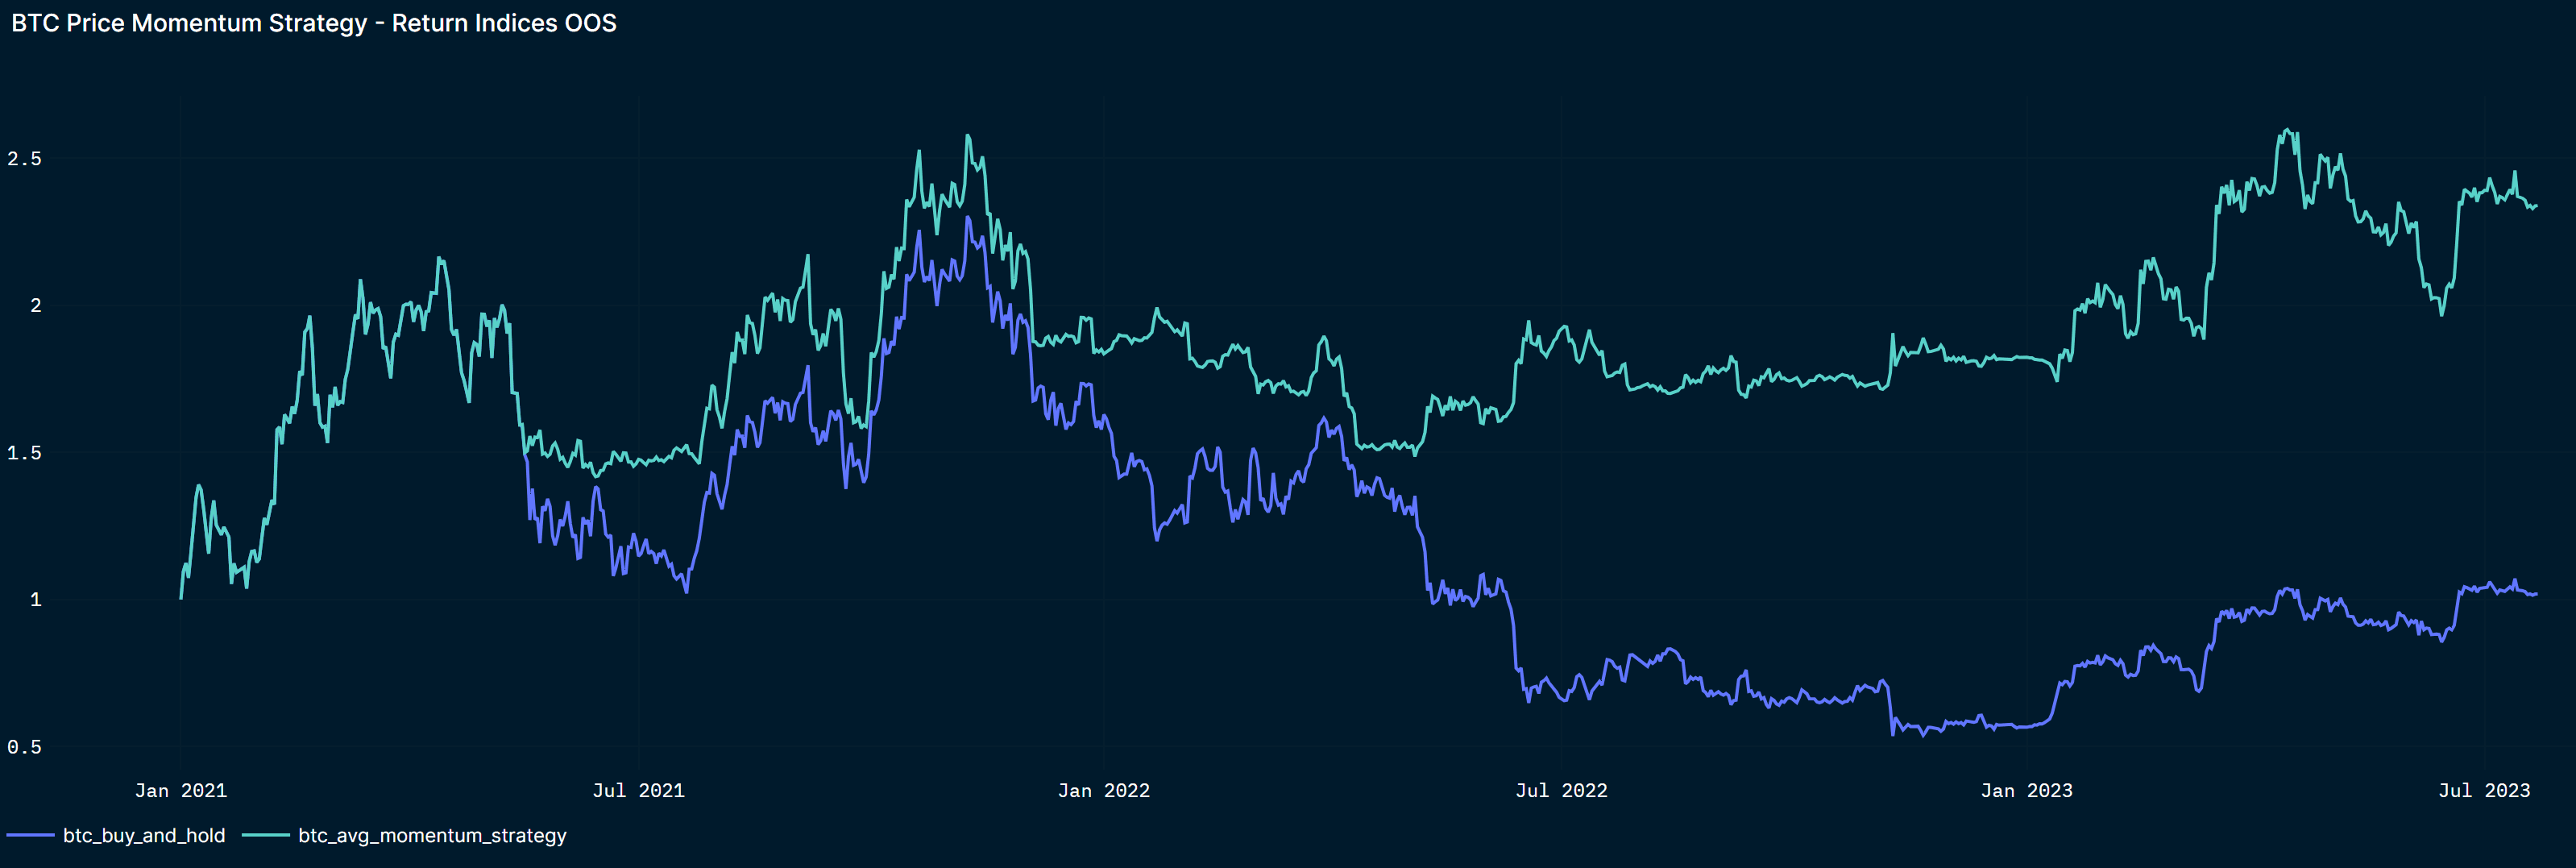
They also reduce the drawdowns of a simple BTC buy-and-hold strategy. The indicators have been followed “live” since May 2023.


Derivative indicators
The derivative indicators are the odd-ones-out: whereas price dynamics and on-chain dynamics tell us that crypto markets have probably bottomed after the Terra and FTX demises, derivative markets send cautious messages.
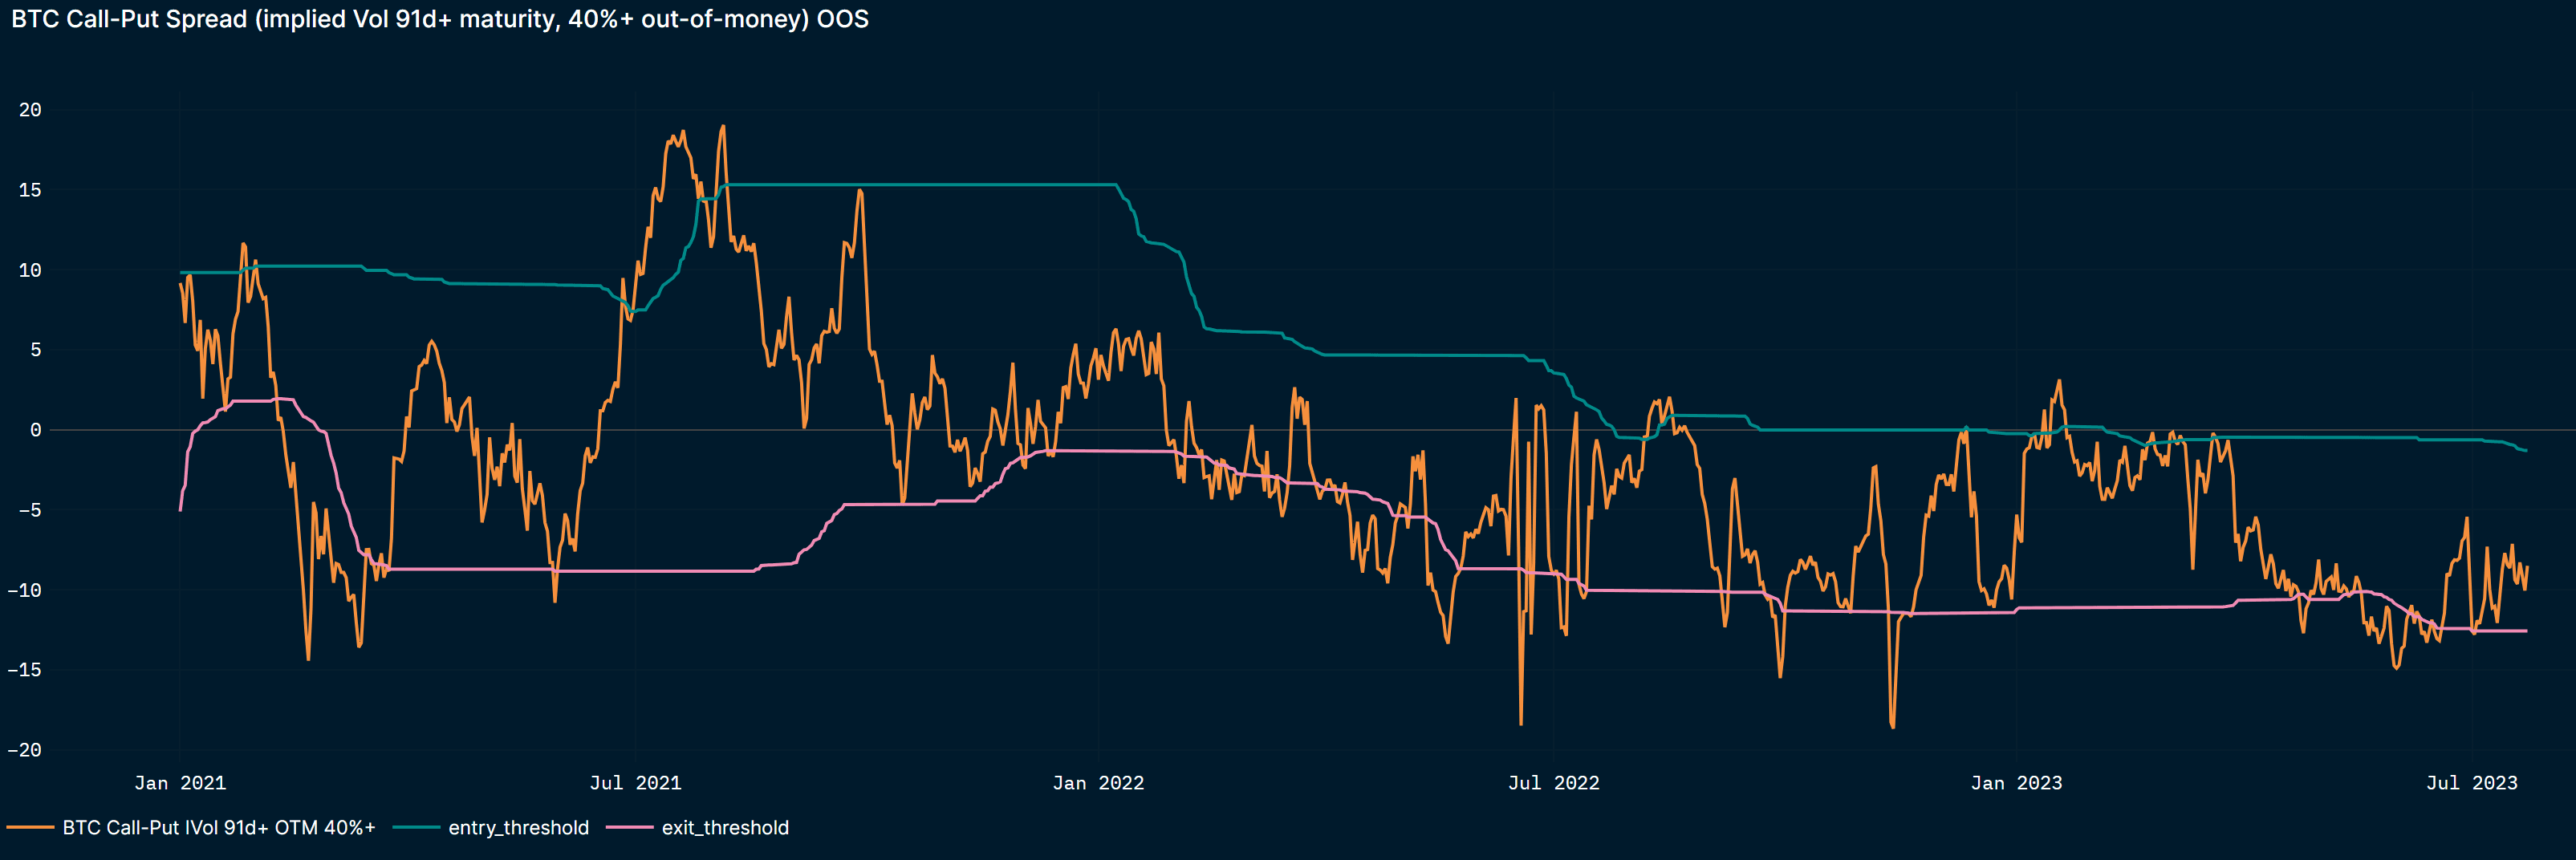
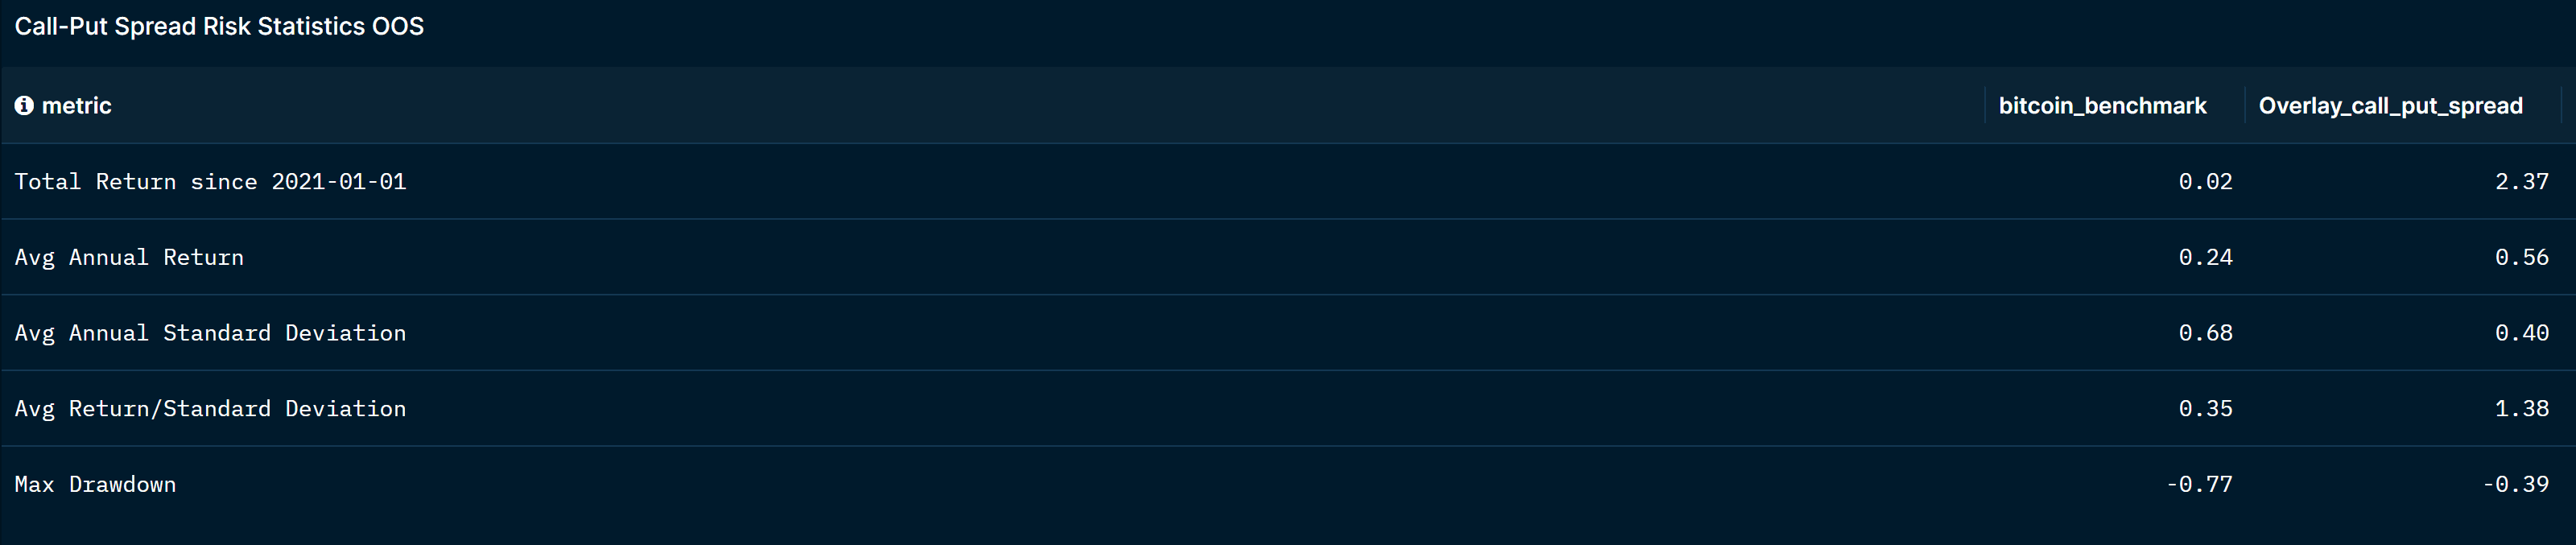
The first derivative indicator, the BTC call-put spread, is the one with the highest frequency of signals among all our risk management indicators, it changes from “positive” to “negative” crypto and vice versa four times a year. It has been “negative” crypto since April 2023, meaning that the relative price difference of calls vs puts is lower than historically.
Turning to our last indicator, the BTC Crypto Risk Premia, we observe that this derivative measure of the SVIX, based on the implied volatility of traded crypto options, has kept declining and, at ~30%, is now close to the lows of our historical sample (earliest data available as of 2020). We read this as the decline in the level of uncertainty perceived by crypto option investors in markets. Interestingly, the same downward trend can be observed in equity markets. This low level of risk premium tells us that there is a relatively small “cushion” for any major negative macro shock to crypto and equity markets.

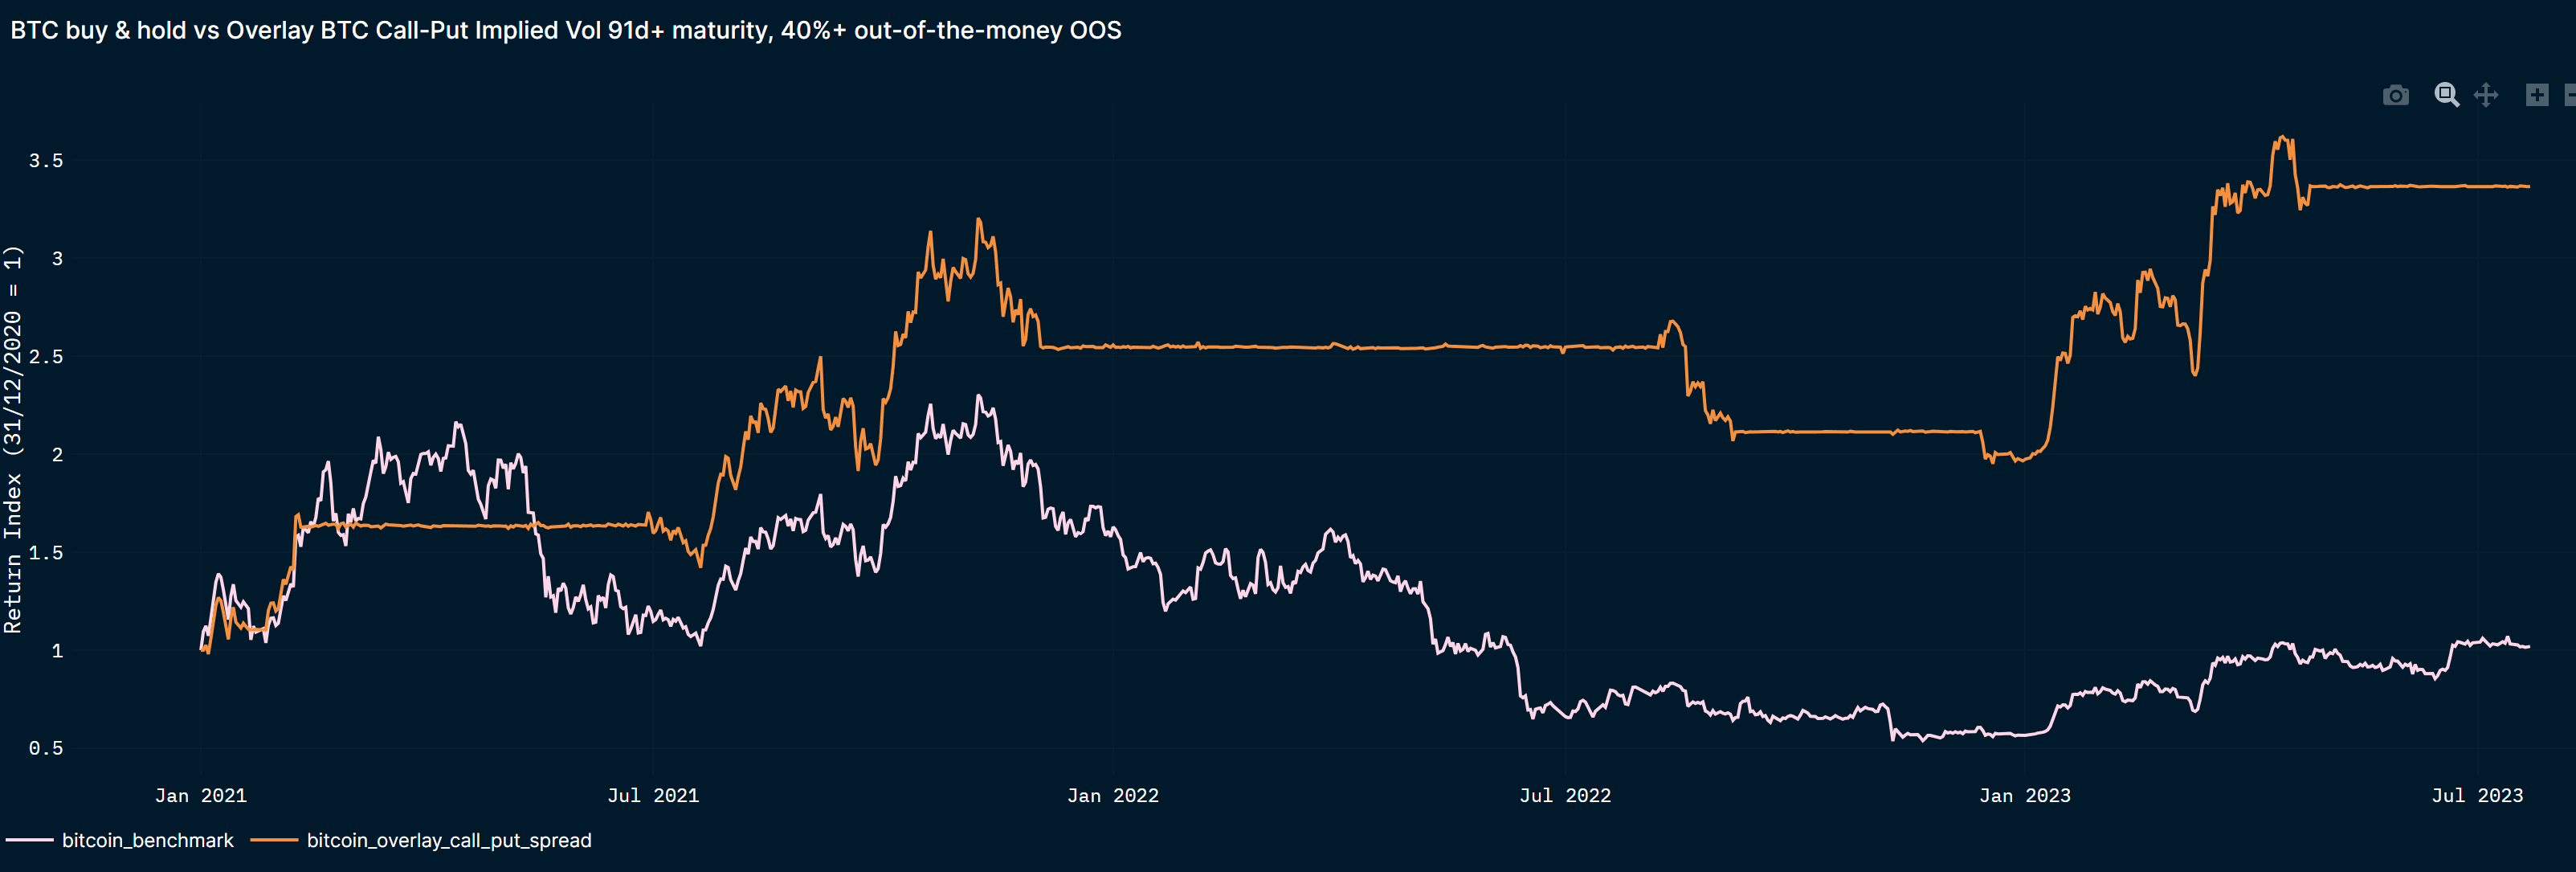
The two derivative indicators are “live” since January 2023. The BTC call-put spread has the best track record of our risk management indicators so far in terms of risk-reward:


Putting it altogether
The improving technicals of crypto prices and the declining share of stablecoins in investors’ on-chain wallets tell us that the lowest point of the crypto winter probably occurred after FTX collapsed last year.
However, derivative indicators warrant caution, meaning that price drawdowns would probably surprise market participants in both equity and crypto markets.
Indeed, turning to a more qualitative macro view, we see positive drivers, namely, on the macro side, desinflation and, for crypto, increasing regulatory clarity. The issue is that financial markets have the same interpretation. US future markets expect Fed rate cuts to start as early as March 2024, and measures of uncertainty in risk assets are back to pre-covid levels.
The summary of these signals is therefore a tactical view, taking advantage of price drawdowns to enter crypto and sizing the allocation to crypto with the expectation of increased volatility going forward.
Central banks and FX
As the US Fed, the ECB, the BoJ meet this week, their communication mission will probably appear less complex than in prior meetings, with inflation in the respective countries surprising to the downside. Since April, shelter inflation has started to come down in the US, food and energy inflation have slowed or even turned negative YoY (for energy) in many countries.
Nevertheless, from the point of views of the Fed and the ECB, their mandate of returning inflation to 2% is still not accomplished. Meanwhile, labor markets are tight and growth is holding on: there is no pronounced worry about employment yet.
This is why overall we expect more hawkish Fed and ECB meetings than what markets project, with two respective hikes of 25bps, and Fed Chair Powell flagging “high for long” policy rates, and President Lagarde reiterating that the “destination” has not been reached yet in terms of ECB policy rates.
Turning to Japan, BoJ Governor Ueda’s rhetoric has been very ambiguous as to when the BoJ will normalize its ultra-easy monetary policy (exiting the yield curve control scheme and / or hiking the still negative short-term policy rate). Governor Ueda has pointed towards wage growth as a key indicator to gauge “underlying” inflation. Wage growth has increased in Japan to just below 2% YoY (excluding overtime). All conditions are reunited for the BoJ to normalize its policy but, as the central bank does not practice forward guidance nor data dependency, it is difficult to time this move. The risk / reward remains for lower USD/JPY.
For other currencies: the drivers are still somewhat positive for GBP/USD, less so for EUR/USD. We note that the relative growth of the US vs Eurozone has been in favor of the US recently, which might make it more difficult for the EUR/USD to appreciate further. The question is: can the ECB hike more than the Fed from here? If the inflation paths of both regions converge, and growth weakens further in the Eurozone, more so than in the US, it might favor the USD vs the EUR.
We summarize the findings of our FX model vs the USD below. It measures rate differentials (carry), price changes over various time horizons (momentum) and whether the currencies are historically cheap or expensive (value) vs the USD:

This week: Fed, ECB, BoJ meetings
Tuesday 25
- US CB Consumer Confidence (July consensus 111.5)
Wednesday 26
- The US Fed meets. A 25 bps-rate-hike to 5.25% is fully priced. Because futures are pricing no more rate hikes, and even the start of rate cuts in March 2024, our bias is for Fed Chair Powell to acknowledge the latest encouraging CPI print but to surprise on the hawkish side for the outlook.
Thurday 27
- The ECB meets. A 25 bps-rate-hike to 4.25% is also priced in. We expect hawkish guidance from President Lagarde (Eurozone wage growth still high, core CPI did not surprise to the downside in June like in other countries).
- The BoJ meets. The data and market conditions (weak JPY, wage growth close to 2% YoY) are met to normalize policy, but it is difficult to time when Governor Ueda will decide to act.