
Introduction
This report focuses on studying different groups of ETH traders by analyzing their on-chain behavior. The main objective is to determine if traders are able to manage their risk effectively by buying low and selling high. Additionally, the analysis will track the activity of the most successful traders measured by Profit and Loss (PnL) to gain insights into their profitability.
What to Expect?
The report will be broken down into two main sections. The first section will identify timely traders who are opportune during periods of volatility. This section will focus on their trading acumen to buy or sell at lucrative times but it will not focus on their overall profitability.
The second section will look into the most profitable traders over different timeframes. Together, these aim to provide new data points for on-chain traders to use when assessing a trade.
Methodology
As DEX trading grows, on-chain data will become an increasingly important tool for traders to make informed decisions. Our research strictly looks at DEX trades for WETH from the three top stablecoins in volume - USDC, USDT and DAI. All other pairs are excluded given their volumes are insignificant compared to these stables. The analysis covers WETH, not native ETH. Although Uniswap and other DEXs display ETH in the frontend, it is actually WETH behind the hood. Thus, the analysis will capture the majority of DEX trading volume via WETH.
The trading volumes may include swaps where the final token is not WETH. In some cases, another altcoin that is paired with WETH. Given this, the volumes mentioned below give us a broader sentiment than just ETH alone. With many altcoins being somewhat correlated to ETH, especially during the dips and tops, it can give insight into potential altcoin rotations. Even though other trades are captured, not just WETH <> Stables, it is rather inconsistent but nonetheless it will introduce some noise into the findings.
Again, our trading segments will be broken down into two groups:
- Timely Traders
- Dip Buyers
- Top Sellers
- Profitable Traders
- 2020 Onwards PnL
- 2022 PnL Traders
- 2023 PnL Traders
- 30D PnL Traders
The reason for investigating these two groups of traders is that profits can be difficult to calculate accurately. There may be scenarios where the entry price is not known, such as when a trader buys ETH on a centralized exchange (CEX) like Coinbase and then sells it on a decentralized exchange (DEX) like Uniswap. For instance, a trader who bought 100 ETH from Coinbase at $100 and sold on Uniswap for $1000 will not have the $100,000 in profits captured given the PnL does not capture off-chain data from CEXs. To ensure a comprehensive analysis, the report aims to cover both types of traders: those who consistently make profitable on-chain trades, and those who are skilled at managing their risk using DEXs.
Prefacing the Analysis:
- Traders identified may be hedged and this is not covered
- Copy trading is not straightforward - many strategies are used, including hedging
- Most volumes go through CEXs, this is a minor data point in the grand scheme of trading
- The PnL data is not perfect and covers 90+% of all DEX volumes on Ethereum
- The data mainly looks at Ethereum EOAs, no other chains are analyzed
Part I: Managing Trading Risk
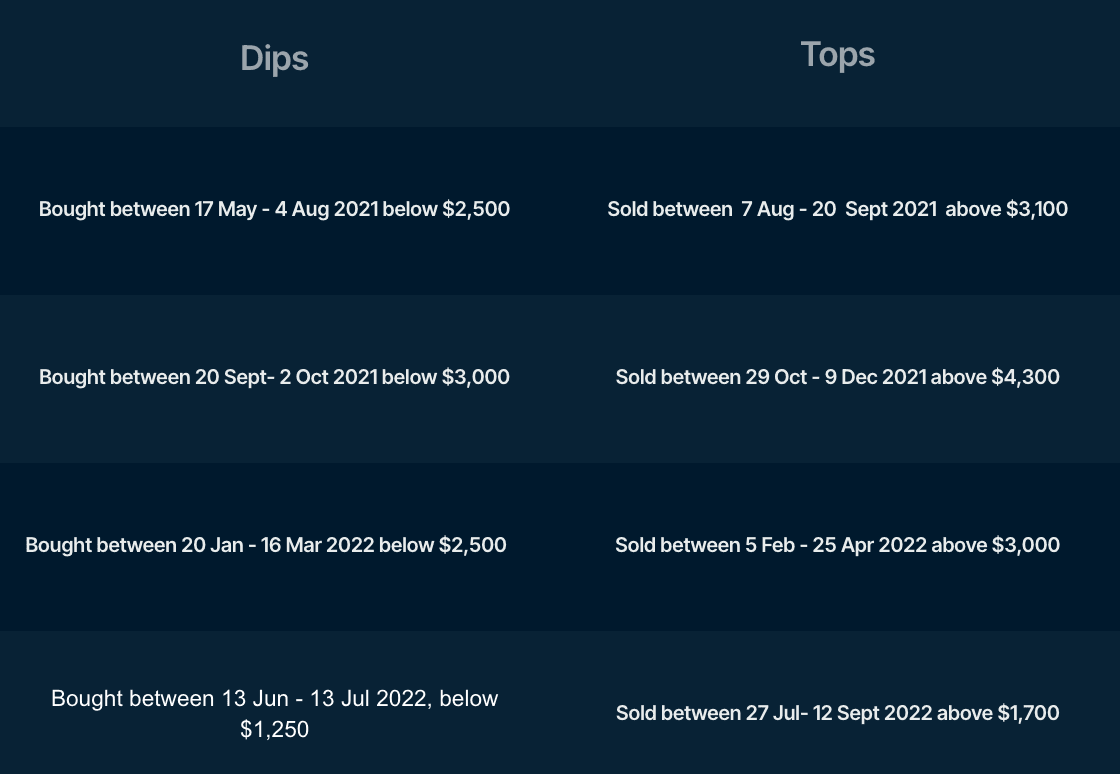
Our analysis wanted to dive deeper into whether or not wallets were as effective at buying/selling as they might claim on Twitter. To do this, the report breaks down four specified dips and tops over the past two years (2021-2022):
The analysis aims to determine if traders can buy low during dips and sell high during tops. However, the results showed that no trader was consistently successful in doing so across multiple dips and tops. Individual traders may have been successful once, but not consistently.
Given these results, the analysis will strictly look at dips and tops independently. However, the ‘Dip Buyers’ may be underwater today given two of the dips may have been bought up to as high as $3,000/ETH. Given this, ‘Dip Buyers’ may be less of a signal compared to ‘Top Sellers’ given the ‘Top Sellers’ locked in their profits at the defined tops which are much higher than today’s prices. From here, we can look into if:
- Dip Buyers can indicate a potential buying opportunity
- Top Sellers can indicate a potential selling opportunity
Can Traders Buy The Dip?
The data reveals that only very few traders can consistently ‘buy the dip’. This is based strictly on spot DEX trading behavior of net inflows of ETH during the specified dips. We explore four notable dips mentioned above and will repeat them for reference. Below, are the historical dips that were followed by large upside.
- Dip 1
- Bought between May 17 - Aug 4 2021 below $2,500
- Dip 2
- Bought between Sept 10 - Oct 2 2021 below $3,000
- Dip 3
- Bought between Jan 20 - Mar 16 2022 below $2,500
- Dip 4
- Bought between June 13 - Jul 13, 2022, below $1,250
Once we received all of the trading activity for these periods, we filtered down to wallets that bought more than 50 ETH across 2 or more dips. After the conditions were applied, only 23 wallets remained. 13% of them bought 4/4 dips, 21.7% bought 3/4 dips, and 65.2% were able to buy 2/4 dips. The below table shows the top dip buyers, sorted by net ETH bought.
ETH Dip Buyers Leaderboard
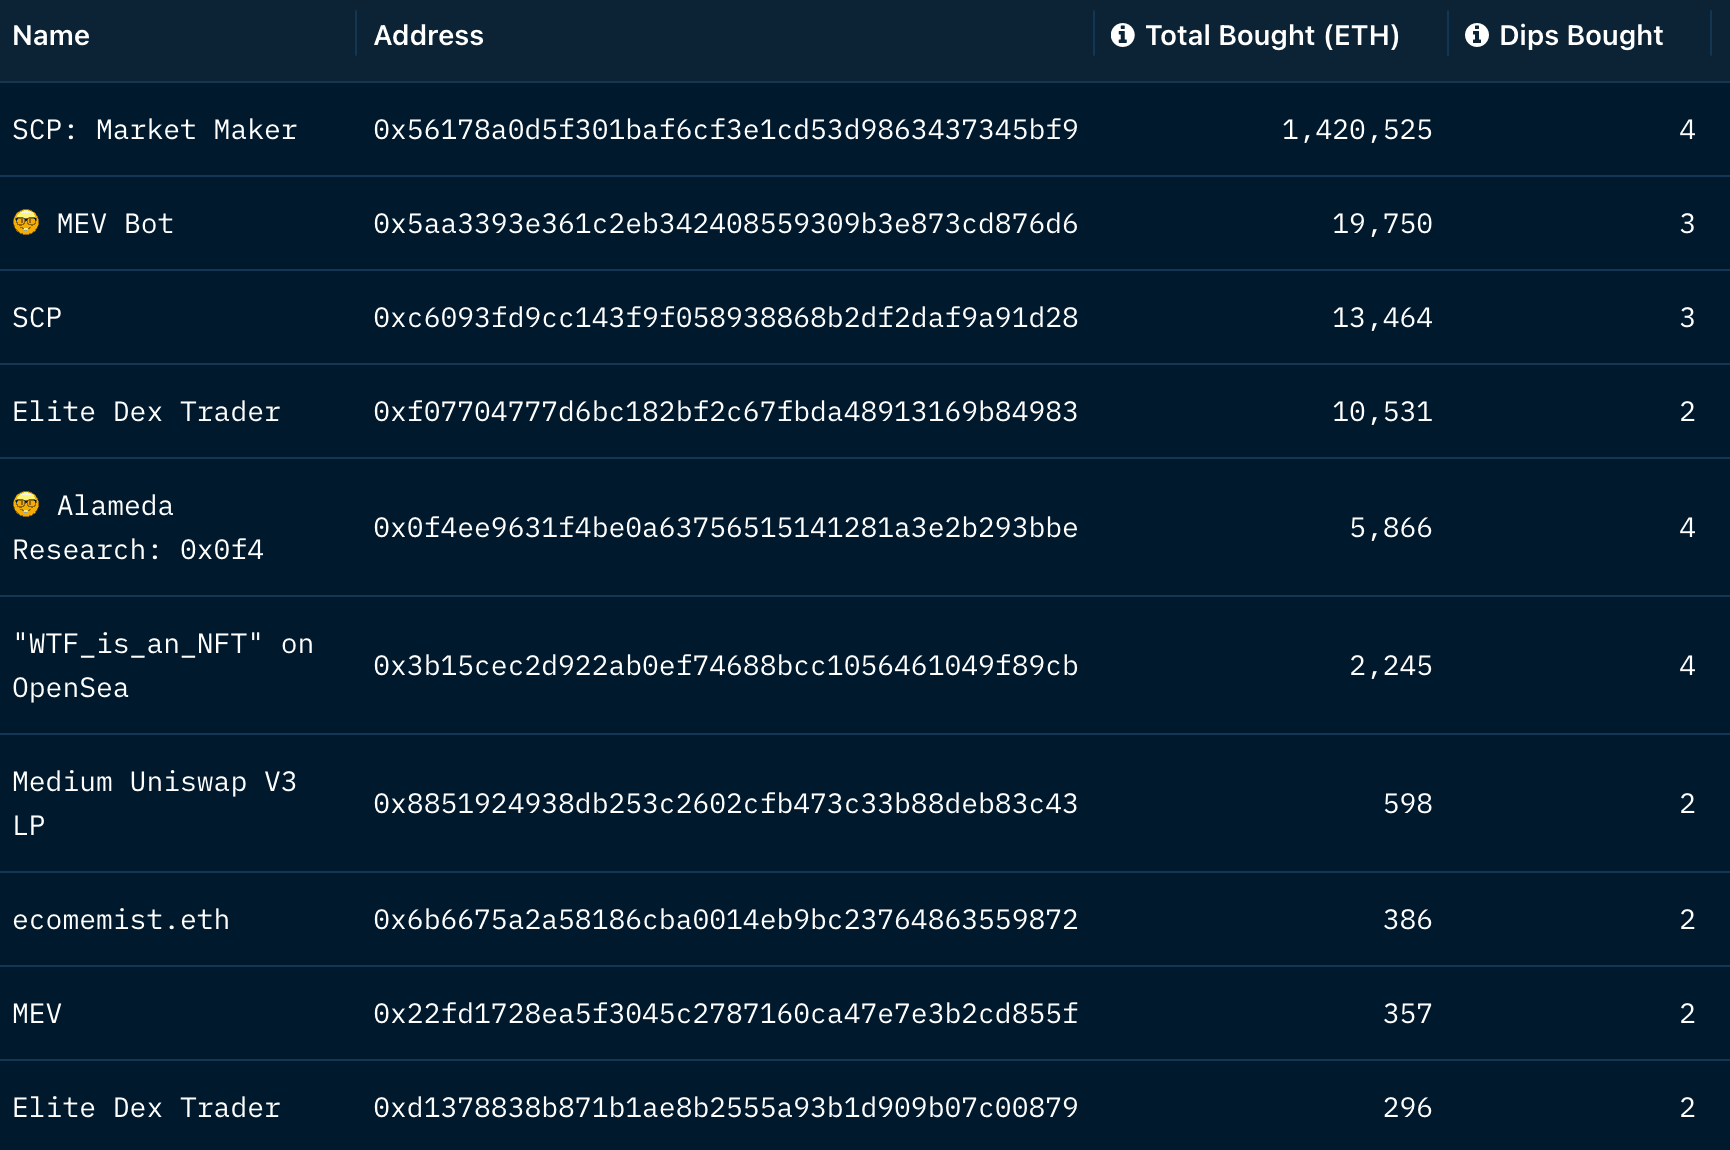
From the above, we can see that some traders had success buying throughout the dips. However, a few of the top wallets listed are market makers or MEV bots, which tend to be noisy. The other EOA wallets can be investigated further and track them using this Smart Alert. Collectively, these 23 wallets were able to accumulate 1,475,622 ETH across the four dips. However, two of SCP Market Maker’s wallets accounted for over 96% of it due to its market-making activity, whereas the other 21 wallets only ended up buying a collective 41,634 ETH.
Again, even though these wallets were able to buy the local dips, they may be unprofitable given today’s much lower prices. Additionally, some wallets may just be consistently buying ETH frequently, even at higher prices, so the average entry price may be worse off than the pre-defined dips. With this in mind, has the ‘Dip Buyer’ been consistent in buying other dips not covered?
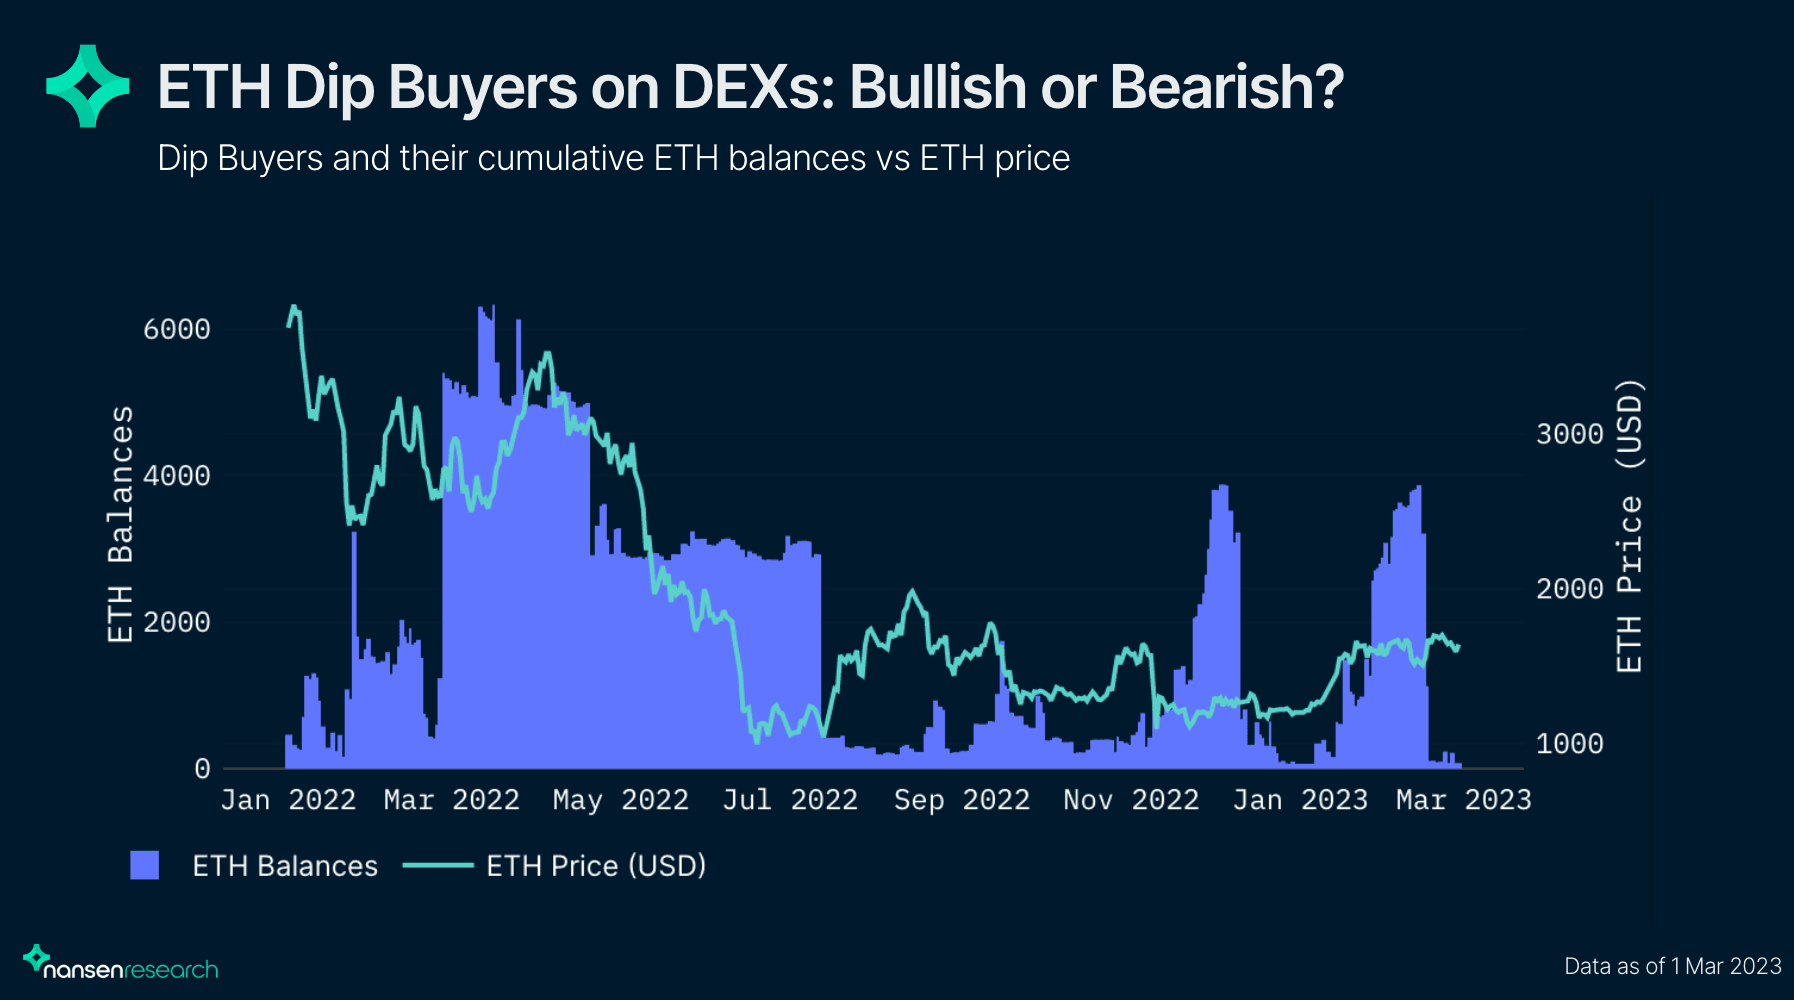
The above chart shows the ETH balances across the ETH Dip Buyer segment against the ETH price. From the chart, we can see a lot larger movements of ETH during 2022 compared to the start of 2023. Balances increased 14.29% from December 22nd to January 15th but have sharply come down below 100 ETH total. This segment is completely sidelined since the middle of February, but it will be important to look for any notable increases in ETH holdings in the future.
What about selling the top?
Traders are much better at selling the top than buying the dip. To recap, there were four historical tops used for the analysis:
- Top 1
- Sold between Aug 7 - Sept 20 2021 above $3,100
- Top 2
- Sold between Oct 29 - Dec 9 2021 Above $4,300
- Top 3
- Sold between Feb 5 - Apr 25 2022 above $3,000
- Top 4
- Sold between Jul 27 - Sep 12 2022 above $1,700
We then looked for traders who were able to sell 50 or more ETH across 3 or more tops. Thus, we are left with traders who have a 75+% hit rate and a minimum of $85,000 in revenue (50 ETH x $1,700), although the revenue is likely much higher given the other price points. We then filtered for wallets that were active at some point in 2022 and were not contracts or MEV bots. Finally, we were left with 844 wallets - our ‘Top Sellers’ who were collectively able to sell a total of 335,557 ETH across the four local tops. 84% of the wallets were able to sell 3/4 tops and the other 16% were able to sell all 4/4 tops.
Let’s take a look at the largest top sellers, sorted by net ETH sold.
ETH Top Sellers Leaderboard
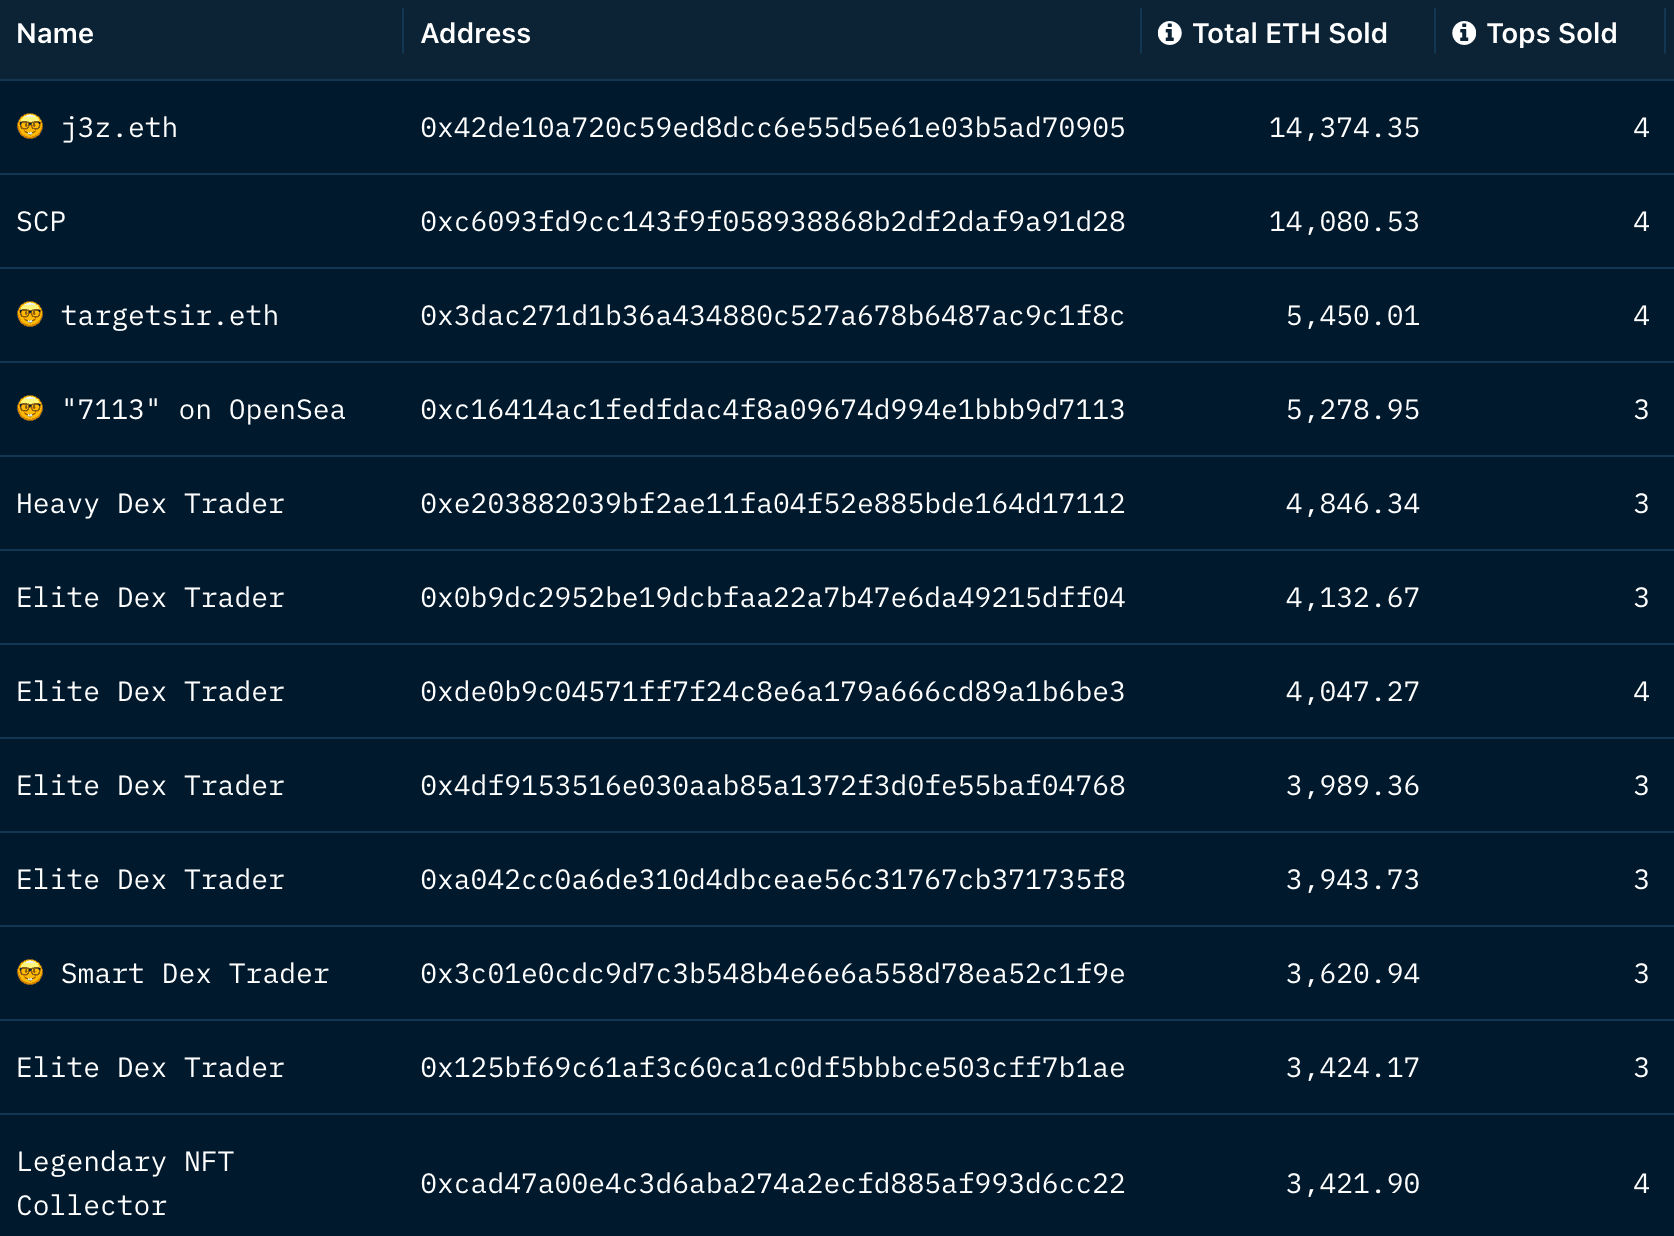
From the above, we can see that a lot of traders had success selling local tops. The leaderboard is of the wallets that sold the most amount of ETH across the tops. 50 wallets were able to sell over 2,000 ETH across the four indicated tops. In other words, they have locked in a minimum of $3.4m of revenue each ($1700 x 2000 ETH) going off of the lowest top measured. The top 50 wallets can be investigated further and track their WETH movements greater than $10k USD using this smart alert.
Given there are many notable top sellers, do their ETH balances have any correlation with ETH price? Specifically, if their net ETH balances go down, does that usually lead to a dip in ETH prices?
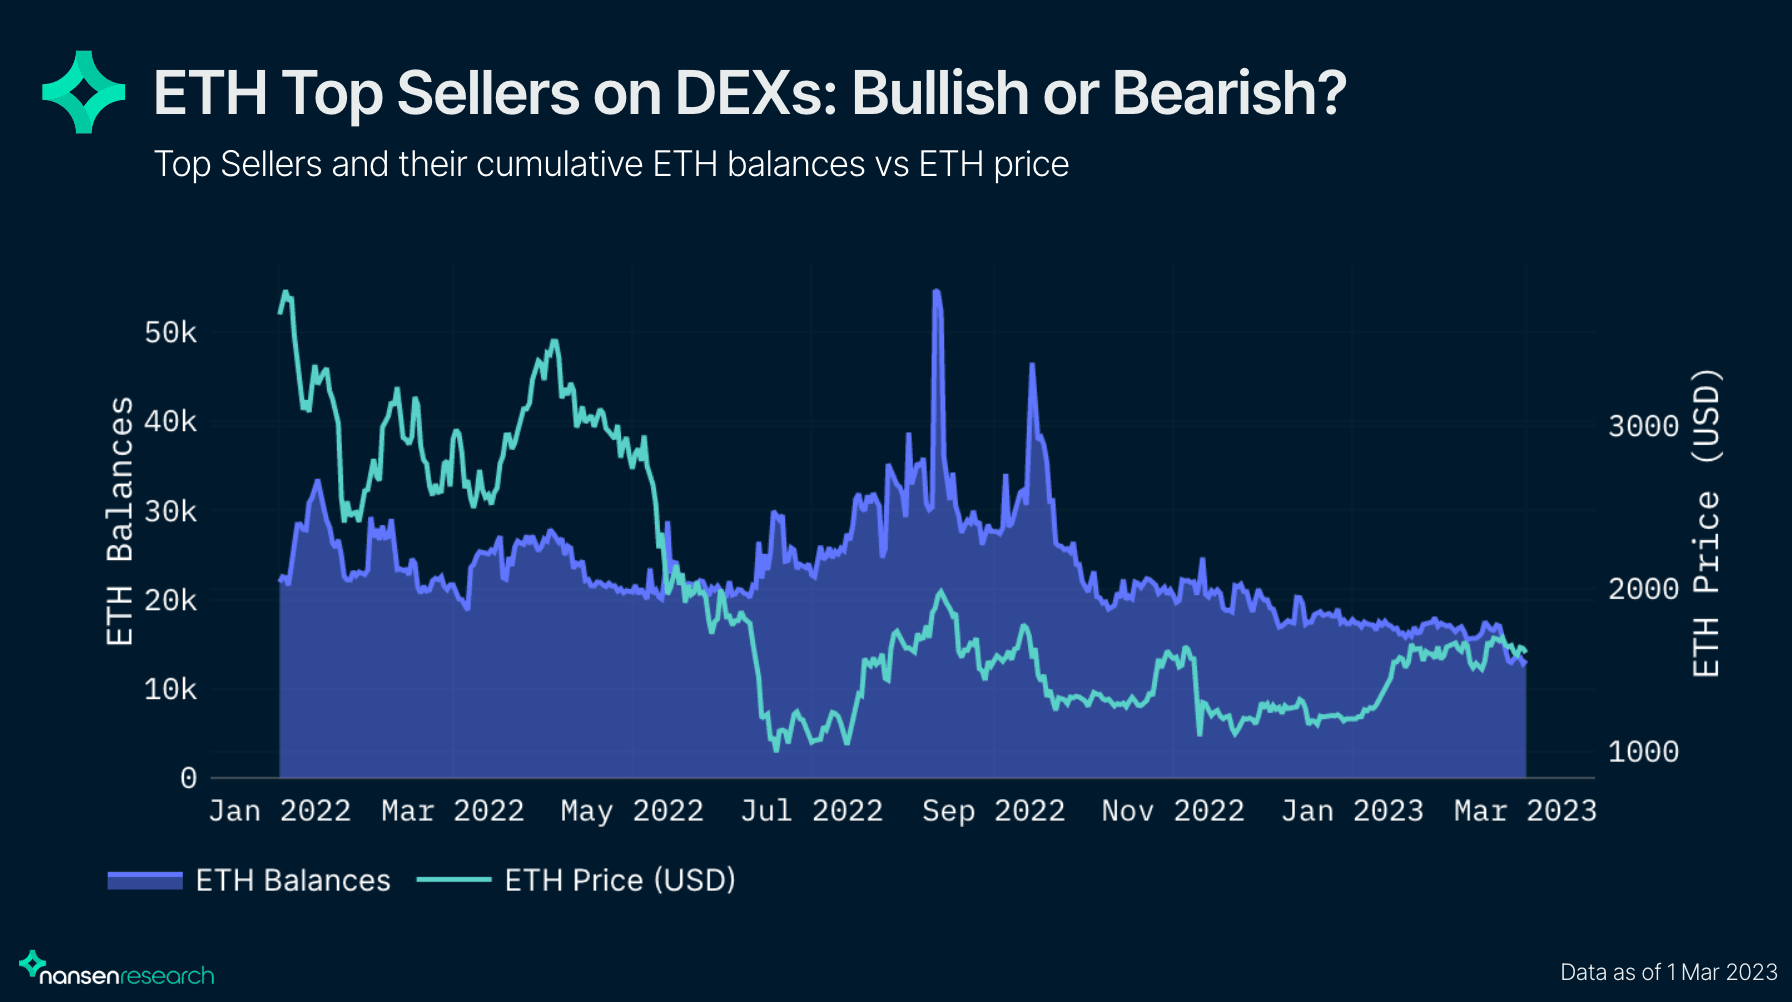
Over the course of 2022, there were a few instances where the top seller segment effectively sold the local peak. For instance, this segment sold off a large amount of its ETH around $3,256 with a major retrace following it. Additionally, the chart shows a few other instances of large selloffs prior to further price drawdowns. Over 2023, this segment has stayed rather sidelined as the price has increased dramatically, signaling they are not actively trading ETH on DEXs. Monitoring any notable decreases in balances may indicate bearish ETH price action.
Part II: Profitable WETH DEX Traders
Here we analyze trader profitability over four timeframes:
- Overall PnL since 2020
- 2022
- 2023
- and the last 30 days.
This approach offers a detailed view of how trader profitability has evolved over time. These different timeframes will surface wallets that have been profitable over short and long time periods.
All-Time Profitable WETH DEX Traders
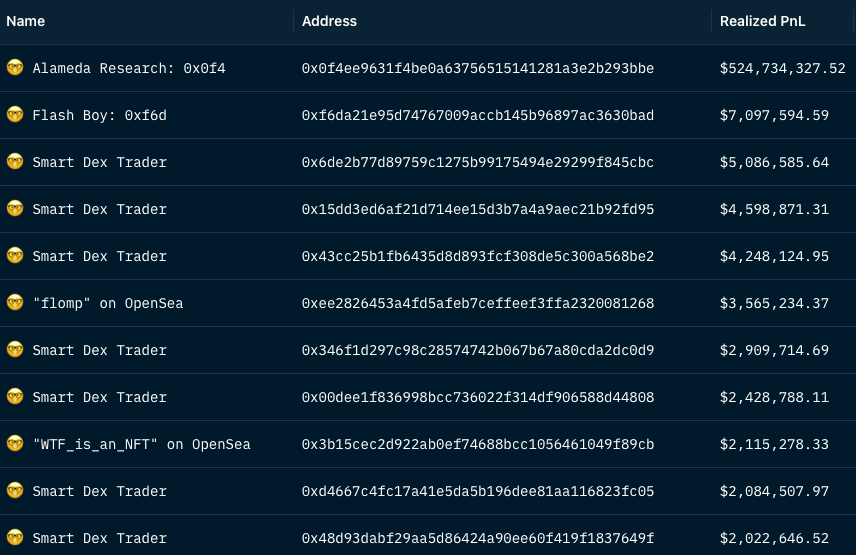
First, we look at the first segment called the ‘All-Time PnL traders’. MEV bots actually made up 7 of the top 10 spots in the leaderboard but we filtered out the bots and MEV wallets to get EOAs and reduce the noise. Below is the leaderboard of the top 10 traders for WETH, with profits ranging from $2.2m to over $500m. Interestingly, the first spot belongs to Alameda in light of their bankruptcy in late 2022. Following, are many Smart Dex Traders who were able to lock in substantial profits.
Top 50 All-Time PnL Traders for WETH
To track the real-time activity of these savvy traders, we expanded the group to include the top 50 PnL traders. You can track their ETH trading behavior using this Smart Alert. Be mindful to adjust the Smart Alert to filter out the noise, the current filters are for a minimum of $10k WETH transactions.
Looking at this profitable segment, what can we gather about their positioning on ETH currently? Looking at just the top 50 traders would give us a concentrated look but what about a wider view of profitable ETH traders since the early days?
The above table only included the top 50 PnL traders, but to get a larger group of traders, we included all EOAs who were able to make $50k or more in profits. These PnL group’s ETH holdings are visualized below.
All-Time Top PnL DEX Traders for WETH
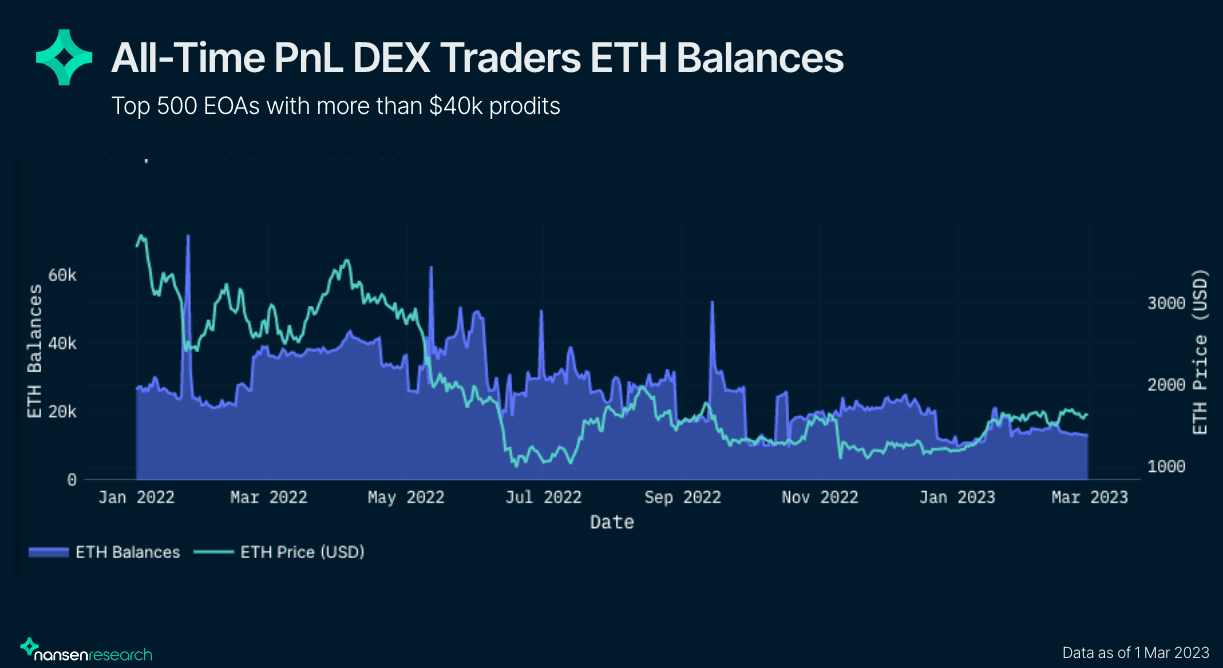
ETH holdings across this segment have been in a downtrend since June 2022. In mid-August, the cumulative ETH balance stood at over 43,433 ETH at $1,944/ ETH whereas on February 8th, 2023, their balances stood barely over 17,500 ETH at $1,570/ETH. With a 50% decrease in holdings and a continued downtrend in both balance and prices, the top PnL DEX wallets do not look keen to hold during the recent volatility. It appears that this downtrend in ETH balances started directly after the Terra collapse in 2022, demonstrating the contagion it had on even the best of traders. Back to the present today, many of these traders look to be sidelined. Monitoring large spikes in ETH holdings for this segment may indicate future risk-on behavior by those who have been quite profitable historically.
Top WETH traders for 2022
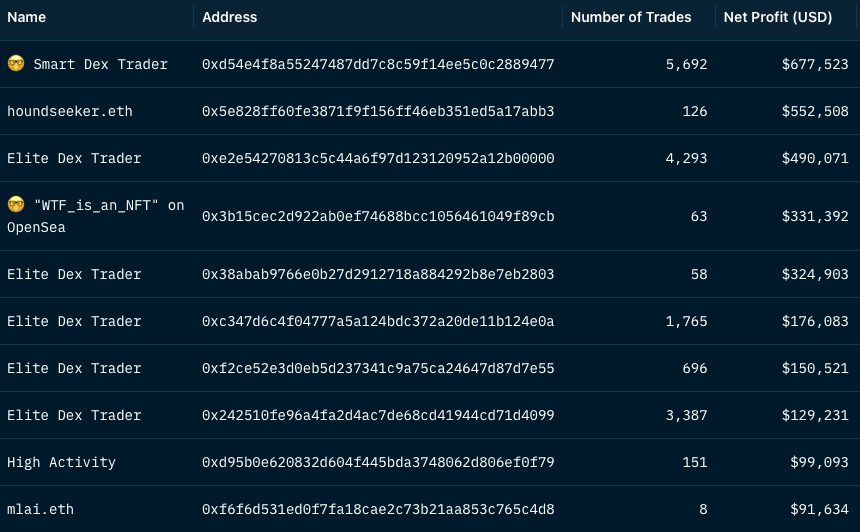
The second group of traders focuses on those who have been profitable in 2022. Given the recent profitability, these wallets might be more active in their trading habits. The original leaderboard was also dominated by MEV bots, with 8 out of the top 10 PnL wallets being MEV having collectively made over $16.4m. After filtering the bots out, we are left with the below table which lists the top PnL traders in 2022, showing the 10 wallet addresses that earned over $211k in profits.
WETH PnL Leaderboard in 2022
To keep track of the top 50 PnL wallets over 2022, you may monitor their WETH transactions greater than $10k USD using this Smart Alert. However, to get a larger group of traders to assess larger trends, we included the top 500 PnL EOAs over this timeframe visualized their ETH balances below.
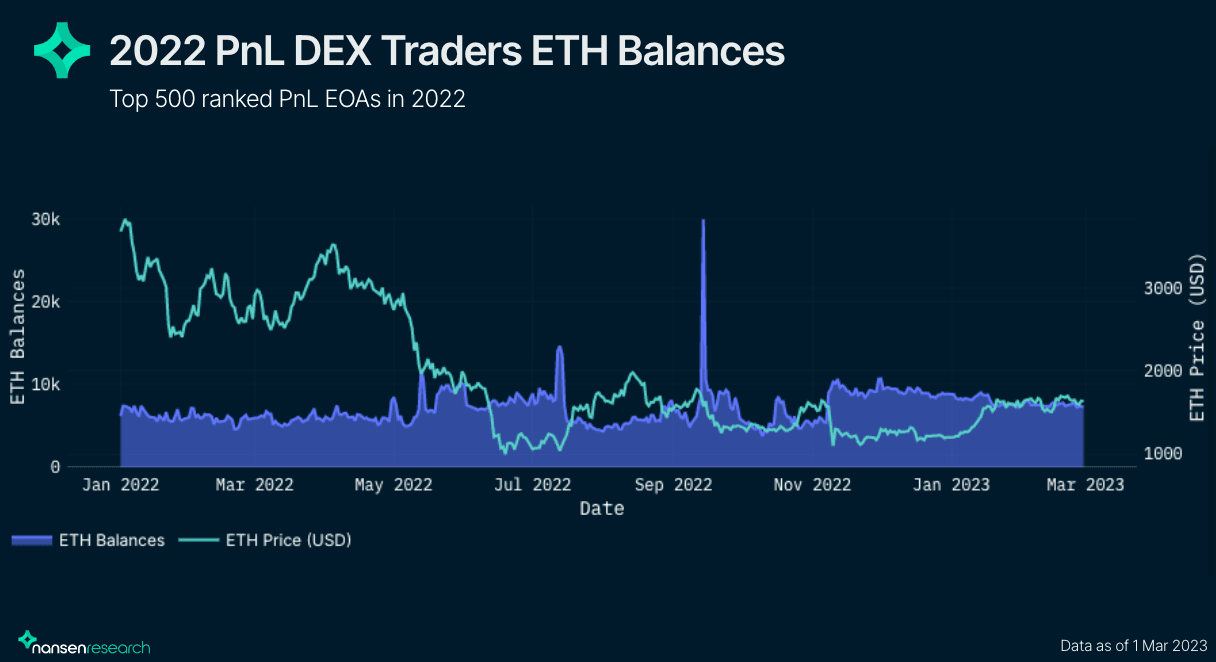
2023 WETH PnL Traders
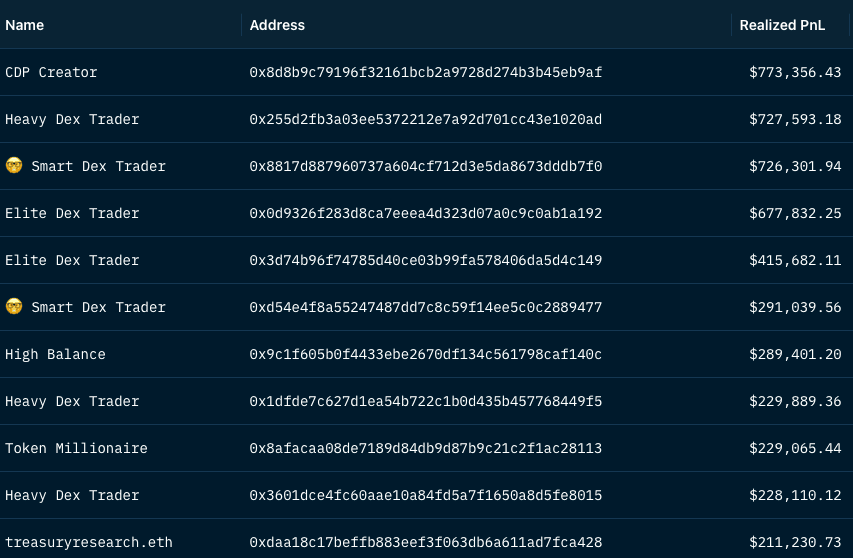
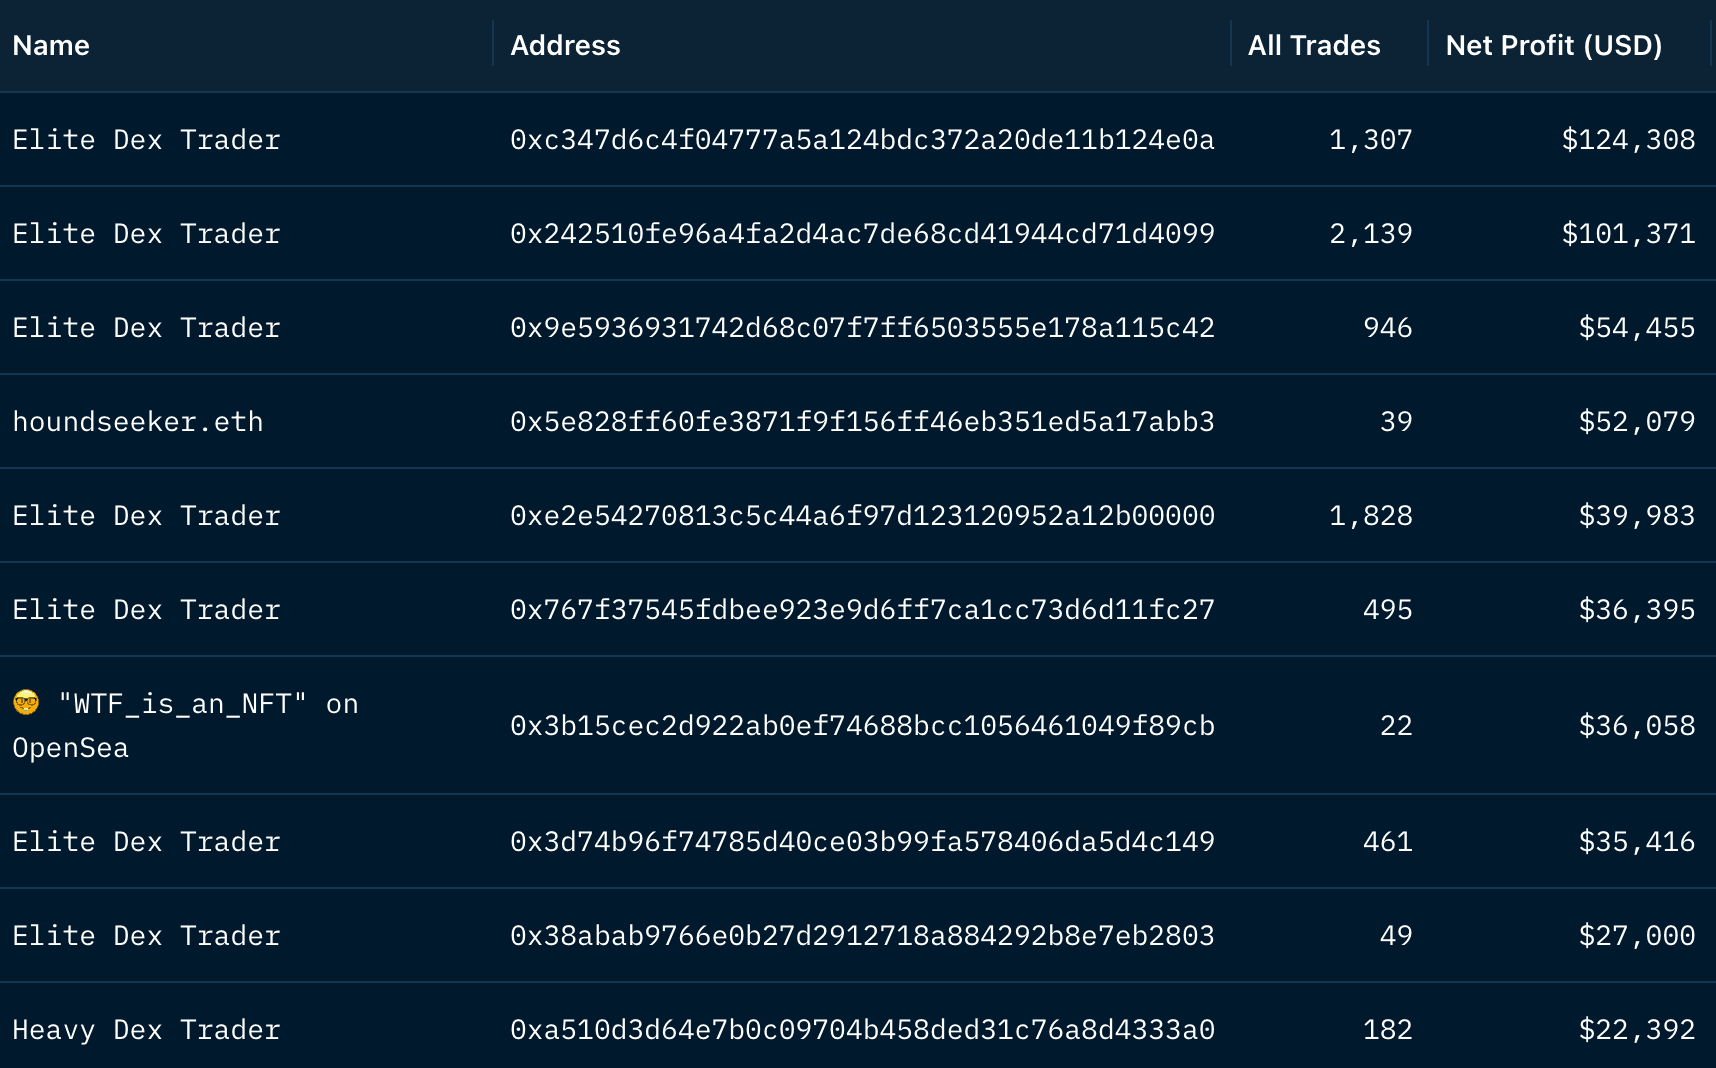
Next, we look at the top PnL traders in 2023. The wallets in the leaderboard are from January and February and have made more than $1,000 trading WETH, and are not MEV bots. This leaves us with 78 wallets that fit these conditions and many of them vary in terms of strategies employed and profit percentage. Below, is the leaderboard for top PnL traders, sorted by net profit (USD).
From the leaderboard, it is clear that many of these wallets are sophisticated traders who enter many trades and net a smaller percentage change in profits. These high-frequency traders tend to place much higher on the leaderboard, signaling that active trading is much more favored than directional trades over 2023. However, there are a few wallets that profited quite well with 50 or fewer trades worth noting. Both houndseeker.eth and 🤓 "WTF_is_an_NFT" on OpenSea were able to secure $552,508 and $331,392 in net profits over 2023. Interestingly enough, 🤓 "WTF_is_an_NFT" on OpenSea ranked ninth in PnL over since 2020 as well, netting over $2m and appeared on the Dip Buyer leaderboard. 🤓 "WTF_is_an_NFT" on OpenSea is a very active wallet who has proven to be both profitable and timely over multiple timeframes.
Looking at a more granular view, are these profitable wallets accumulating ETH currently? The 2023 Top PnL trading segment’s ETH balances are visualized below against the ETH price.
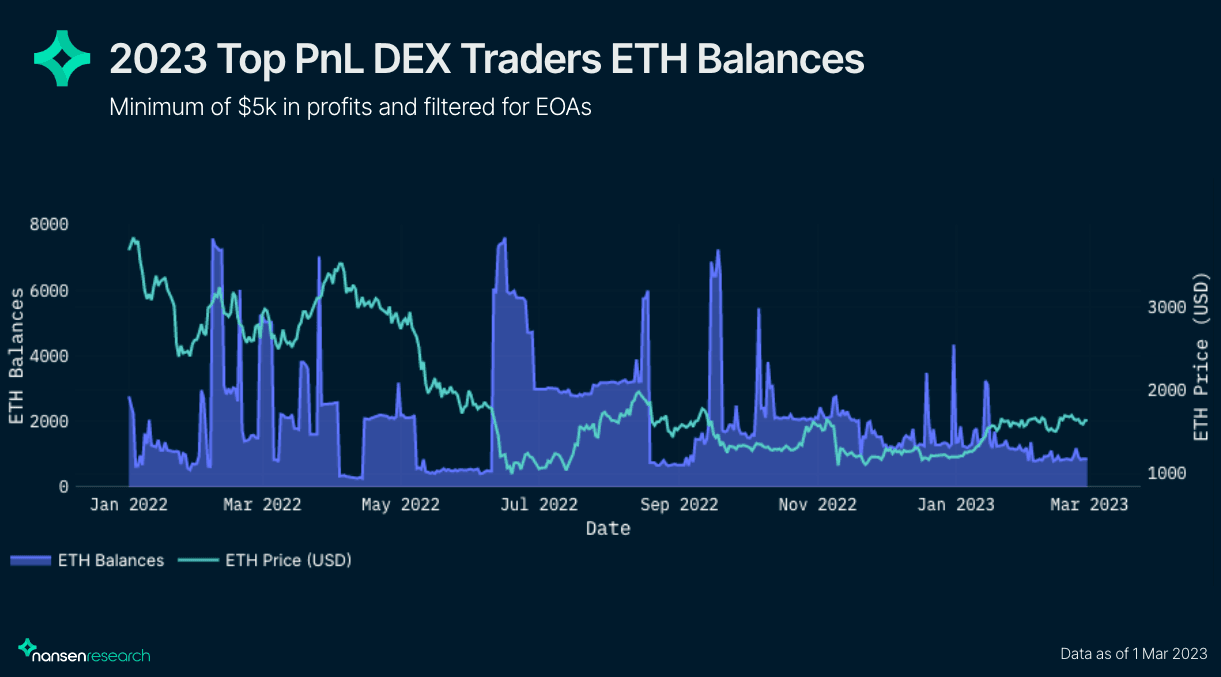
Focusing on 2023, it is clear there is no accumulation of ETH across this trading segment. Rather, the chart shows quick spikes in ETH balances but no overall trend in increased balances, indicating this segment is frequently trading and not spot-long for the long term.
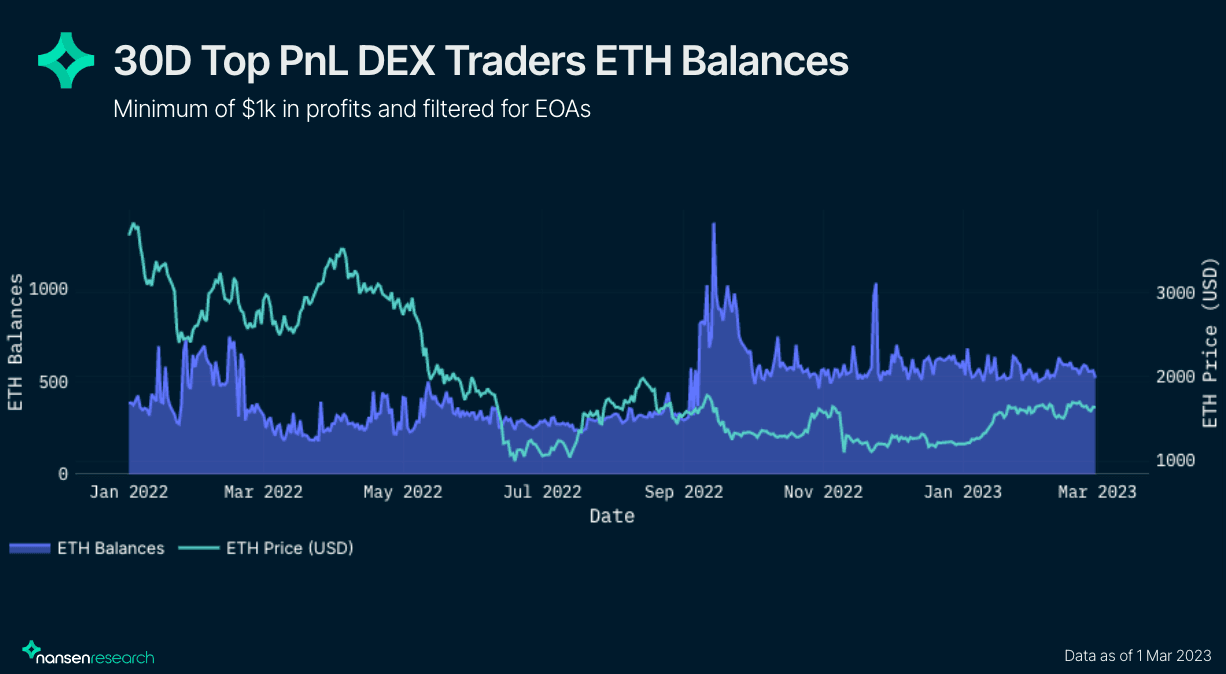
30D WETH PnL Traders
Finally, we look at the top PnL traders over the last 30 days. The wallets in the leaderboard range from high frequency traders with thousands of trades to low frequency traders with a few dozen trades. Below, is the leaderboard for top 10 PnL traders, sorted by net profit (USD).
30D WETH PnL Leaderboard
Based on the below chart, it is clear there is no accumulation of ETH across this trading segment in 2023. However, this segment saw a large increase in ETH balances over September 2022 and has relatively maintained them since.
There are a clear set of winners that can be found on-chain and tracked using Smart Alerts. It is clear traders are more effective at selling local tops than they are at buying local dips. Both volumes and the distribution of wallets were much larger for top sellers than it was for dip buyers. However, both of these segments have not seen any large increase or decrease in ETH holdings over the course of 2023, indicating that they are sidelined.
The PnL segments are just a glimpse into a trader’s success. Tracking PnL over different timeframes can assist users by following those who are highly profitable on-chain, specifically when you can drill down on active EOAs. Contrary to the timely traders, the all-time PnL segment saw an 18.7% increase in ETH holdings YTD, while the 2022-2023 trading segment stayed stagnant. The top PnL traders in 2023 are currently engaging in active trading of ETH, without showing any clear indications of whether they are directionally short or long.
Overall, most of these trading segments are relatively neutral in their ETH positions since the start of 2023. Given it's only Q1 of 2023, it is still very early and it will be important to see if there are any large increases or decreases in ETH balances over the course of the year.