
Introduction
Ethereum has long underperformed against BTC, so many people have given up or fully "embraced the hopium," looking for every detail that might showcase a turnaround for $ETH. Recent circulating images from ZeroHedge showcasing hedge funds taking significant short positions further added sand to a fire that was already on its last leg. As the post explains, this is not much of a worry despite many interpreting the numbers negatively, as hedge funds were capturing the basis difference with $ETH spot bets.
With that said, let's take a look at Ethereum derivatives from Deribit for the past week, month, and year to see if we can find any hope for the price of $ETH.
NOTE: For the following article we assume that block trades are all institutions in order to simplify assumptions between retail and institutional players.
Options Market Overview
Below are the current values for ETH options as of February 25th 12:00 PM UTC
- Put/Call Ratio (i.e., the ratio of the open interests of puts divided by open interests of calls): 0.46 – reinforcing a call-side bias.
- Total Open Interest: 1,860,554 contracts
- Calls: 1,278,449
- Puts: 582,105
- Key Strike Concentration:
- Calls: $2,700 - $3,100
- Puts: $2,200 - $2,500
- Current Spot Price: $2,395.66 (February
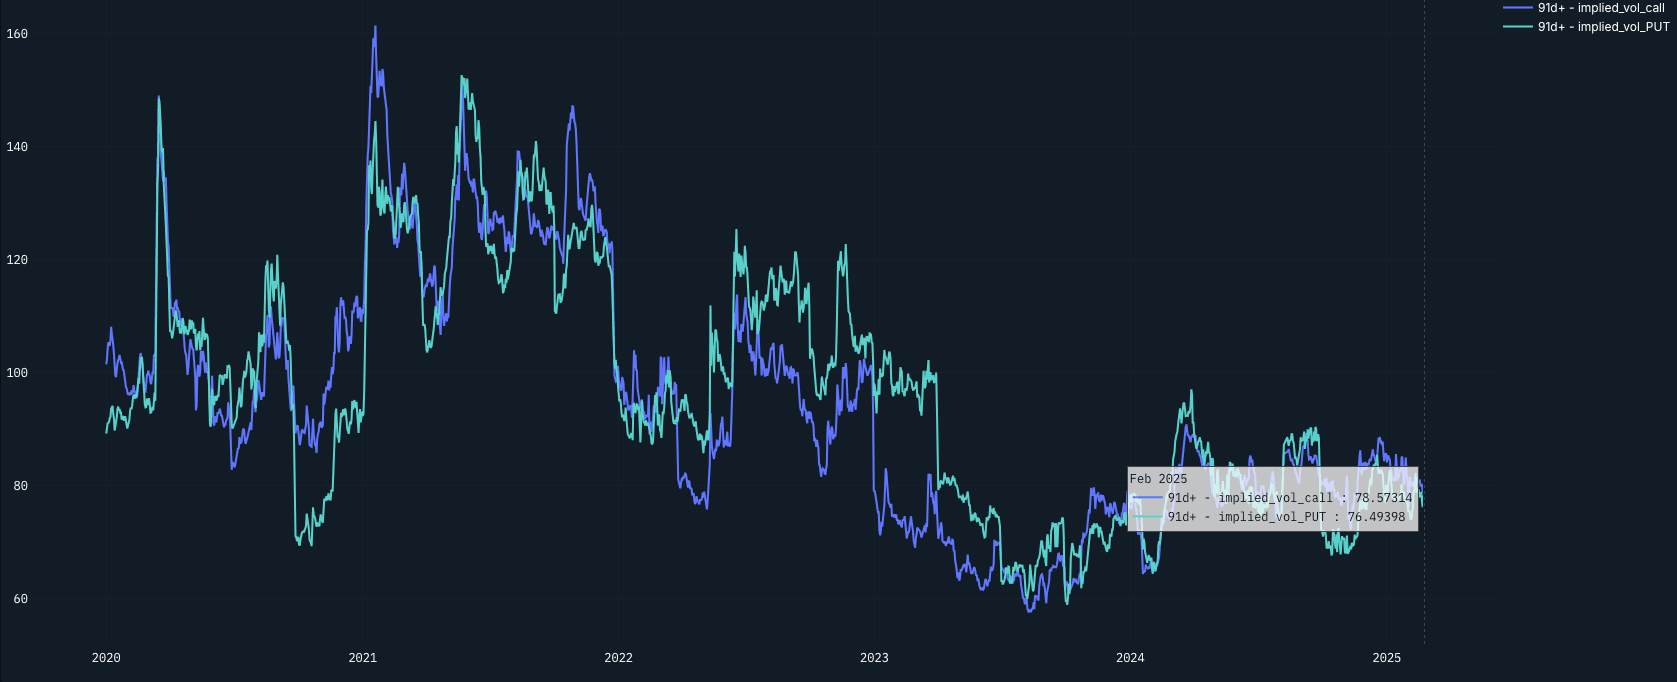
- 90-Day Implied Volatility:
- Calls: 78.57
- Puts: 76.49
- IV Skew: Slightly call-favored (+2.08 points)
The 90-day implied volatility data show current IV levels (calls at 78.57, puts at 76.49) are much lower than in past years. The chart below shows that from 2020-2022, these levels were typically between 120-140 during “regular” market regimes and went above 160 during market stress. We observe a seemingly “break lower” in implied vol from 2023 on.
With a 90-day lookback, as of February 25th, realized volatility is at 54.09%, while implied volatility sits around 65%, leaving a difference of approximately 11 percentage points. For comparison, at the end of August 2022, realized volatility was much higher at 90.5%, with implied volatility reaching 112%, creating a wider delta of 21.5 percentage points. The narrower spread and lower overall implied and realized volatility suggest that the market is anticipating smaller price swings than before, with expectations becoming more aligned.
The small call skew in implied vol (+2.08 points) is unusual, given ETH's current price. Normally, when the price sits near put strikes like it does now ($2,395 near the $2,400-2,500 put concentration), we'd expect puts to be more expensive than calls.
The current IV levels suggest traders aren't expecting much price movement, which might be a mistake given ETH's tricky position near key option strikes and the current market conditions. However, we may also just be seeing this due to less interest in spot ETH.
Institutional Flow & Volatility Insights
Looking at the combo trades breakdown, institutions (block trades) appear to be using different strategies than retail traders:
- Strangles (27.1%) are much higher than retail traders (1.6%). This shows that institutions expect price movement but aren't sure about the exact timing or direction.
- Put spreads (13.9%) vs. Call spreads (10.1%)
- Slightly bearish tilt, but with a capped downside.
- Calendar spreads
- Both call (7.6%) and put (3.2%) calendars suggest institutions are focused on timing rather than just direction.
- Risk Reversals (9.5%)
- Barely used in retail traders (0.1%). Shows institutions using option combos to express views more efficiently. Based on Deribit data, the risk reversals are lately net long.
The difference between institutional and retail positioning is clear: institutions use spreads and combos that work in different market scenarios, while retail seems more focused on simple directional bets. More importantly, the significant interest in strangles showcases how unsure the market is regarding direction.
Futures Analysis
- Contango: Moderate, with reduced premium reflecting current market uncertainty
- Futures Premium: Compressed at current levels
- Funding Rates: Slightly negative (~-0.004%)
- Open Interest: Remains elevated across quarterly expirations
With the ETH spot at $2,395.66, the future structure shows signs of “bearishness”, with the contango narrowing continuously since 2024 and funding rates turning slightly negative. This indicates potential near-term bearish pressure, though the modest negative funding suggests orderly positioning rather than panic. Generally speaking, the downtrend in ETH spot prices has led to a slow and steady decrease in contango, which is now low.
Key Levels
- $2,400-2,500 Range: Across multiple expirations (01 Mar, 07 Mar, 14 Mar, 28 Mar), consistently high put open interest at the $2,200-2,300 strikes and call concentration at $2,600-3,000. With ETH trading at $2,395.66, the current price sits between these two major zones, creating a battleground. Notably, the max pain price varies by expiry ($2,475 for 01 Mar, $2,700 for 07 Mar, $2,650 for 14 Mar, and $2,800 for 28 Mar) with the futures trading at $2,440.02. This creates a critical battleground between put sellers and call buyers.
- OTM Options Pricing (28 Mar 2025 expiry): Far OTM (out-of-the-money) calls (above $3,000) are trading at 70-85% IV, while far OTM puts (below $2,000) are priced at 75-90% IV. This modest put skew in wings suggests the market is pricing slightly more tail risk to the downside despite the overall call-heavy positioning.
- Cost of Protection (28 Mar 2025 expiry): $2,000 puts (roughly 20% OTM) cost about 0.0158 ETH (~$38), representing approximately 1.6% of underlying value for quarterly protection. This relatively inexpensive downside protection reflects the low volatility environment, which could be a potential hedging opportunity.
- Max Pain Price Levels: Trending toward $2,800, creating potential upward pressure as expiration approaches
Conclusion
While the ETH option market remains positioned with a bullish bias overall (0.46 put/call ratio in terms of relative open interests), the February 25th price at $2,395.66 creates a more complex picture. The significant call-side positioning now looks increasingly at risk, given price proximity to key put strikes.
The $2,500 level has transformed from potential support to immediate resistance, with dealer hedging likely to create selling pressure near this level. The disconnect between relatively sanguine positioning and current price reality suggests the potential for further volatility, particularly if support at $2,200-$2,300 comes under pressure, which has been the case as of February 27th.
Particularly noteworthy is the DVOL level at 68.32, which remains relatively subdued compared to pre-2024 historical volatility regimes. This suggests potential complacency in the options market despite the precarious price positioning. In 2021-2022, we saw DVOL regularly trading above 100, with spikes to 160-200 during the market drawdowns. The current moderate volatility pricing indicates potential opportunity for volatility strategies, especially considering the disconnect between market positioning and price action, e.g. the relatively cheap OTM put pricing at 1.6% by March 2025.
Institutions (based on block trades) appear better positioned for this weakness than retail traders, explaining the significant put protection at precisely the levels now relevant to current price action. Given the relative lack of put protection until the $2,200 strike, traders should watch for potential acceleration if ETH breaks decisively below current levels.