
Three scenarios
The rally in crypto and risk assets has persisted, with BTC crossing above 23k and the S&P 500 having broken its downward trend (see chart below). With so far strong employment data and a lower-than-expected US PCE, the scenario of “goldilocks” has been scoring some points.
We present three possible macro scenarios from here, their respective implications for crypto markets, and considering what is “priced in” vs these scenarios’ probabilities.

Scenario 1: Goldilocks or lower inflation and resilient growth (it is the current backdrop) continues for longer and the Fed gets its desired “soft landing”. Positive crypto.
In this configuration, inflation continues to come in below market expectations, and, as a consequence, the consumer slowly recovers its purchasing power.
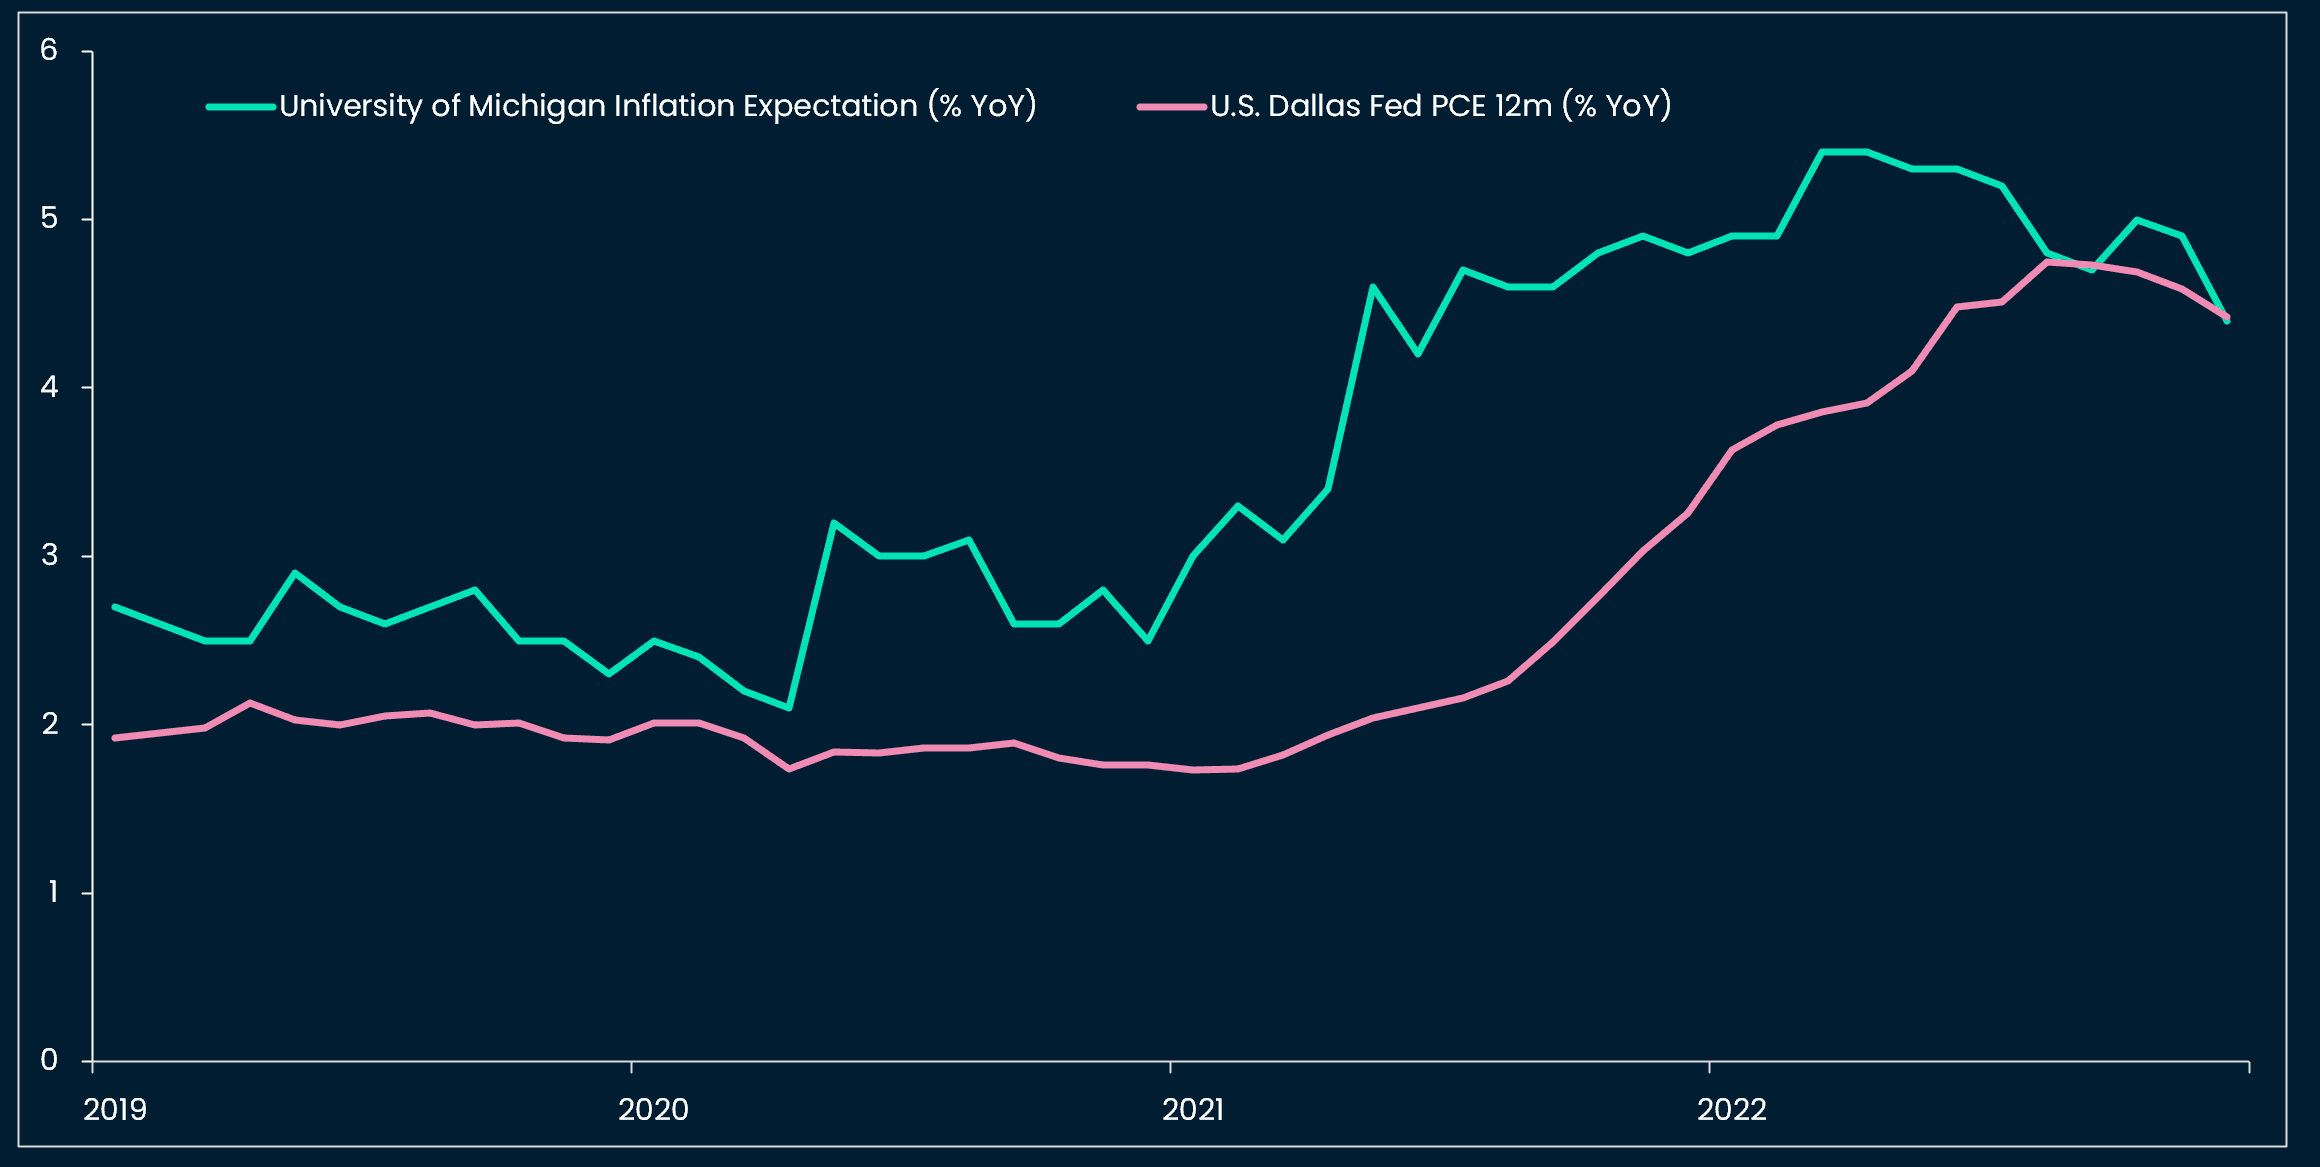
Argument 1: More disinflation to come
Inflation has been surprising to the downside for a few months, and inflation expectations are falling (see chart below). Additionally, the rent component of the US CPI basket is lagging and is likely to reflect the slow down in the housing market from Q2 on this year.
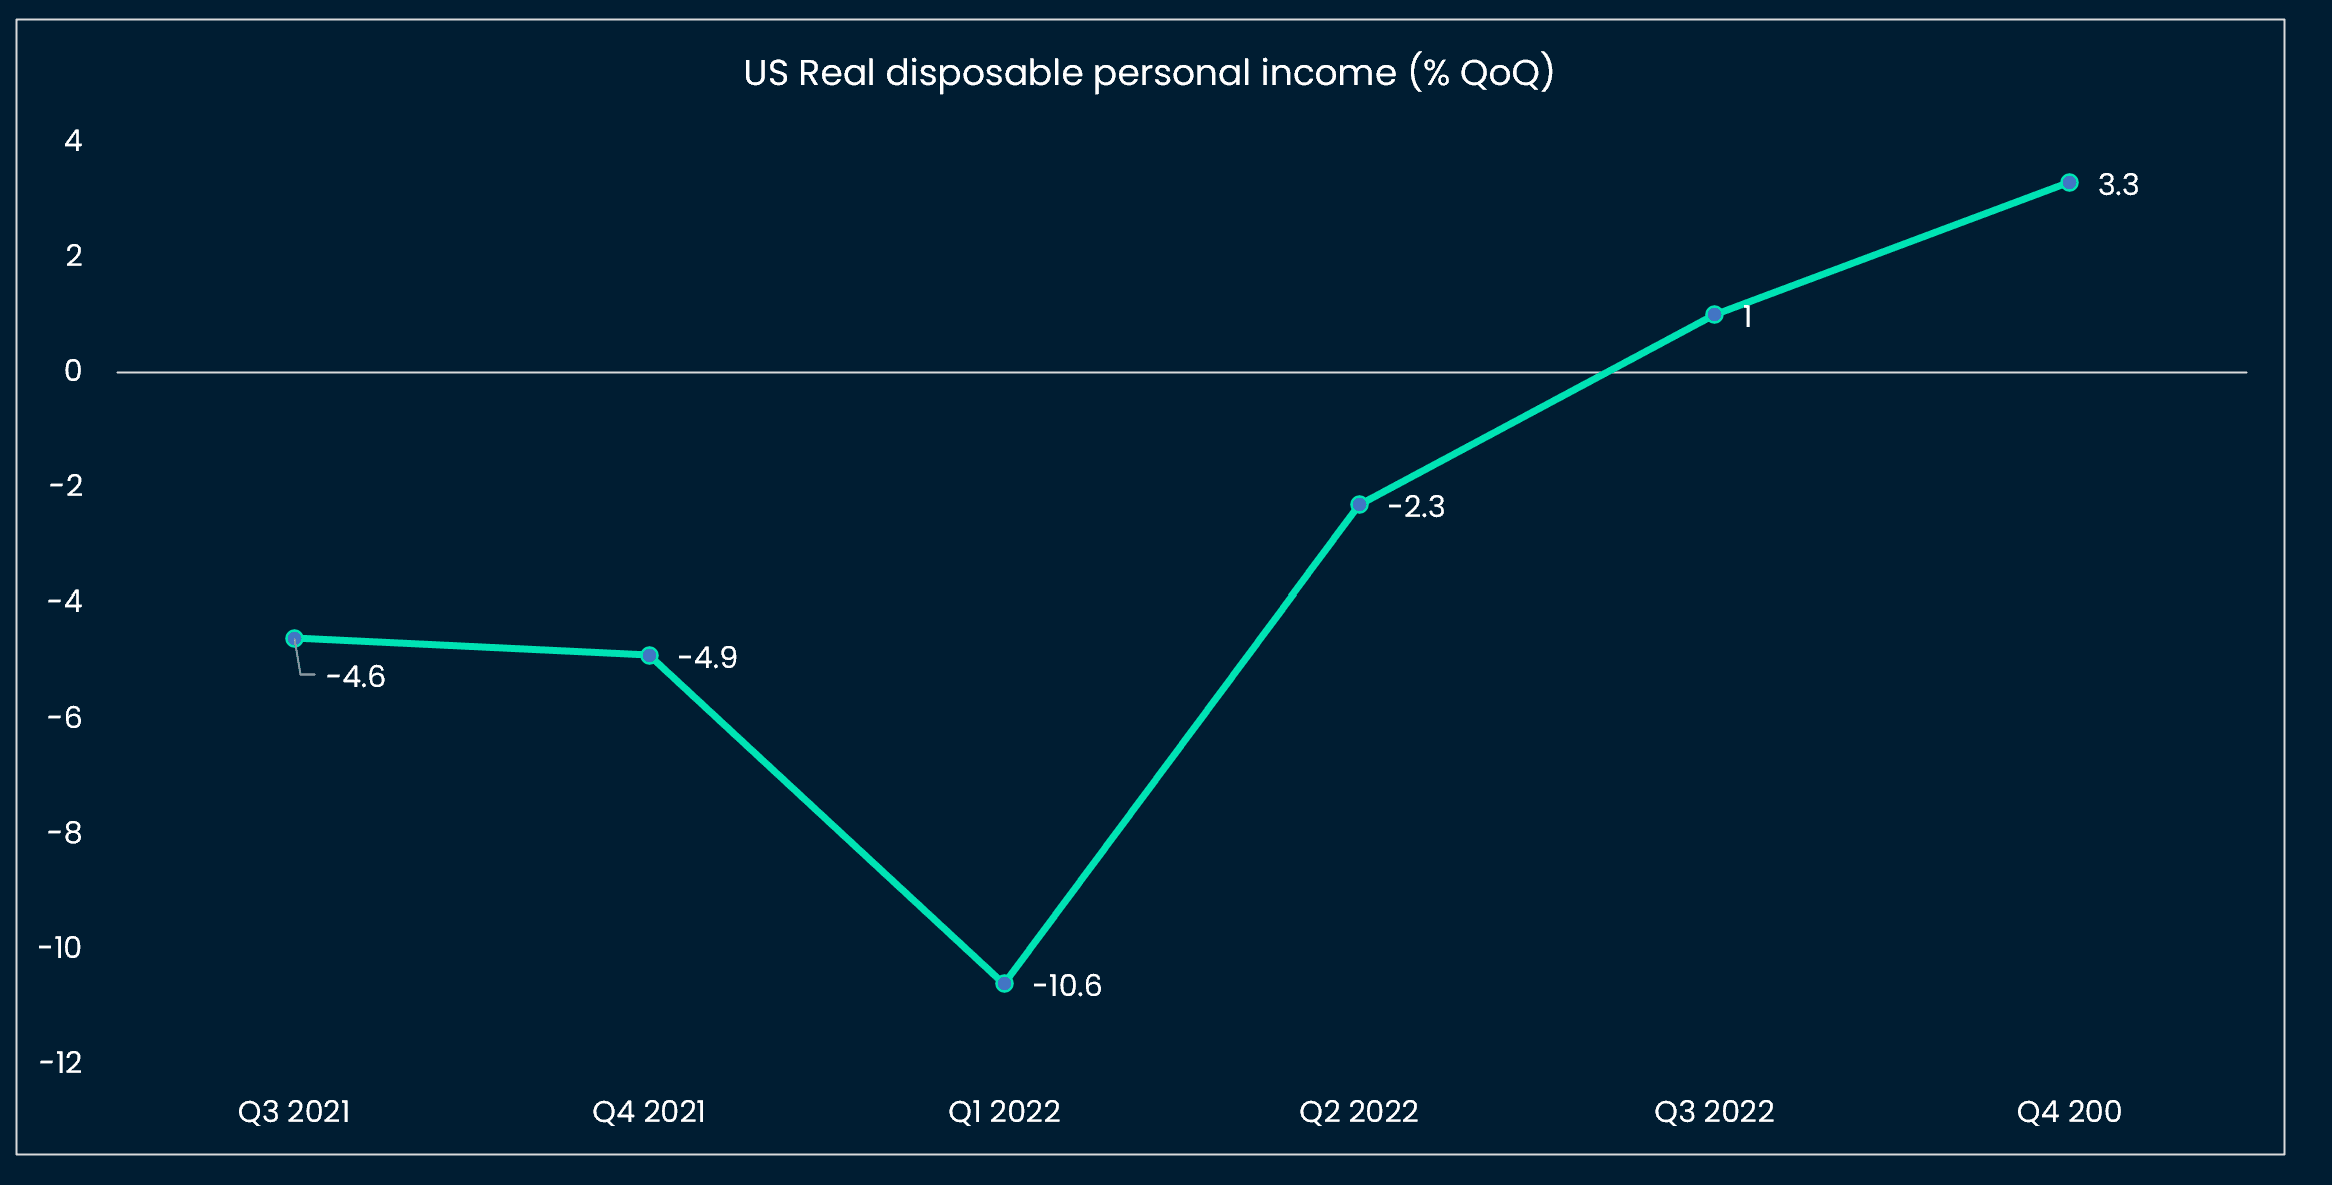
Argument 2: US disposable income is increasing
This has so far been the case in Q4 2022. US personal income statistics from the BEA show that still elevated wage growth (USD +163.9bn compensation last Q4) combined with a jump in government social benefits in Q4 (+90.2bn) bolstered US personal income. The consumer also adjusted its spending down especially on durable goods: current-dollar spending on goods decreased 95bn in December, led by gasoline and motor vehicle parts. Spending on services increased by 53.4bn but did not offset the decrease in good spending. As a result, disposable personal income increased for the third quarter in a row (see chart below).
Argument 3: Global businesses are turning more upbeat, partly driven by lower inflation (Europe / Germany) and the re-opening of China (global)
China is re-opening, and the local authorities are prioritizing growth over deleveraging for the time being (see our prior newsletters). Emerging markets have also survived a world of higher global rates and the US dollar’s appreciation. China reopening is positive for EM and global cyclical companies (Caterpillar reached an all-time high recently).
US and European PMI surveys also reflect a more upbeat tone (US Manufacturing PMI 46.8 vs 46.0 consensus, and Services 46.6 vs 45.0) even if most business sentiment gauges still point towards a contraction of business activity, the contraction is lessening. The UK PMI survey summarizes it best: “Though the country still teeters on the precipice of a recession, [...] optimism amongst private sector firms was the best for eight months signaling the downturn may not be as long and protracted as feared.”
Scenario 2: Growth- or growth-contagious market shock. Negative crypto first (then positive if Fed pivots to defend growth).
In this scenario, a growth or market shock would be negative for risk assets.
Argument 1: Layoffs are picking up, hard data are just lagging
Of the US companies that reported earnings last week, a growing share announced cost cutting and job reduction plans: we noted Intel, IBM, Microsoft, H&M, Dow, GE, Morgan Stanley. Those announcements seem to be concentrated in the Tech sector (see chart below) but are now spreading to the Financial and Industrial sectors as well. US initial jobless claims and initial jobless claims remain at all-time lows for now and need to be monitored.

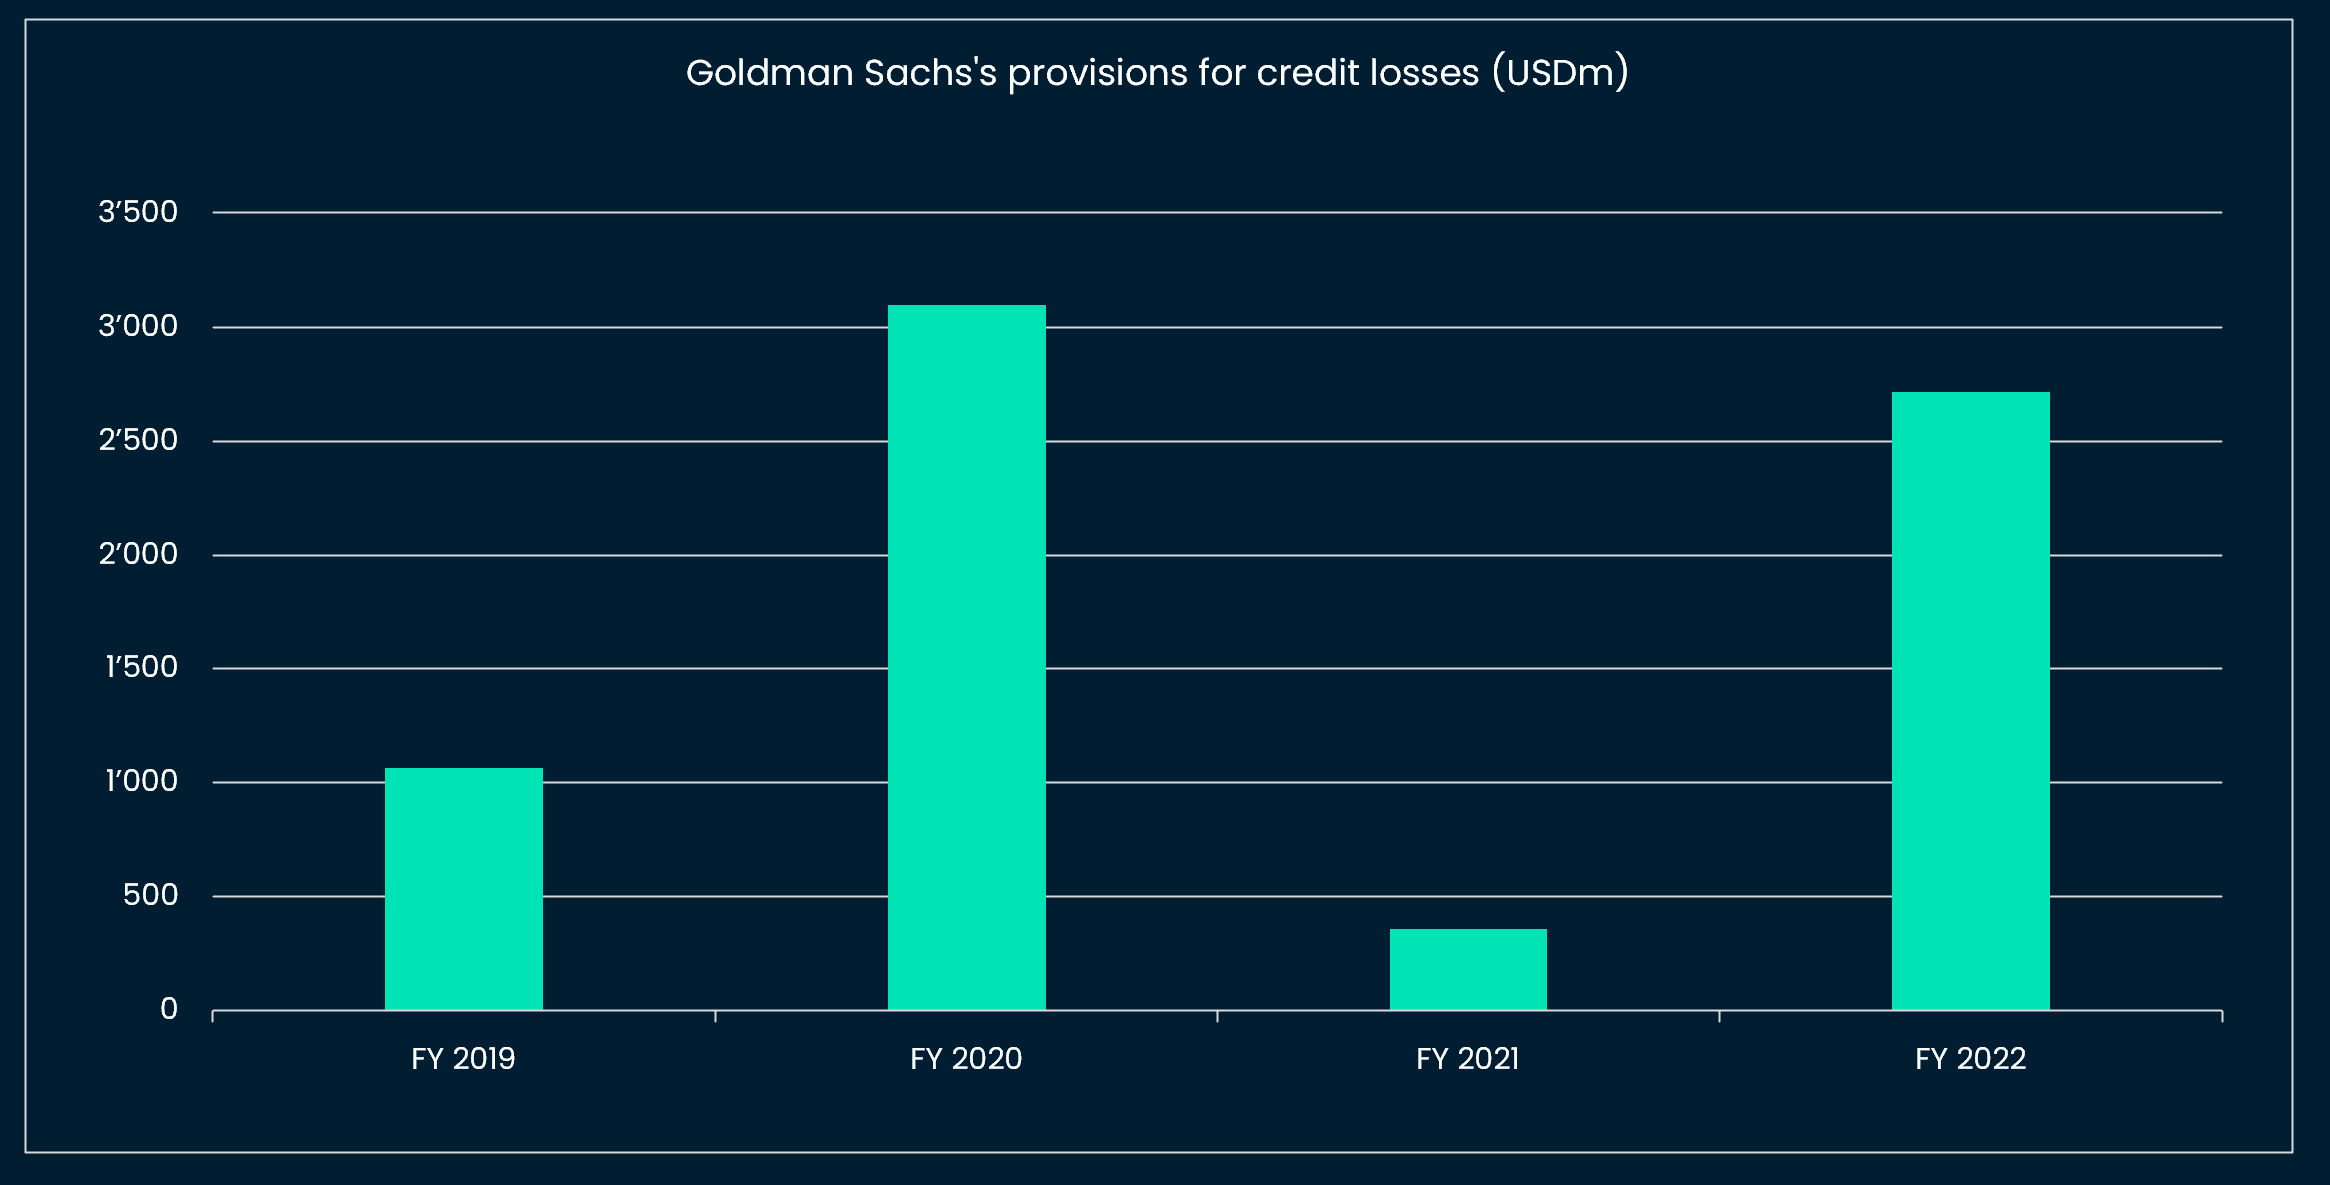
Argument 2: The consumer is not in such good health and credit card debt is rising
Even if the US consumer’s saving rate has crept up in December, to 3.4%, it remains close to historically low levels. As a result, US banks have been flagging a sharp increase in credit card debt: the levels were very low post-2020 as social contributions gave consumer cash reserves, but are now normalizing. All the major US banks have significantly increased their provision for credit loss, with the latest, Goldman Sachs indicating a level of provisions comparable to 2020 (see chart below).
Argument 3: The yield curve inversion has systematically preceded recessions
The US yield curve first inverted in April 2022. Since the 1970s, this has been a reliable leading indicator of recessions. The lead time has historically varied from a few weeks to 22 months, which would bring us for this cycle to a likely recession by February 2024, if history rhymes.
Scenario 3: Resilient growth will allow higher than expected residual inflation and lead to a re-pricing of interest rate expectations up. Negative crypto.
In that last scenario, markets adjust the pricing of Fed interest rates higher (so far 2 hikes are expected by future investors, this week and in March 2023, followed by a cut in December 2023) as a result of high residual inflation.
Argument 1: Wage growth is decelerating but remains way above the Fed’s “soft target”
US wage growth still hovers around 5.0% YoY (12m trailing time frame) and, even if we annualize the last 3 months, wage growth has settled at 4% YoY, still way above Fed Chair Powell’s “soft target” of 3% YoY. There is also anecdotal evidence that employees hold stronger negotiating power than in the past years: Walmart has recently hiked its minimum wage by 17% and American Airlines flagged that regional pilot shortages would probably last “several years”.
What is more, US job postings on Indeed increased 1.9% between November 30 and January 21, which would hint that JOLTS job openings could surprise consensus to the upside this week. The Fed is also likely to incorporate that latest data in their decision making.
Argument 2: Expectations have shifted to low inflation for longer and uncertainty is still high, notably around geopolitics
Markets now expect an impeccable desinflation that leads the Fed to cut rates as soon as December 2023.
Energy prices have been well behaved so far but there is anecdotal evidence that input cost pressures have picked up in January (US flash PMIs). In some countries (Australia), inflation also continues to surprise largely to the upside. Finally, geopolitical uncertainty remains high, even with Europe almost through winter: the Ukrainian conflict is not yet resolved and seems to have indirectly re-ignited conflicts in the Middle East (see recent attacks on Iran claimed by Israel).
What is priced in?
Economists and investors have been in the camp of Scenario 2 (imminent recession) for most of 2022, and right now, the narrative is shifting to “goldilocks” (Scenario 1) as risk assets rally, and prices lead narratives.
Central banks (ex ECB and BoJ which have come late to policy normalization) are becoming less hawkish even with inflation not back to their respective targets yet. The Bank of Canada last week announced that it would pause “while we assess the impact of the cumulative 425bp increase in our policy rate”.
Our take
Our own interpretation of these fast moving macro and market variables is that we could station in Scenario 1 “Goldilocks” for a couple of more months (see the latest Jeremy Grantham’s note that flags the “Presidential cycle” of fiscal spending that could boost risk assets till April this year).
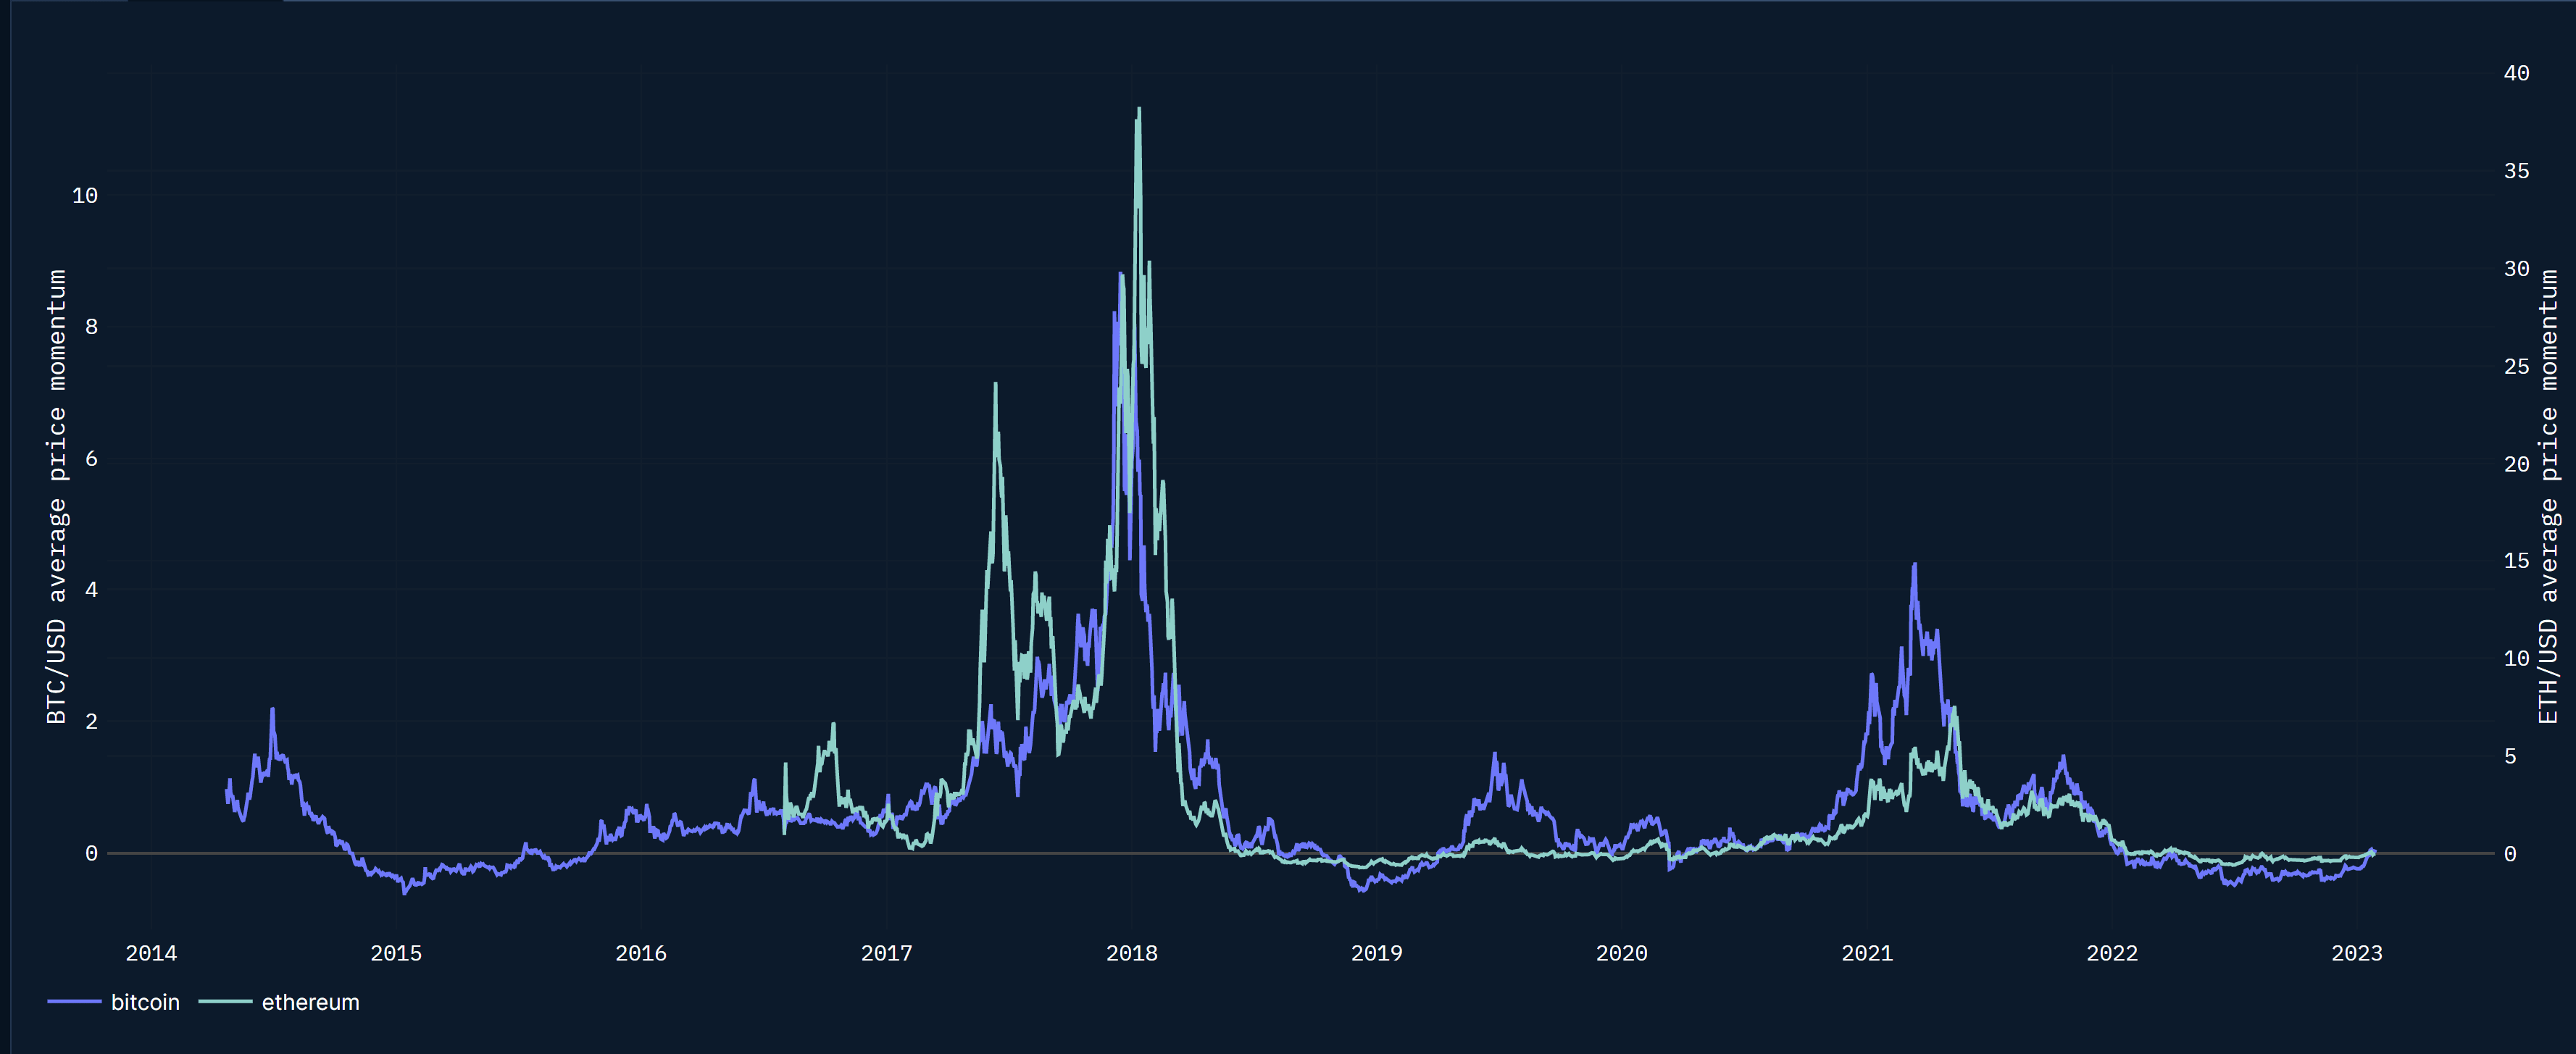
This would translate into more ammunition for crypto in the short-term especially as price momentum has turned positive from deeply negative (occurred two times before in April 2019 and April 2020, see chart below) and investors are yielding to FOMO.
Our equity risk premium plunged further and is now en-route to its 50th percentile, effectively pricing out any growth shock. On-chain, stable coin allocation remains high and is slowly decreasing among Smart Money wallets which also tells us that crypto investors are turning increasingly less bearish, but are still far from euphoria levels (see charts below).


Ultimately, we could transition to Scenario 3, with market participants realizing that the labor market is tight, wage growth is sticky and the interest rate trajectory should be revised higher for longer (e.g. maybe one more 25bps rate hike than currently priced in and no rate cut in 2023 even if growth slows further) and then Scenario 2 (market / growth shock as a result of this repricing). We will keep an open mind and revise this scenario calibration with ongoing new data.
What is happening on-chain?
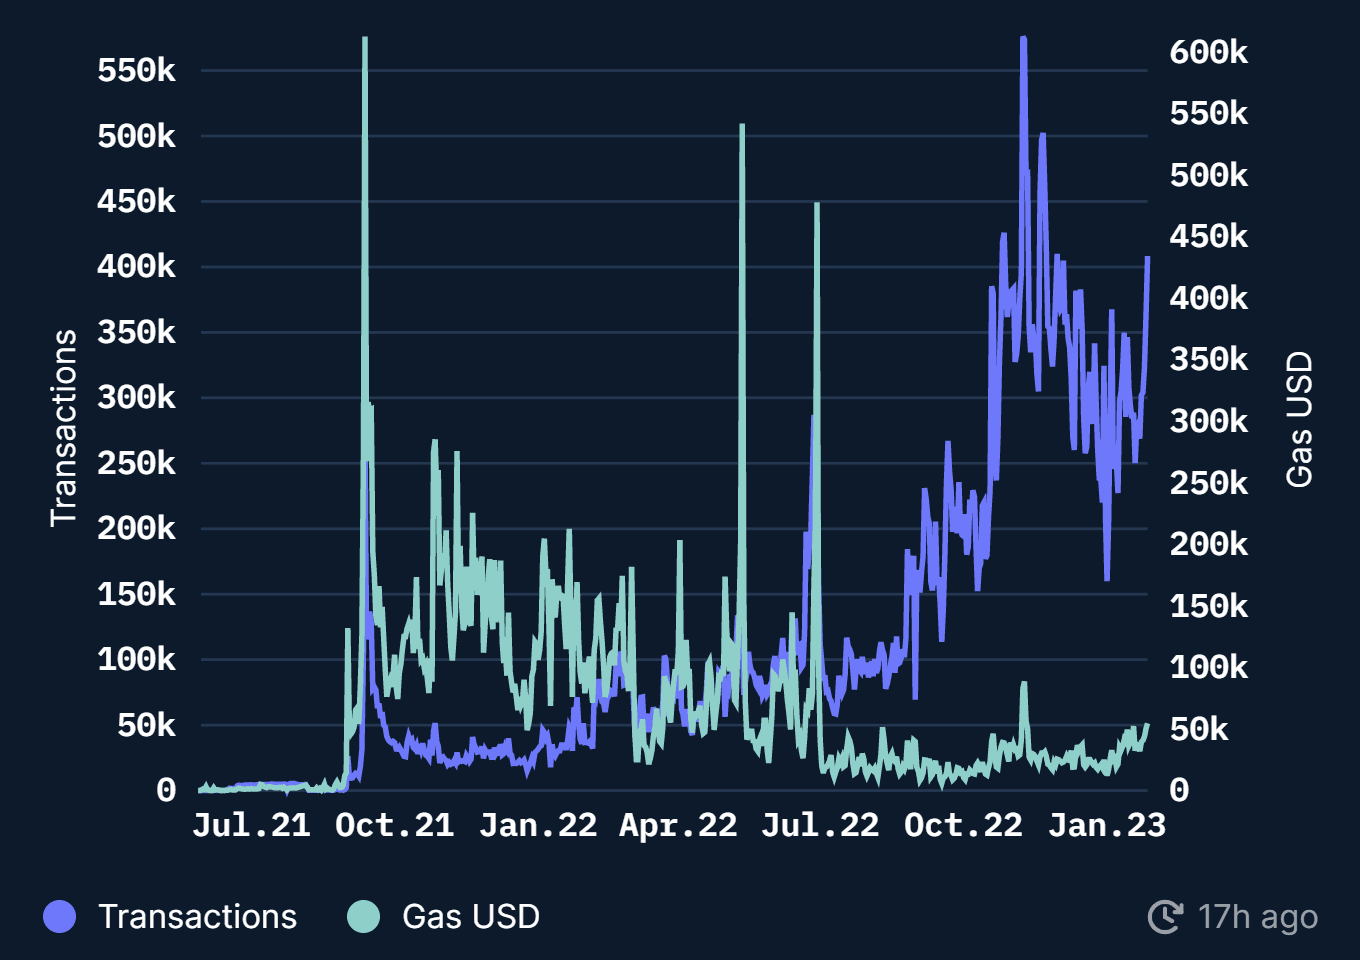
The theme we have been flagging since a few weeks has persisted, namely the domination of activity on L2s over Ethereum. This week we highlight the surge in activity on Arbitrum, following Optimism and Polygon in the past weeks.
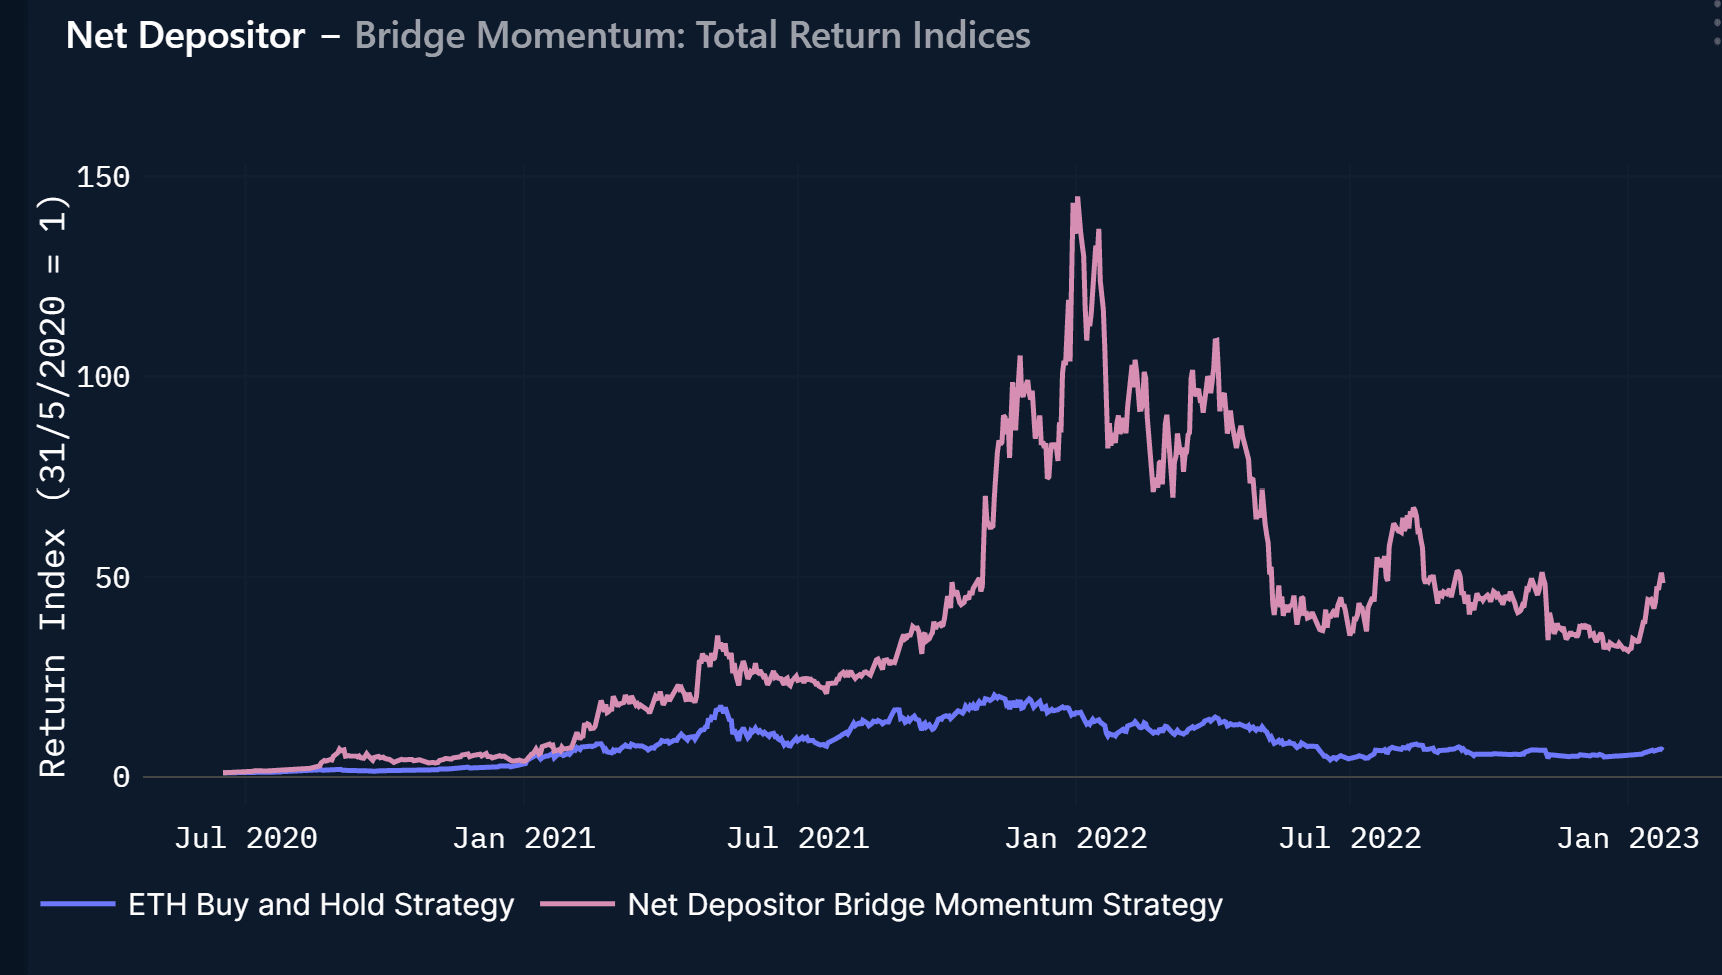
Nansen bridge trading indicator, which tracks bridge flows and invests in the governance tokens of the chains receiving the more bridge inflows, is up 59% YTD (vs 30% for ETH buy-and-hold). This strategy aims to beat the ETH benchmark in bull markets but seeks lower to equal price drawdowns in bear markets (see Return indices below).
What matters this week: US labor market data and the “Big Three” central banks
We expect this order of hawkishness for the central banks: ECB > Fed > BoE.
The Fed (Wednesday) has telegraphed a 25bps-hike (to 4.75%). Fed Chair Powell is likely to qualify the recent inflation data as encouraging but not sufficient to warrant a pause / or lower rates.
The Bank of England (BoE) has sounded increasingly dovish in its recent press conferences and is likely to continue this stance (expected to hike 50bps to 4.00% on Thursday).
The ECB has turned increasingly hawkish recently and any deviation from this stance would surprise markets (expected to hike 50bps to 3.00% on Thursday).
The US labor market data are the most relevant data this week and could influence the Fed’s stance. We expected higher than consensus (10.23m) Dec. JOLTs job openings on Wednesday. The consensus has January non-farm payrolls at 185k and the US unemployment rate at 3.6% (Friday).
Other important data will be: the US ISM Manufacturing PMI (consensus 48) on Wednesday and the Non-Manufacturing one (consensus 50.3) on Friday.
German January CPI (consensus 9.2%) and employment data will be released on Tuesday. So will the China Caixin Manufacturing PMI, which should come up close to slightly above the 49.5 consensus.