Macro
Market Cap and Volume
The NFT market has gone through periods of volatility and structural changes throughout the years. Crypto collectibles such as CryptoPunks, Hashmasks, and Meebits spearheaded the pre-NFT bull run from mid-2021 on, followed by the start of what was called the NFT summer from late 2021 to mid-2022.
We have also seen new marketplaces emerging in the past year, like Blur, which has proven to be a fierce rival to OpenSea. Despite the many marketplaces that launched late last year to early this year, the general sentiment for NFTs remains bearish, as visible in the tepid volume and liquidity across the board.

The total 500 NFT market cap stands at 2.3M ETH (~$3.8B) as we write. The NFT 500 market cap peaked at about $20.4B in early February 2022, after the initial NFT bull run (~5.4x today's value - a large factor of the decline having been the fall in ETH prices). It is still unclear whether the NFT landscape will return to its past levels, looking purely at volume and price trends. As the largest NFT collections make out the biggest chunk of the market size, the total NFT market cap hovers only slightly (~26%) above the NFT 500 market cap, which can confidently be used as a proxy:
NFT Mints: Down-Only
- NFT mints did not present a lucrative business opportunity this year. Only a few collections managed to mint out successfully while the majority were merely “vaporware”. Some of the known mints that actually happened were:
- Feb 2023: Checks - Pepe Edition
- June 2023: Elementals - 20k ETH
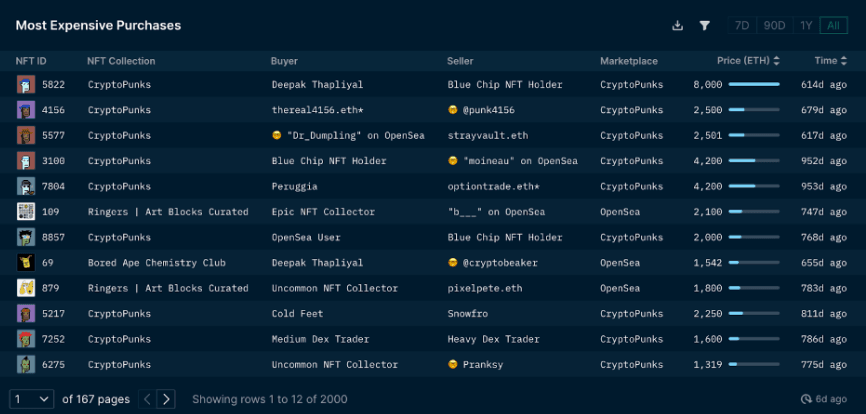
Most Expensive NFTs Purchased To-Date
- Out of 10 of the most expensive NFTs purchased to date, 7 NFTs were CryptoPunks. These NFTs were all purchased more than ~600-700 days ago, around February 2022.
- The most expensive NFT was sold for 8,000 ETH.
- Apart from CryptoPunks, Ringers (Art Blocks Curated) and Bored Ape Chemistry Club were also part of the Top 10 most expensive sales.
NFTs Bought and Sold Per Wallet
- The average number of NFTs bought and sold per wallet has been decreasing significantly since 2021.
- Focusing on the current year, the projects bought per wallet decreased 25% in 2023 vs. 2022.
- NFT traders are exhibiting a risk-off behavior, which is psychologically understandable, given market conditions.
Index Performance
Nansen’s NFT Indices are designed to measure the performance of NFT markets over time, focusing on segmenting different collections based on their functionality. The NFT Index methodology can be found here. The indexes are weighted according to the NFT collection’s market capitalization, which we calculate using Nansen Machine Learning Price Estimates and Sales Floor.
Performance Across the Different NFT Index Categories
- As of November 1, 2023, all Index categories had a drawdown of <-50% year-to-date, except for Nansen Bluechip.
- Nansen Metaverse-20 had the most significant price decrease, or -62% year-to-date, followed by Nansen Game-50 down -60%.
- Nansen Social-100 and Nansen NFT-500 were down -55% each.
- The Nansen Art-20 sector experienced a fall of -52% “only”.
NFT Index Performance vs. Crypto and Traditional Assets
The exhibits below present the % change of the prices in USD of Nansen NFT indices vs other traditional and crypto assets.
Note: The end-date is November 1, 2023. The DeFi Index is the equal-weighted price index (starting on January 1, 2022) of the following DeFi tokens: Aave, Chainlink, Compound Governance token, Curve DAO token, DYDX, GMX, Lido DAO token, Maker, The Graph, Uniswap.
- Both crypto and traditional assets outperformed NFT indices since the start of the year.
- In a one-year timeframe, BTC has outperformed other crypto assets as well as traditional assets, with a 76% price increase. The Nasdaq equity index came second with a 24% return, carried by AI narratives, followed by ETH, which rose by 21%.
- The Nansen NFT Metaverse Index performed the worst, with a -56% drawdown, followed by the NFT Social Index down -48%, and the wider NFT-500 Index down -47%.
Collection Analysis
Top Collections Pre-NFT Bull Run (Before Jul 2021)
- Before the initial NFT bull run happened, several NFT collections launched and were considered “Blue-Chips” due to their historical values.
- Prior to July 2021, CryptoPunks took up 53.8% of the Ethereum NFT volume across the 5 top collections, followed by Decentraland: LAND, Meebits, Hashmasks, and FOAM Signal.
Top Collections During the Initial Bull Run (Between July-Nov 2021)
- During the initial bull run, when NFT activity started picking up, CryptoPunks led the race, alongside Bored Ape Yacht Club, Mutant Ape Yacht Club, Cool Cats, and Meebits.
Top Collections During NFT Summer (Between January and July 2022)
- During the NFT Summer, Otherdeed for Otherside, Bored Ape Yacht Club, Mutant Ape Yacht Club, Azuki, and CryptoPunks were the top collections in terms of volume generated.
- The only collection that maintained its place in the Top 5 collections (in terms of volume) since pre-NFT bull run (pre-July 2021), was CryptoPunks.
- Impressively, three of Yuga Labs’ collections ranked in the Top 3 in terms of volume, during the NFT bull run.
NFT Sales For Specific Collections After one-Year of Ownership
Next, we attempt to understand what happened to the NFTs that were purchased during the bull market: did their owners hold on to them, or did they sell?
- We analyze the sales of NFT collections that were popular during the NFT bull market (namely BAYC, MAYC, Otherdeed for Otherside, Meebits, Azuki, BEANZ, Clone X, Pudgy Penguins, Moonbirds and Milady).
- The goal of the analysis is to monitor whether wallets that have purchased their NFTs are still holding onto their NFT collections, after one-year of ownership. It tracks the sales trend for the aforementioned collections by month.
- In general, sales across the NFT collections have been trending upwards especially as the bear market intensified and realized prices kept falling. NFT prices peaked in February 2022, and sales started to accelerate after November 2022.
Overall, Otherdeed for Otherside had the most sales by owners who have held their NFTs for more than a year before, followed by Bored Ape Yacht Club, Meebits, Mutant Ape Yacht Club, and CloneX.
BEANZ, Moonbirds, and Azuki had the least sales for users who have held their NFTs for more than a year, which could either suggest that the collections are not heavily traded, or alternatively count relatively loyal holders.
Platform Analysis
Trading Volume Across Platforms (as a % Total Trading Volume)
- The chart below represents the share of the total NFT trading volume accounted for by each trading platform.
- Prior to February 2023, OpenSea (dark blue area) held about 40 to 50% of the total NFT trading volume across platforms. At the time, Blur’s market share was starting to increase, even if OpenSea was still viewed as the NFT marketplace leader and giant.
- From February on and during the rest of the year, Blur’s trading volumes dramatically increased, to the detriment of competing platforms. Blur ended up taking up to 60-70% of total trading volume.
- As of 31 October 2023, Blur represented 75% of the total trading volume across marketplaces, while OpenSea accounted for 15%, and X2Y2, SudoSwap, LooksRare, etc. share the remaining volume.
Unique Wallets Across Platforms
- Despite Blur’s dominance when it comes to trading volume, OpenSea still attracts roughly half of total unique wallets across platforms. This suggests that users are more likely to make their first transaction on OpenSea as opposed to Blur.
BLUR, the Kingmaker of NFTs?
The launch of Blur’s marketplace has upset the once-dominant leader in the NFT marketplace, OpenSea.
At present, Blur takes up about up a majority of the total NFT trading volume, leaving OpenSea with a share of less than 20% (see second chart above). OpenSea’s leadership was the strongest before October 2022, when it gathered about 60% of NFT trading volume.
Blur introduced a new bid-pool order-book model that has narrowed bid-ask spreads, enhancing the experience of trading NFTs, to the detriment of buy-and-hold strategies.
Blur’s bid pool balance saw a peak of 92k ETH, on March 8, 2023, and has experienced a steady decline since. Currently, the pool balance stands at 37.4k ETH, almost a 3x decline since March 8, 2023.
This large-scale bid dryout is likely due to the lack of incentives and rewards for providing bid-side liquidity on Blur at current conditions.


Catalysts, Upgrades
- BLUR Season 2 Airdrop Distribution
The BLUR Season 2 airdrop distribution is expected to take place on 20 Nov 2023. The price of BLUR is worth paying close attention to, as the price would influence how much expected value the Blur Season 2 rewards will generate, which will impact volumes in a reflexive way.
On the other hand, the Season 2 airdrop distribution could also be a source of concern, as the 300M+ BLUR tokens (this represents ~30% of the 1bn circulating supply) will be distributed to airdrop farmers, and will inflate circulating token supply. Moreover, the end of this trading incentive may also impact Blur’s trading volume, since a large volume of trading & lending/borrowing likely came from users who were trying to farm the airdrop.
- BLUR Fee Switch Discussions
There’s an ongoing discussion about Arca’s proposal to enable BLUR’s fee switch. The BLUR token was issued in February 2023, and the tokenomic design outlined a 180-day voting period for or against a fee switch on the platform. The fee switch proposal was put forward as the BLUR token only had a single use-case before that, namely the ability to vote on governance. Besides that, there are/were no clear incentives for token-holders. The proposal outlined that there should be a two-tiered solution to boost BLUR’s utility, namely, proposing a 1% base trading fee for Blur’s marketplace, with the fee then used to buy-back and burn BLUR tokens on a daily basis. Additionally, a fee discount was also proposed, depending on how much BLUR a user holds.
The proposal would have likely been viewed as a positive catalyst during the bull market but did not receive a good reception when it was proposed on October 13.
Competitive Analysis: How are The Other Marketplaces Performing?
Token Price Performance Across NFT Marketplaces
- While X2Y2 and LOOKS experienced a +400% and +100% price increase respectively in February, the token prices from NFT-platform tokens have faced a significant drawdown throughout the year.
- From May 2023 to October 2023, SUDO had the largest drawdown, and fell -72%, followed by BLUR -67%, X2Y2 -59%, and LOOKS with the shallowest decrease relative to its competitors at -51%.
Looksrare
LooksRare launched YOLO on 18 August 2023, a gambling feature that allows players to deposit assets (i.e: ETH, LOOKS, NFTs) into a shared prize pool that is distributed to the winners. The chances of winning are proportional to the amount a user deposits.
The YOLO betting machine has generated a total of 4.4k ETH (~$7.2M USD), including 13.7k games played in total.
In terms of token unlocks and emissions, LooksRare has unlocked 95% of its total supply (947.22M LOOKS) and holds a final unlock on November 27 of 37.5M LOOKS (~$2.25M USD).
Verdict: Is The NFT Bear Market Over?
Although there has not been a clear indication of a revival of the NFT market yet, the trading volumes have returned to levels seen in mid-August (~9,000 ETH per day). The increase in volume, however, is far from the levels seen during the NFT bull run, especially far below its peak of ~640k ETH on May 2, 2022.
Blur remains the dominant marketplace in terms of trading volume, with a market share of about 80% lately, largely surpassing OpenSea, LooksRare, X2Y2, and SudoSwap combined. When there are clearer signs that the NFT macro is improving, Blur could be a "pick" to express an "NFT beta".
When comparing the NFT Indices with traditional and crypto assets, it is clear that both non-NFT crypto assets and traditional assets have outperformed since the start of the year, while NFT Indices have trended downwards. Investors would have benefited from investing in US equities and crypto assets at the start of the year compared to NFTs. Although the data presented in this report are backward-looking, users can continue to monitor data trend and performance over time via Nansen queries.
Overall, NFT volumes, market cap, sales, mints, and other data would need to be scrutinized over a longer period to gain a clearer sense of where the NFT markets are heading. At this stage, we cannot conclude that the NFT winter has ended.