What happened last week
Sunday: CZ announces that Binance will liquidate its FTT holdings as part of “risk management” following the publication of an article by Coindesk casting doubts around the liquidity of Alameda's balance sheet.
Monday: Panic increases and withdrawals from FTX accelerate among rumors of insufficient reserves.
Tuesday: FTT price dives by ~76% in one day. Binance signs a non-binding letter of intent for a potential acquisition of FTT.com. / US Oct. NFIB Small Business Optimism 91.3 as expected. / China Oct. CPI 2.1% YoY vs 2.4% expected.
Wednesday: Twitter consensus emerges that FTX lent funds to bail out Alameda in Q2 2022, which led to a loss of assets for FTX. Binance walks out of the negotiation with FTX. / US headline CPI 7.7% vs 7.9% expected, US core CPI 6.3% vs 6.5% expected. / US initial jobless claims higher than expected for a second consecutive week: 225k (vs 220k expected).
Thursday: Informal estimate of FTX “lost” assets at ~USD 10bn.
Friday: FTX.US and FTX.com file for bankruptcy, SBF resigns. / China’s financial regulators announce 16 measures to bring relief to domestic real estate developers, notably granting an extension in the delay for repayment on bonds or trust borrowings. China also announces that it is weighing a gradual relaxation of the zero-COVID policy, and, as part of this, will soften quarantine requirements, and cancel the circuit breaker mechanism for inbound flights. / UK Q3 GDP 2.4% vs 2.1% expected. / German Oct. CPI 10.4% YoY as expected. / US Michigan Consumer Sentiment 54.7 vs 59.5 expected, 5-year inflation expectations up to 3% from 2.9% and 1-year inflation expectations up to 5.1% from 5.0%.
Sunday: US midterm elections: it appears that the Democrats will retain control of the Senate while the Republicans are likely to gain a small majority in the House.
Nansen’s take
To write that last week was eventful would represent a euphemism: the news around the centralized exchange FTX’s illiquidity situation and its likely misuse of client assets (commingled with the investments of the trading entity Alameda) culminated in a bankruptcy process. This has likely led to multi-billion dollar losses but also shaken the faith of the crypto community and potential new adopters and investors, notably in the institutional world. The analogy with similar episodes in traditional finance is useful to infer that crypto regulation in the US and globally is likely to come up on the stricter (safer) side of the spectrum (thinking of the Basel committees’ rules for banks enacted in the decade following the 2008 Lehman crisis). The risk of contagion from crypto to other asset classes appears contained at this stage though. The total crypto market capitalization, at ~USD 840bn is also much smaller than traditional assets’ market caps: the recently volatile UK sovereign bond market for example represents ~USD 2tn+.
Outside of crypto, geopolitical events and macro data from last week will have significant influence on upcoming narratives and markets’ performance. The US headline CPI missed consensus by 20 bps, a rare occurrence in terms of magnitude of the miss. The broad-based nature of the slowdown in US inflation from food, to services and owners’ equivalent rent is also significant as it shows that lower inflation is not only generated by the so-called “covid basket” goods (e.g. used cars) but also by services. The weakness in housing markets is also starting to leak to CPI (more on this later). Finally, the rumor of China exiting its zero-covid policy had more legs than we had expected last week.
These developments led to a surge in asset volatility with BTC and ETH each down ~20% week-on-week, despite a lower US dollar (down -4.3% vs the JPY!), US 2-yr and 10-year sovereign yields down 35 bps each (in one week!), US Tech equities up 7% and the Hang Seng index up 6.5%.
These developments beg three questions for the future:
- Have crypto assets reached their bottom?
- Has the US Dollar / DXY peaked?
- What are the most likely scenarios for 2023 in terms of inflation / growth mix?
Question 1: Have crypto assets reached their bottom? Bear markets die in despair, don't they? It very much feels like even the most fervent crypto stakeholders have reached the stages of despair and desillusion, following last week’s events. This is based on anecdotal conversations with prominent members of the crypto community and on the observation of CryptoTwitter reactions, but on-chain indicators tell a similar story as they have also reached their multi-year lows. Our BTC indicator (see chart below), which turned to risk-off in February 2021, has come very close to risk-on, based on its market-value-to-realized-value component (risk-on represents the level of ~15k USD for 1 BTC). The counter-arguments to the view that crypto has bottomed are the following. First, on-chain indicators only cover the period from 2009 to now, which represents the period of Quantitative Easing (QE) adoption by central banks. However, we think that the 2020s regime might be closer to the 1970s-1980s period marked by volatile inflation and rates. This means a less sustainable return to QE. Then, for a bottom to follow price “capitulation”, an asset class needs dry powder, from investors who have suffered limited or no losses from the asset class, in order to bring new buyers to this asset class. We think that news investors will support crypto, but maybe not just yet. A positive catalyst could be more regulatory clarity some time in 2023 for instance.
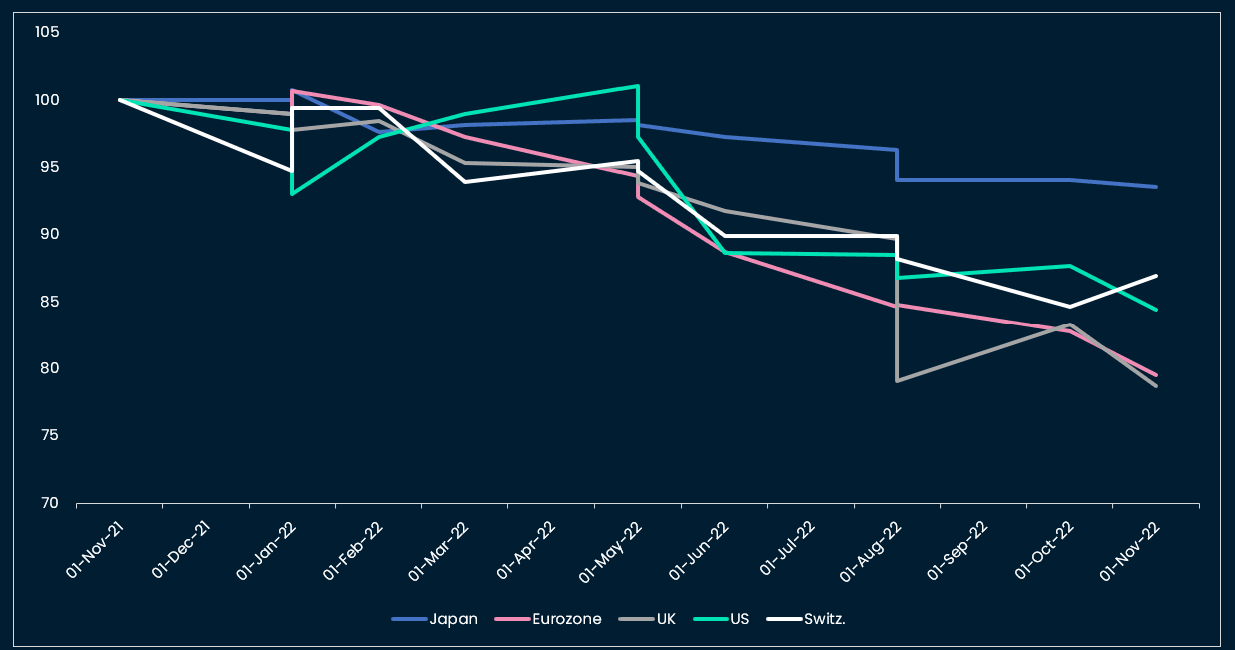
Question 2: Has the US Dollar / DXY peaked? From a carry-perspective, the US dollar is more attractive than the main DM currencies. If we take the framework of differential of growth (e.g. US growth stronger than the rest of the world means higher US dollar and vice versa), we find that the recent price weakness in the US dollar is justified to a certain extent. With natural gas prices coming down, the relative weakness in European growth looks priced in for now, for instance. Quantitatively, we analyzed the recent revisions in PMI forecasts by economists as leading indicators for relative country growth and found that Japan growth stood out as stronger than US growth. The picture for other DM countries is less clear (see chart below). To answer the question of the DXY peak is difficult: we still see US growth outperforming the rest of the world but have slightly less conviction in this scenario. To flip to a US dollar bearish view we need to: see a resolution of the Ukraine war and / or a clear path towards less energy-dependency from Europe, and, on the other side, clear growth weakness in the US. In the US, the yield curve indicator already forecasted a recession as likely to occur in 2023. Another indicator, the loan officer survey, showed net tightening of lending conditions for commercial loans to a level that was only reached during or a few months prior to US recessions: in April 1990, October 2000, April 2008 and April 2020 (see chart below). This is another indicator that suggests that US growth is likely to weaken significantly in 2023. We are waiting for clearer signals of growth weakness on the employment front and / or on traditional risk asset prices (e.g. credit spreads) to move to a full US dollar bearish view.
Question 3: What are the most likely scenarios for 2023 in terms of inflation / growth mix? We have answered the question of likely growth scenarios above: we expect growth weakness to materialize in the US in 2023 and, at some point, to push the Fed to pause hikes/QT. But the very tight US labor market says we are (at least) a few months away from this stage.
How about inflation? We were surprised by the slow down in OER (Owner Equivalent Rent) in US CPI, and, given its large weight in CPI (see chart below), we ran analyses to assess whether we are at a “turning” point for rent and therefore core inflation. Our findings show that the US Home Case-Shiller, which leads rent CPI by 12 months, points towards a slow down of rent CPI from April 2023 on only. We caution that the explanatory power of the regression of rent CPI on the lagged Case-shiller is 40%, and, as shown in our forecast chart below, there could be periods of overshoot / and undershoot between the forecasted rent CPI and actual rent CPI. We also tested the Zillow rent index, which indicates an earlier slowdown in rent inflation, e.g. in the coming months. The explanatory power of the Zillow regression is 80%, but we are reluctant to put too much weight on this analysis given its small data sample (data available from 2015 on only, vs from 1997 on for Case-Shiller).
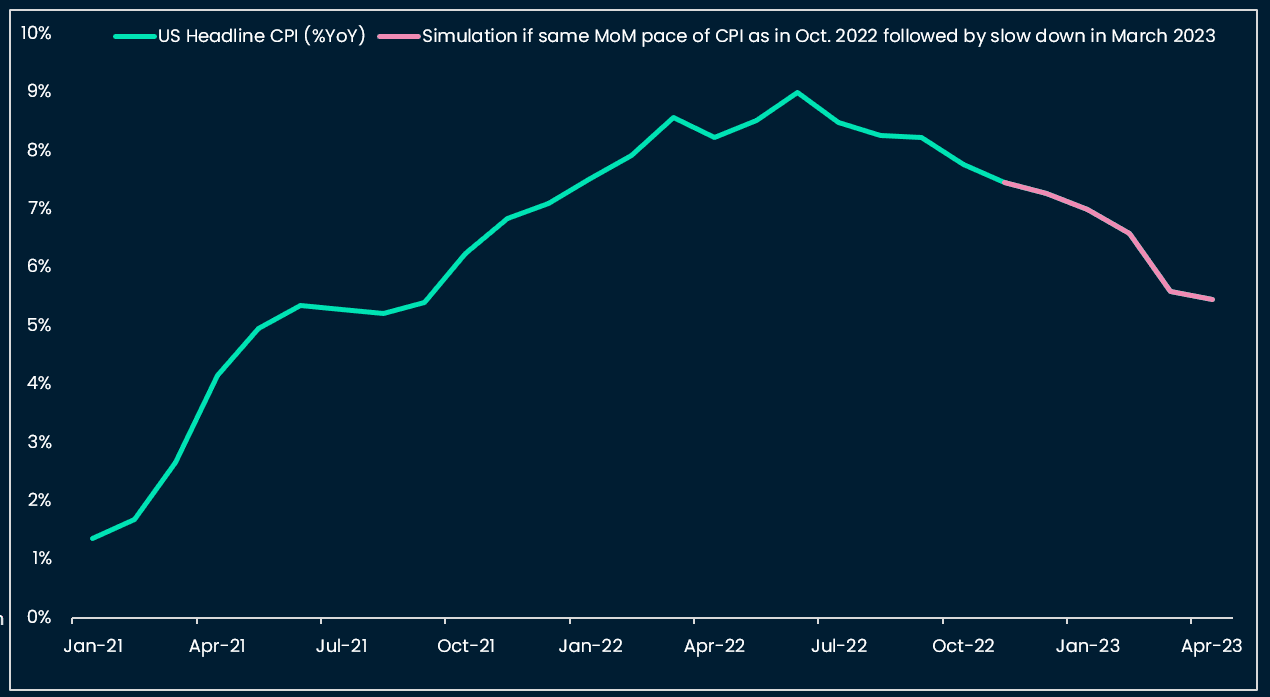
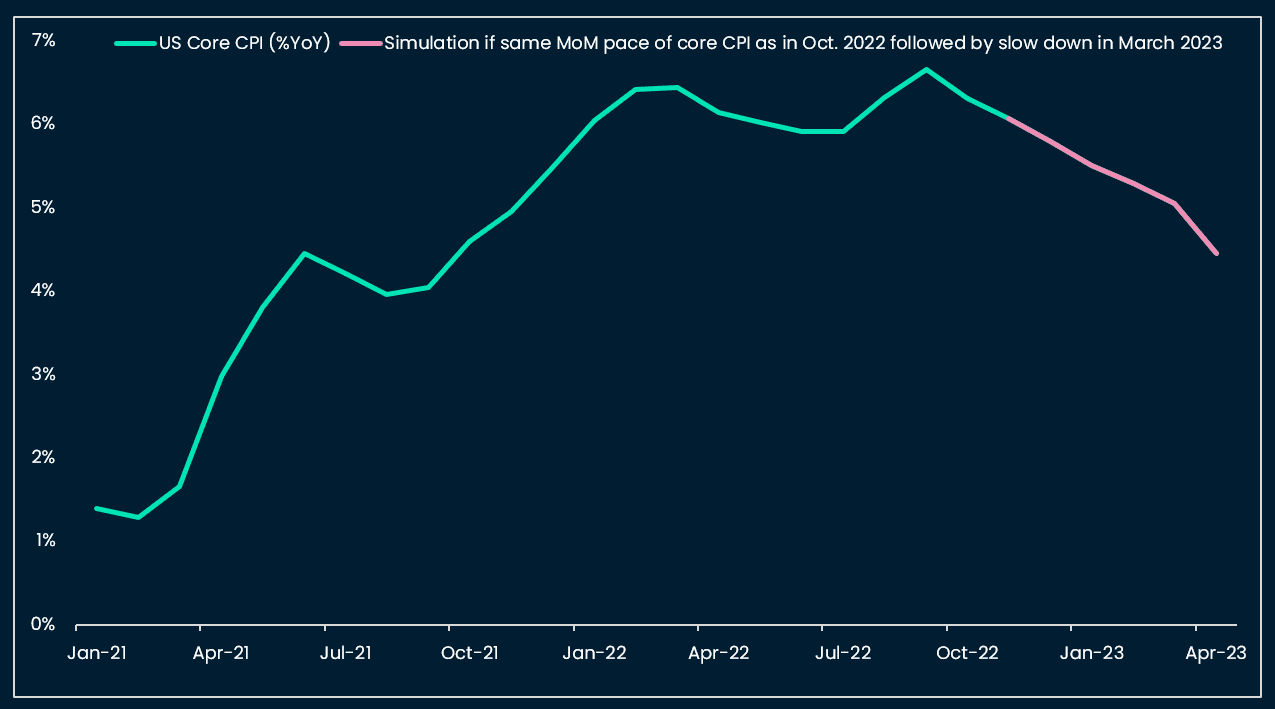
To summarize, we expect core CPI to decrease significantly from April 2023 on. If we assume the same MoM pace for both headline and core CPI as in October 2022 in the coming months followed by a decline of pace from April 2023 on, we still find that core CPI remains significantly above the 2% Fed target (at 4.45%) in April 2023. This reconciles with a terminal Fed Fund rate of ~5% that would lead to a slightly positive real rate. Finally, a divided Congress in the US also supports the scenario of slow desinflation, as the likelihood of any significant fiscal measure being passed is low.
What to pay attention to this week: PPI and CPI week globally. Has desinflation started?
Tuesday: German Nov ZEW Economic Sentiment, consensus -50 / Eurozone Q3 GDP, consensus 2.1% YoY / US Nov. NY Empire State Manufacturing Index, consensus -5 / US Oct. PPI, consensus 8.3% YoY
Wednesday: UK Oct. CPI, consensus 10.7% YoY for headline / US Oct. core retail sales, consensus 0.4% MoM. / Canada Oct. CPI, consensus 6.9% YoY (headline) / Australia Oct. labor market (consensus unemployment 3.6%)
Thursday: Eurozone Oct. CPI, consensus 10.7% YoY for headline / US initial jobless claims (consensus 225k)
Friday: US Oct. existing home sales (consensus 4.38m)
Charts that matter


