
Market-moving data and events
China’s reopening in the midst of recessionary data
- Chinese exports fell 8.7% YoY in November
- Chinese Politburo vowed to focus on boosting domestic investment and demand in 2023
- President Xi visited Saudi Arabia and vowed to expand Chinese imports of Saudi LNG. Meanwhile, Saudi Arabia agreed to work with Huawei on cloud computing and high-tech centers in Saudi cities. President Xi expressed his desire to pay Saudi imports in CNY, instead of USD, but this move seemed to have been discussed and not yet agreed upon.
The global services economy (ex-China) outperformed expectations in November Nov. Services PMIs
- Surprise to the downside: China Caixin: 46.7 vs 48e
- Surprise to the upside or neutral: Japan 50.3 vs 50e/ India 56.4 vs 55.4e /Spain 51.2 vs 50.5e/ Italy 49.5 vs 48.3e/ France 48.7 as expected / UK 48.8 as expected / US 46.2 vs 46.1e / US ISM 56.5 vs 53.3 / Canada 51.4 vs 51
The Bank of Canada’s dovish tilt The Bank of Canada hiked its policy rate by 50bps to 4.25%, but said in its Statement that it “will be considering whether the policy interest rate needs to rise further”, marking a dovish turn.
US: Fiscal to the rescue of union pension funds; PPI above consensus driven by financial services and food
- US President Biden contributed USD 36bn to shore up troubled union pension funds, with the majority of the infusion going to the Central States Pension Fund. The fund’s rescue came from the passage a year ago of the Butch Lewis Act, which was part of the American Rescue Plan Act.
- US Nov. PPI surprised to the upside at 7.4% YoY (vs 7.2% expected). The positive surprise was led by final food demand and final demand for financial services.
- US continuous jobless claims continued to come up higher than consensus (1,671k, +71k surprise)
Housing market cooling globally; Two US REIT funds gated assets
- The UK Halifax index, a leading indicator for housing prices, saw growth tumble from 8.2% YoY in November to 4.7% YoY in December, the lowest rate since 2019
- Starwood Real Estate Income Trust, became the second REIT fund, after Blackstone’s “BREIT” to limit asset withdrawals. Both REIT funds have the majority of their respective portfolios allocated to rental real estate in the US.
Crypto: USDC’s attempt to access Fed’s RRP USDC announced it planned to set up a separate money fund, managed by Blackrock and majoritarily invested in short-term Treasuries, and to apply to the Fed’s overnight reverse repo facility via this new fund.
This week: Of inflation and central bank meetings
Tuesday 13
- UK average earnings (consensus 6.2% YoY) and claimant count change for October (consensus +3.5k)
- German Dec. ZEW economic sentiment (has been improving recently, consensus is for this trend to continue to -26.4 level)
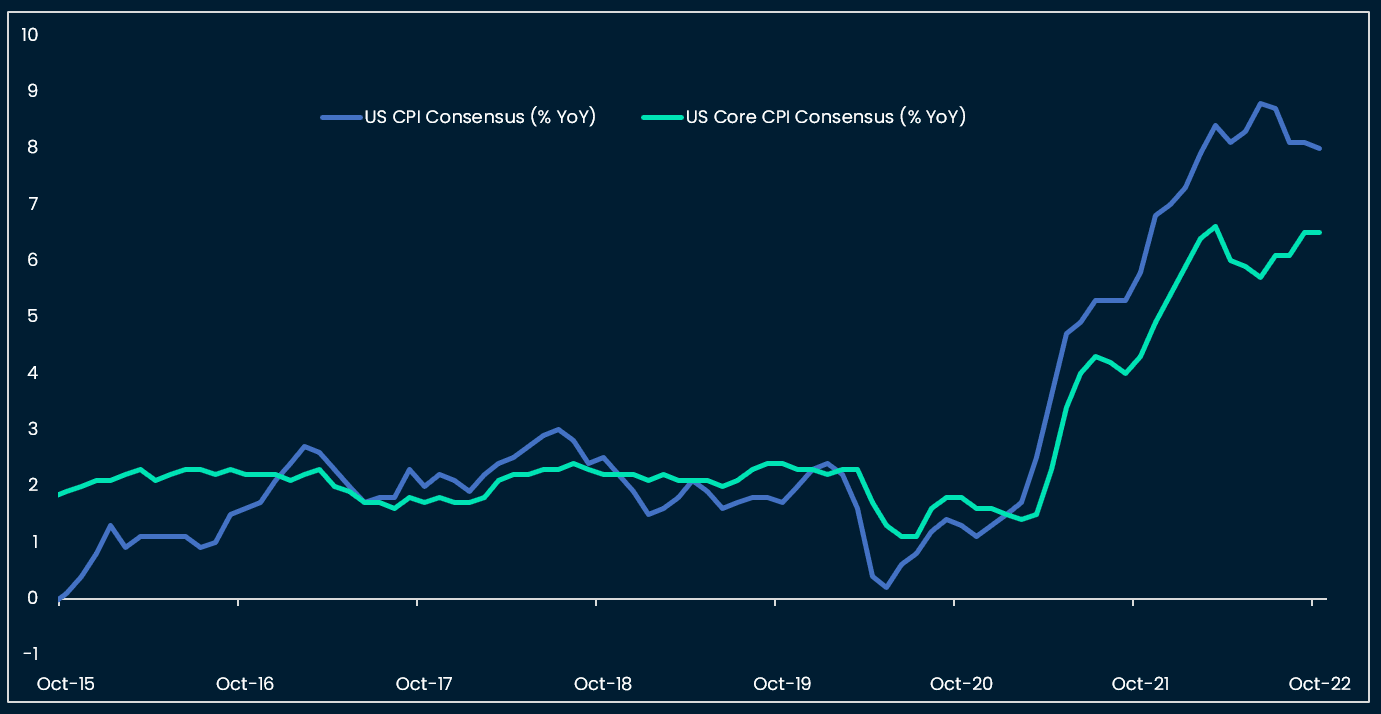
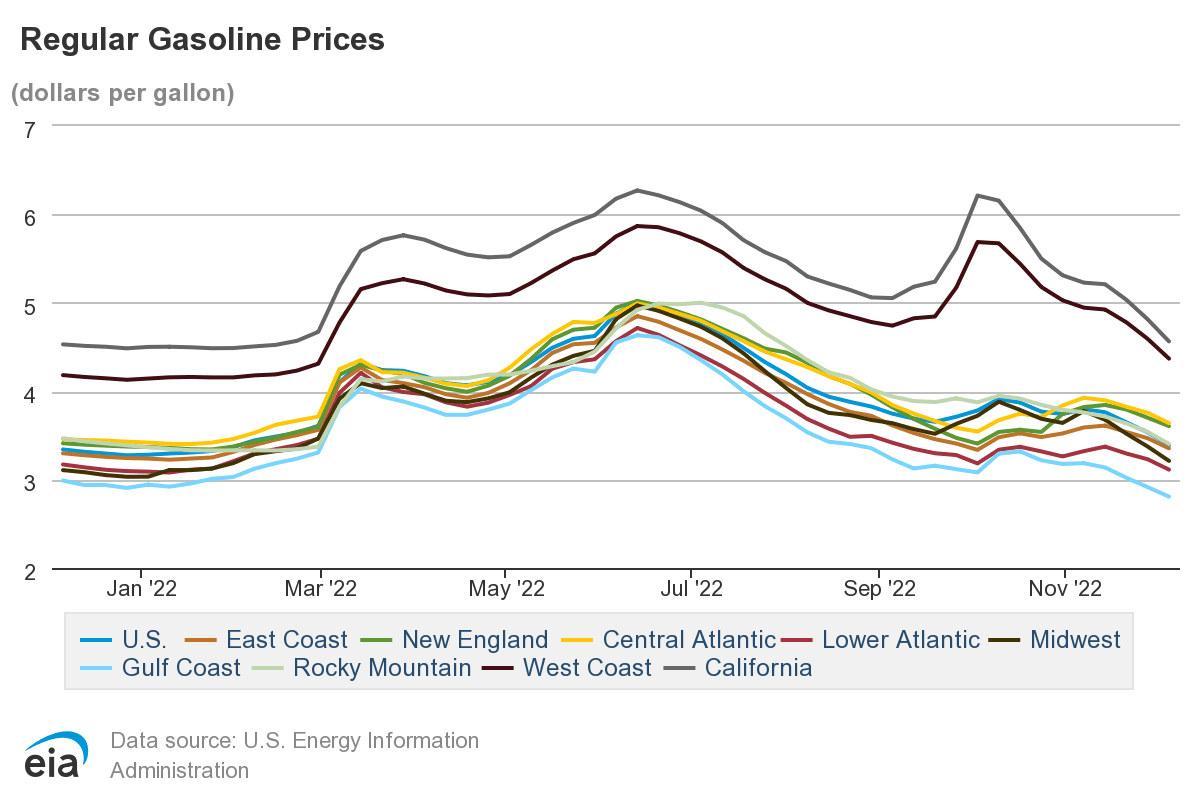
- US Nov. CPI likely to be helped lower by flat gasoline growth YoY (consensus 7.3% YoY for headline, 6.1% YoY for core)
Wednesday 14
- UK Nov. CPI (consensus 10.9% YoY)
- US FOMC: We agree with the consensus of +50bps hike to 4.50%. We expect the Fed to reiterate the message that housing and goods inflation are on the decline, but that services inflation is too high and the labor market too tight. We expect the Fed’s projections to indicate a terminal Fed Fund rate at 5-5.25%.
Thursday 15
- Bank of England meets (consensus for 50bps hike to 3.50%)
- European Central Bank meets (consensus for 50bps hike to 2.50%)
- US Nov. core retail sales (consensus 0.2% MoM)
- US Dec. Philly Fed Manufacturing index (consensus -12)
Friday 16
- UK Nov. retail sales (consensus 0.3% MoM)
- Eurozone Nov. CPI (consensus 10% YoY)
Nansen's take
Macro: Services sector, “last man standing”
Global manufacturing has clearly entered recession territory, as described in our last newsletters. In contrast, the Services sector could be described as “the last man standing” in the global economy, and appears in as good a shape as Manufacturing was in 2021. Of the 10 Services PMI reported by the major economies last week, 9 came in at or above expectations. Employment data in the US also showed that recreational services still commanded the highest employment gains, and that the sector still exhibited a “deficit” in the total number of its employees compared to pre-pandemic levels. Similarly, in Europe, social services and healthcare saw the fastest acceleration in advertised wage growth, in order to attract potential employees.
How long can Services and Services employment stay resilient in the face of higher interest rates? In the US, households' saving rates are back to historical lows, but wage growth has picked up. True, the labor market has been slowly normalizing in 2022, with both job openings coming down and jobless claims edging higher. To quote one of the respondents of the US ISM survey: “Job openings are seemingly continuing to decrease, but with demand for top talent still high and availability still rather scarce, the opportunity for growth is still there.”
At the current pace of normalization it might take some time for the Fed’s “soft targets” on employment to be reached:
- US job-openings-to-unemployed ratio back to 1 (currently 1.7)
- Wage growth back to 3-3.5% YoY (currently ~5% YoY)
At this week’s FOMC meeting we therefore expect the Fed to reiterate the message that housing and goods inflation are on the decline, but that services inflation is too high and the labor market too tight. We expect the Fed’s projections to indicate a terminal Fed Fund rate at 5-5.25%.
On a longer time frame, we think that fixed income future markets are pricing too early a Pivot (expect rate cuts from H2 2023 on). A strategy of hiking to 5% and then holding seems more probable to us, unless financial markets hit a significant bump as early as H1 2023 e.g. a credit event with contagion to the real economy.
China the outlier: The Chinese economy gathers the following conditions
- High saving rates following months of lockdown
- Financial markets at historical low valuations and with positive price momentum
- Economy exiting “zero-covid” policies
- PBoC and fiscal authorities willing to prioritize domestic demand and investment
- Willingness to help real estate developers manage “bad debt” All these conditions seem favorable to a cyclical outperformance of China in the short-term.
Financial markets: Cash still attractive
Our highest conviction is that cash is likely to stay attractive for longer. This is likely to motivate de-risking of large investment portfolios. We are seeing this starting to materialize in leveraged areas (UK LDIs) and investment vehicles with low liquidity (e.g. REITs), exposed to slowing macro (e.g. US housing for REITs).
Nevertheless, neither US credit nor US equity markets are priced for a recession. This highlights a contradiction between bond markets (and oil and the US dollar) which are priced for a Fed pivot, indirectly assuming a sharp growth slow down. Caution is therefore warranted until this contradiction is resolved, possibly by lower risk asset prices.
Crypto can be conceptualized as higher than equity on the risk spectrum (we estimate a risk premium ~10x the equity risk premium) and therefore is unlikely to bottom before equities capitulate, even with crypto having corrected more than global equity markets peak-to-trough.
Signs of crypto market bottoming:
- The US yield curve steepens
- Equity and credit capitulation
Aside from macro and market dynamics, regulatory developments are also key for crypto. We note that Circle is aiming at legitimizing a hybrid off-chain / on-chain model for USDC. The idea is to guarantee USDC safety off-chain, via access to the Fed’s RRP, while keeping USDC’s utility as an on-chain asset. If Circle succeeds in its attempt, this will signal that the US is open to integrate stable coins in the regulated financial system, with or without the cohabitation of a CBDC, which, in any case, is taking more time to develop and validate.
Charts that matter
Global manufacturing in recession

Economists pricing peak inflation
Energy price direction so far confirming peak headline inflation in the US
Leading indicators say housing inflation to slow from April - May 2023 on

US core CPI scenarios

US savings unlikely to sustain the consumer

But US wage growth above target and re-accelerating

US job market tightness consistent with sustained wage growth

Eurozone and DM labor markets also tight

Europe ex-UK wage growth accelerating

Eurozone, ECB, and the irony of wage growth targets

Bond futures pricing pivot in mid-2023

US equity risk premium inconsistent with recession

S&P500 testing and failing to break 200d MA

High yield spreads not pricing US recession either

Oil market in contango: negative roll

Watch European gas price as temperatures fall

US dollar weakness driven by macro convergence

On-chain crypto indicators at capitulation levels

Crypto momentum turning less negative

Long-term BTC indicator close but not yet at buy