
Introduction
This report will focus on delving into our latest Token Paradise Dashboard to surface 'trending' tokens based on the activity of Nansen users.
The token popularity by week dashboard shows the percentage of ‘interest’ in the Top 20 tokens by week historically, which can be filtered by 3m, 6m and 1y. The top trending tokens weekly are also segmented across different user bases on Nansen which could be used to show early trends or profitable opportunities. A score is calculated based on the clicks a token receives on Nansen dashboards - with the top token’s popularity always set as 100 and the score for the other tokens relative to the number of clicks the top token receives. The report will make more sense of this dashboard for more actionable insights - it looks at ways to create benchmarks for tokens and their performance over different time frames by looking at users’ PnL for these tokens.
By combining Nansen’s dashboard token popularity data and on-chain data, the report aims to gain a greater understanding of how one could affect the other. Our analysis looks into DEX trades PnL of tokens to their popularity scores over time to check for any correlation. Based on the results, a benchmark can then be created to signal potentially profitable opportunities in the future - making it easier to surface the signal.
Trending Tokens
Tokens Paradise presents a quick overview of the latest top tokens based on price change, DEX trading volume, Smart Money holdings as well as fresh wallets/CEX netflows. It also includes a DEX PnL leaderboard where users can see the highest realized PnL for DEX trades, which can be filtered by 24H, 7D, 30D and 90D.
While this is all on-chain data, the ‘Trending on Nansen’ tab utilizes Nansen dashboard off-chain anonymized search data to determine the popularity of tokens among Nansen users. Since price movements of tokens are often affected by sentiments as well, having this off-chain metric could help us to better understand the activity on a certain token over time.
The chart below shows the Token Popularity by Week for the Top 20 most searched tokens on Nansen historically, which can be filtered by 3 months, 6 months and 1 year. Each token’s popularity is calculated as a percentage relative to the other Top 20 tokens. Looking at the 6 month timeframe, the Token Popularity on Nansen has largely reflected the market narratives at that point in time.

In August 2022, LDO was one of the top searched tokens by week until the start of September, likely in relation to the Merge which happened in mid September. APE started to gain greater popularity in mid September, with the announcement of APE staking to be launched by late October. The fall of FTX saw FTT gaining a significant share of mindshare during the period when it happened, despite having low popularity prior to the event. BIT also saw a surge in its popularity, likely in relation to speculations of Alameda Research selling 100m BIT which was not supposed to be sold till 2024. APE regained popularity following that, with the official launch of the APE staking contract. Towards the end of the year, narratives for the next year began picking up which saw tokens such as LDO, DYDX and FXS gaining popularity. These tokens are part of prominent narratives - Liquid Staking Derivatives (LSDs) in view of the ETH Shanghai upgrade in March, as well as the app-chain thesis in view of cross-chain interoperability and UX. The popularity of these tokens seems to have some correlation with price movement as well, given that LDO, DYDX and FXS have seen significant positive price action in the past week.
Besides historically popular tokens, another table was also created to track the top tokens across the different Nansen user tiers updated weekly. The table of top tokens is shown below. The Rank Change column is an indication of a token’s increase or decrease in ranking from the previous week. If there are no values under that column, it indicates that the token was unranked in the previous week. The score is calculated based on the number of users interacting with a token on the Nansen dashboard, relative to the total number of clicks received by the top token. Hence, the top token will always have a score of 100, while the other tokens are ranked relative to it for that week.

Among the top 20 trending tokens in the past week, we noted that some of the tokens on the leaderboard are part of the strong narratives for the year ahead.
Liquid Staking Derivatives (LSDs)
The narrative has gained traction in the past week, following positive price action for many tokens in the basket - including LDO, FXS and RPL which have charted in the leaderboard across Nansen users of all plans. The Shanghai fork upgrade slated to happen in mid March will allow users to unstake their ETH from the ETH 2.0 validators. While this may seem ‘bearish’ for ETH, many are predicting the inverse given that the ability to withdraw staked ETH at any time allows it to be more liquid and attractive to investors. Hence, attention is on the LSDs protocols and how they will compete for market share in the coming months. Furthermore, Binance just announced that it will list RPL, bringing more attention to LSDs tokens.
App-chains
The app-chain narrative has been taking shape as a solution to scalability and interoperability for apps to specialize in one vertical and compose with others over some semi-trustless protocol. Tokens related to this narrative and have charted in the leaderboard include DYDX and SYN. Both protocols have announced the move towards their own chain, with dYdX and Synapse migrating from Ethereum. dYdX is set to launch its own Cosmos chain, with testnet slated to go live by Q2 2023.
Metaverse
The narrative surrounding metaverse coins has always been omnipresent. While not as strong as other narratives, recent developments for GALA have seen it chart on the popularity leaderboard across different plans. Messages in their Discord show that the team has apparently bought over a mobile game studio and also introduced a burn mechanism whereby all GALA used on the platform to make a ‘purchase’ for the whole of Q1. Such news has seen GALA’s price going up, which has propelled SAND and MANA as well - showing how closely linked they are in terms of price movement.
Tokens Benchmark
To determine whether the popularity of a token on Nansen can be attributed to the price action of the token, we created a benchmark based on the DEX trades PnL for holders of these tokens. DEX trades PnL only covers tokens bought or sold from DEXs, with profit or losses only taken into account when the wallet sells the tokens. It will not be able to track the PnL if the wallet that bought the tokens transfers it out to another wallet. Hence, the PnL estimates are a rough guideline for wallets’ performance on a particular token and are not representative of all holders.
For our analysis, we looked at the PnL of the Top 20 tokens in the past 12 weeks and their corresponding popularity score for each of the weeks. Looking at the top profitable token for each week, the average popularity score for the top token of the week is 0.05. The breakdown of each token’s profit and popularity score for the week is shown below.


The above benchmark exercise is then repeated for the last 6, 9 and 12 months to check if this benchmark would shift with a longer timeframe. This ensures that the benchmark is tested for different market conditions across different time periods, allowing for more accurate results. The bar graph below shows the overall benchmark results.

Even though we expanded the timeframe of our benchmark calculations on popularity, there were not many fluctuations. The benchmark generally ranges between 0.04 and 0.06. This suggests that regardless of market conditions in each timeframe, there is not much difference in terms of popularity benchmark. As a rough rule of thumb, a 0.05 popularity score is a good target for users who want to identify tokens that are trending with the possibility of positive returns.
To further validate this benchmark, we also looked at the average PnL of each Top 20 token over the past 12 weeks to see if there is any stronger correlation between PnL and popularity score. The chart below shows the breakdown for each of the tokens.

From the chart it shows that there is no clear correlation between average PnL and popularity score. This could be attributed to the fact that PnL can depend on many factors that are hard to control - such as availability of the token on DEXs, general market sentiment and the demographic of traders of that particular token which can indirectly affect traders ability to make profits. The duration of narrative surrounding a particular token could also play a part, given that some tokens are traded short term while some are a long term hold for different types of traders. The popularity of a token could also have negative connotations depending on the situation at that point in time. For example, FTT was by far the most searched token during the week of the FTX collapse, even as the token price fell drastically. Thus, during such black swan events, the popularity of a token should not be taken as a positive sign. Nonetheless, this exercise is still valuable as it shows that the popularity dashboard is useful in surfacing trending narratives. Meanwhile, the profitability will depend on an additional parameter - the positive or negative sentiment surrounding these tokens.
One example that demonstrates this contradiction between PnL and popularity is the APE token - which had an average popularity score of 0.11 but an average PnL of -$3.5m. Even though APE has been ranking high in terms of popularity, the average user who traded through DEXs still made a loss on the token. One reason for this could be that APE was a strong narrative in the past 12 weeks due to the APE staking event. Due to the event, most of the APE tokens would likely be sent to the APE staking contract, and thus, activity for APE on DEXs would have taken a smaller percentage of all activity on the token. Thus, the average profit might not have been an accurate representation of most holders.
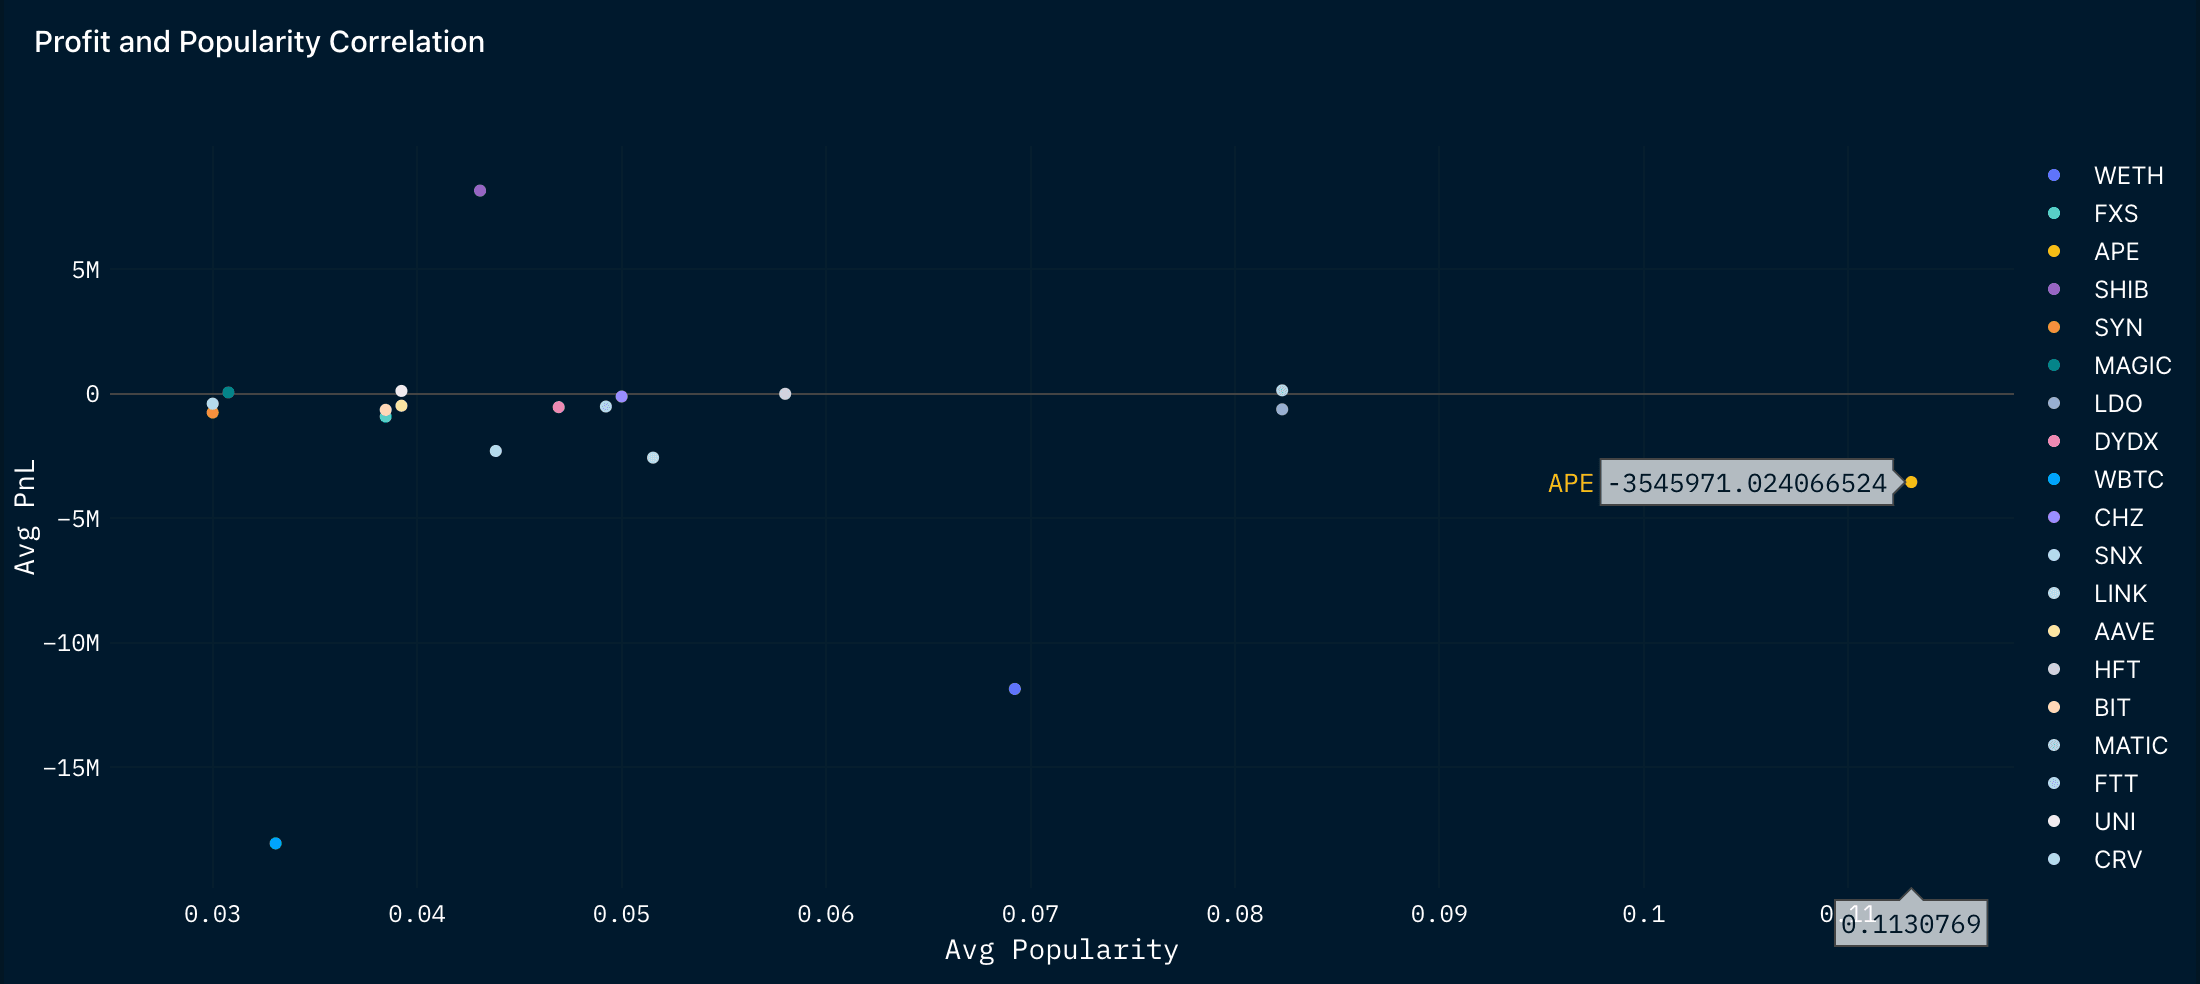
In contrast, MATIC which is placed second in terms of average popularity has been profitable for the average DEX trader - with an average popularity score of 0.08 and an average PnL of $135k. MATIC has been gaining significant attention given that Polygon has made significant moves in a bear market by partnering with renowned companies which could signal higher adoption from a larger audience. As a result, MATIC has seen positive price action in recent months, possibly attracting traders as a short term play leading to profitable DEX trades.

Thus, the popularity scores of each token can help to surface current market narratives. However, it should not be used as an indicator of PnL as there are many other factors affecting it.