Introduction
In this note, we analyze the recent developments in the rapidly shifting macro environment and the implications for crypto as an asset class. We also assess the out-of-sample performance of our NFT sentiment indicator, created in a prior note.
TLDR
- Global growth has entered a sharp slowdown phase, mainly due to global central banks turning more hawkish.
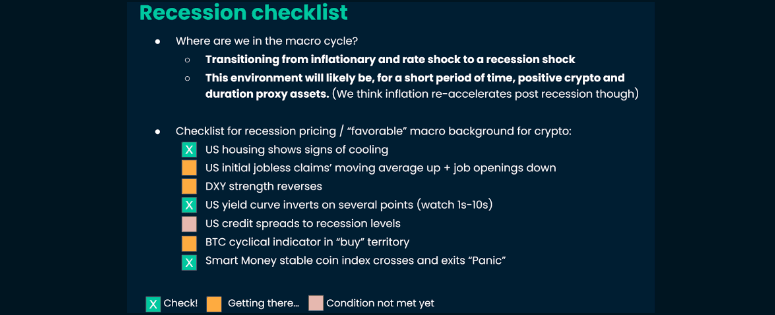
- In the US, inflation remains the top worry for the Fed. This will change if and when the US economy converges with the rest of the world and weakens: this could occur via global financial market contagion (from Wall Street to Main Street)
- “Early” signs to watch for a more crypto-favorable macro environment: US high-yield spreads closer to recessionary levels (currently stand at half of their 2020 high), US dollar peaks, US Treasury yield curve re-steepens
- The new macro “regime” that will likely characterize the next few years bears similarities with the 1970s-80s and promises to see high rate volatility.
- Volatile “discount rates” imply volatile crypto asset prices in this new regime.
- Turning to NFT asset performance within crypto, we find that overlaying the Nansen NFT sentiment indicator help reduce price drawdowns out-of-sample
When will the macro “winter” end?
Where we are in the cycle: From inflation to growth shock
In our last note, we discussed a potential timeline for a Fed pivot. Studies of US Treasury yield curve inversions dating back to the 1960s led us to an extensive range of estimates for a Fed pause starting in Q4 this year till Q1 2024, with the average lag between the US yield curve and Fed pause bringing the “average” time estimate to ~Q1 2023.
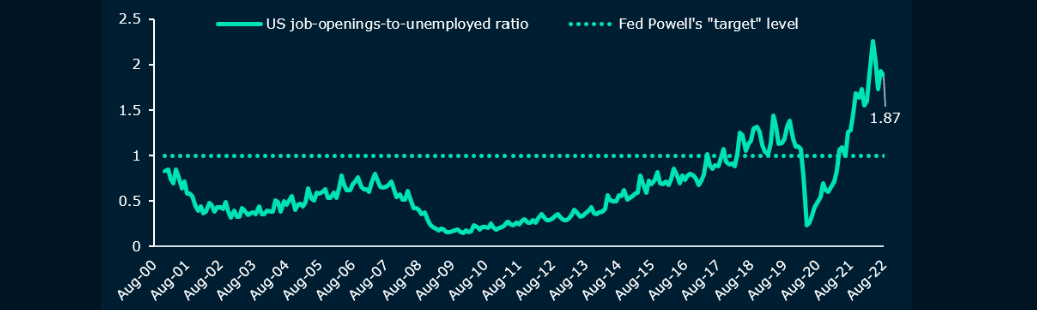
Since then, we have been surprised by the ongoing resilience of the US job market (job-openings-to-unemployed ratio ~1.87, see Figure 1).
This and a beat of US August core CPI vs expectations led the US Fed to guide markets towards a higher terminal rate: in its September Summary of Economic Projections, the Fed dot plot showed the policy rate revised up by 100bps to 4.4% for end-2022 and up 80bps to 4.6% for end-2023 (from June estimates).
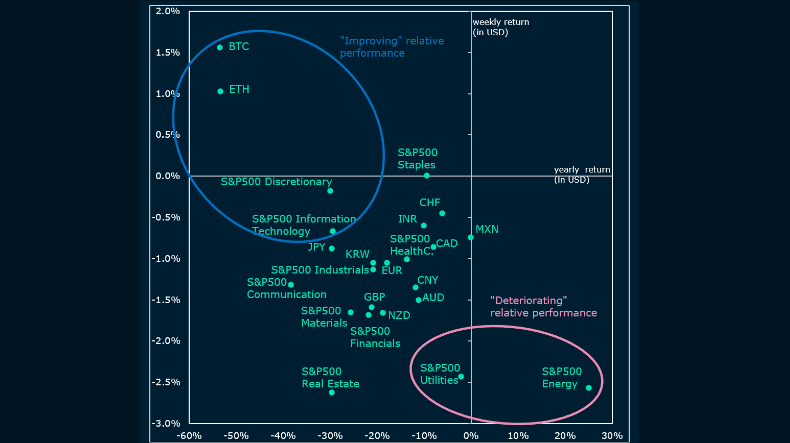
As a result of this hawkish shift, markets, from commodities to equities, have started to price the scenario of a global recession. Figure 2 shows the performance of BTC and ETH vs the US dollar basket’s (BBDXY) components and vs. S&P sectors. In the last week, in particular, energy, industrial and financial sector assets started underperforming “tech” stocks and crypto.
If we follow the cycle of asset bubble bursts (see latest Jeremy Grantham note), the next logical phase is indeed a phase of macro weakness, in a context of decelerating but residually high inflation.
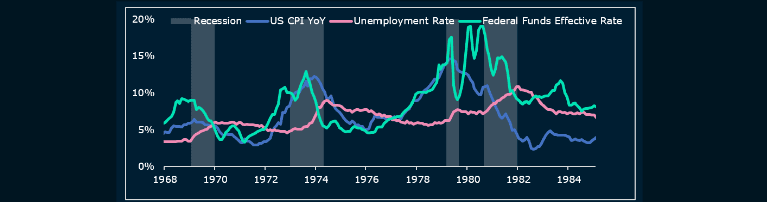
Looking at the macro regime of stagflation that characterized the 1970s and early 1980s, we observe that the Fed only paused after a significant increase in the unemployment rate, which, if we draw a parallel with our current macro environment, indicates that a sizable domestic macro slowdown is a condition for the Fed to stop tightening. Incidentally, the Fed’s September economic projections showed an unemployment rate median for 2023 of 4.4%, a 70bps increase from the August 2022 level. We also observe in Figure 3 that in the 1960s-early 1980s Fed Funds Rate adjusted fast, with the Fed constrained to hike just after it had cut rates to contain inflation, despite ongoing increases in unemployment.
Looking at the latest US macro data, the upward trajectory of unemployment is not yet visible. Additionally, US confidence indicators have started to beat expectations again. This contrasts with macro weakness in energy-dependent and geopolitically-troubled Europe and in countries with risquées fiscal decisions, namely the UK (estimated +6% of GDP in fiscal spending in 2022-23 to cap energy prices and finance tax cuts) and monetary policy, especially Japan (yield-curve-control combined with FX intervention).
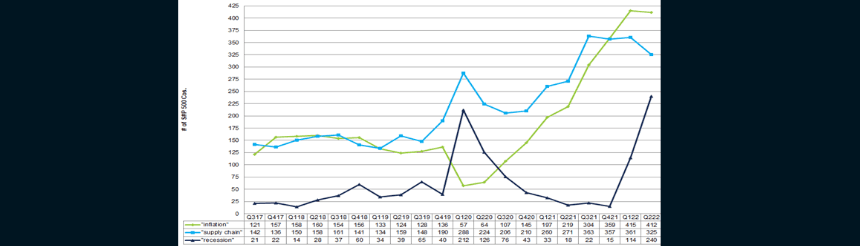
How long can this global divergence last? Will global macro weakness bleed to the US? Shifting our focus from Main Street to Wall Street fundamental data, earnings guidance is already being dropped by large US corporations and the word “recession” is almost as present as “inflation” in earnings reports.
A convergence of the US economy towards the rest of the world will be visible when it occurs through peak US dollar strength.
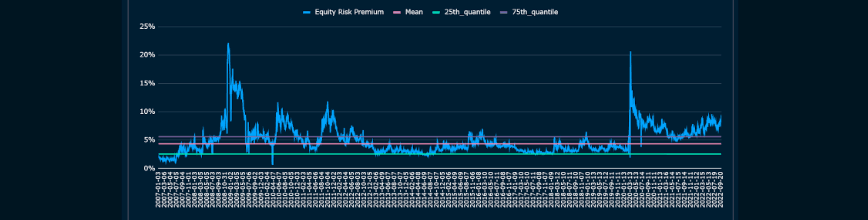
Below are the criteria needed to ascertain the cyclical macro environment has turned favorable towards crypto: Peak, US dollar strength, will likely go hand in conjunction with a re-steepening of the US yield curve. Capitulation on traditional risk assets is also needed. High-yield credit spreads and equity risk premiums need to move higher.
Longer-term crypto drivers: macro regime, technology and regulation
Taking a step back and looking beyond the next phase of this macro cycle (e.g. 2023), the next ten years will be marked by de-globalization and conflicts between major global powers (after Ukraine, the obvious candidate for a potential global conflict could be Taiwan). This geopolitical context, persistently high inflation, and DM governments increasing their debt burden to protect consumers are all ingredients for a highly volatile rate environment challenging for crypto (see Figure 3).
The other essential crypto drivers are technological - Ethereum's successful change towards proof-of-stake is so far encouraging - and regulatory. The European Union finalized the full text of its landmark “Markets in Crypto Assets” (MiCA) legislation. Meanwhile, the US announced its goal to enact “laws against unlicensed money transmitting to apply explicitly to digital asset service providers” as early as Q1 next year.
Across jurisdictions, we have identified the following themes and areas of crypto being highlighted and prioritized in regulatory drafts:
- Algorithmic stablecoins and any stablecoin tracking a fiat currency: the need for consumer protection and capital backing
- Know-your-client regulations and application to digital apps and platforms: goes against confidentiality value of OG crypto (see latest Tornado polemic)
- Exchanges and trading / DeFi platforms need to be regulated: it goes against the principle of decentralization and “non-institution-dependent” decision-making. However, who is accountable in front of the regulator? The DAO behind a specific app? The voting members only? The developers? And what is the power of the regulator over app governance?
- NFTs are coming into focus, too, in contrast to a few months ago, with both the Eurozone and the US interested in regulating the financialization of NFTs.
NFT market developments: how de-correlated have NFTs been from other risk assets?
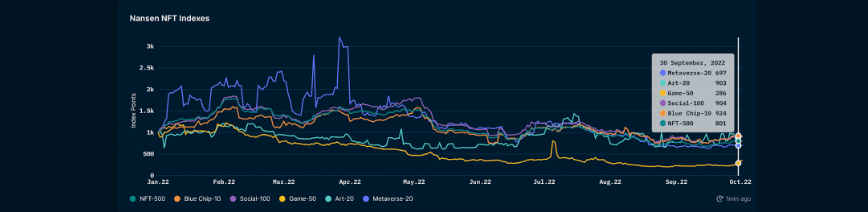
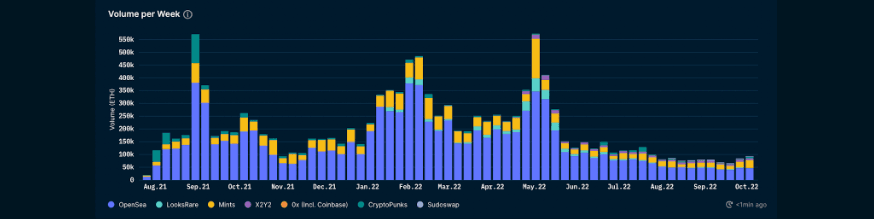
The macro forces of global monetary tightening are overpowering other drivers for crypto. The NFT market is no exception, with most of Nansen's NFT price indexes registering double-digit falls in USD terms year-to-date. Year-to-date, the NFT-500 (ETH), which measures the broad NFT market activity, is down -19.9%. The downturn in the NFT market was also evident through observing the market’s transaction volume on the Ethereum chain.
A closer examination of NFT trends highlighted a few notable insights:
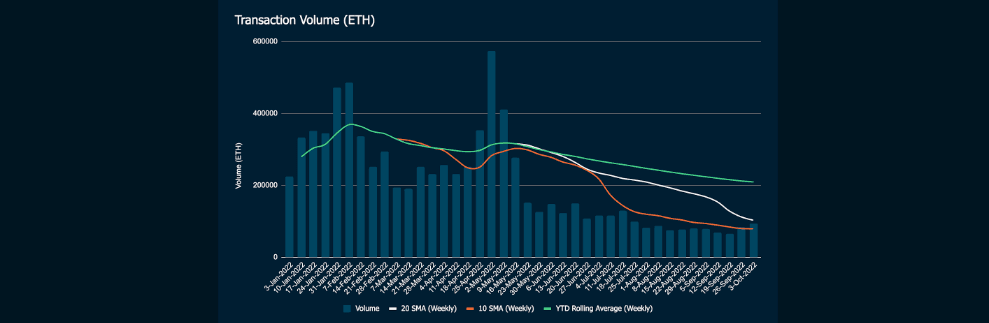
- 2021’s NFT transaction volume was 5.04m ETH, while 2022’s YTD volume was 8.24m ETH.
- At the end of Q3, the weekly transaction volume (less the wash trades estimates) was 93.9k ETH, which was below the YTD rolling weekly average volume, the 10-week simple moving average volume, but higher than the 20-week simple moving average volume.
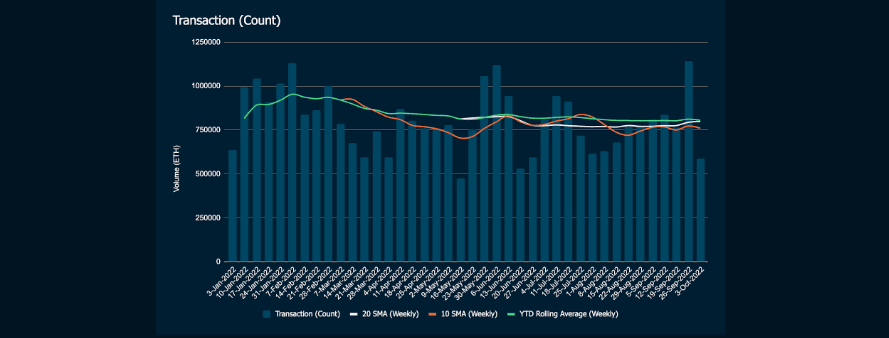
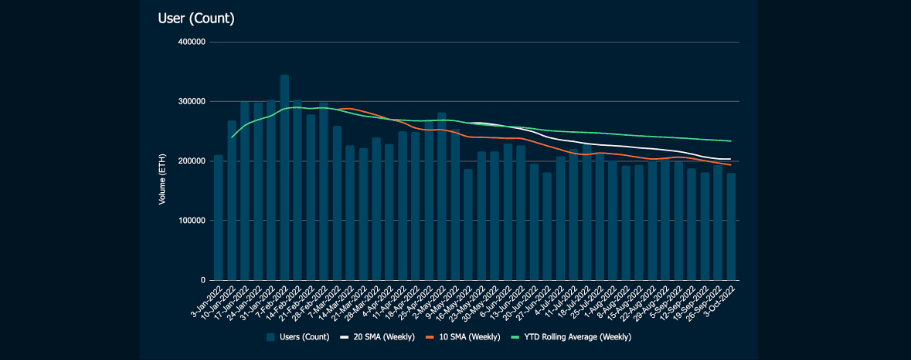
- When using a similar approach to analyze transaction count and user count, we found that in the last week of Q3, the weekly transactions and user counts were below all metrics (i.e., rolling weekly average, 10-week and 20-week simple moving averages). Although it is worthwhile noting that in the prior weeks towards the end of Q3, the weekly transaction count surpassed its weekly averages.
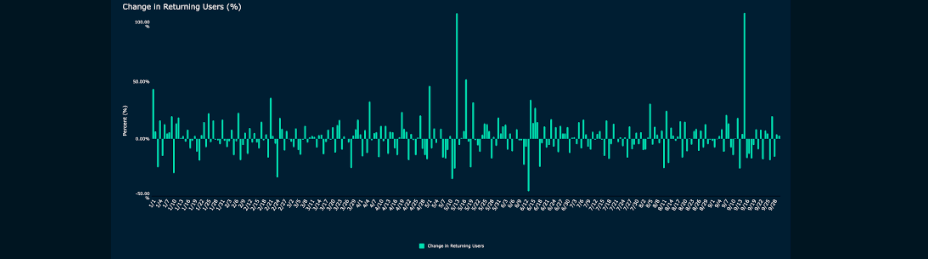
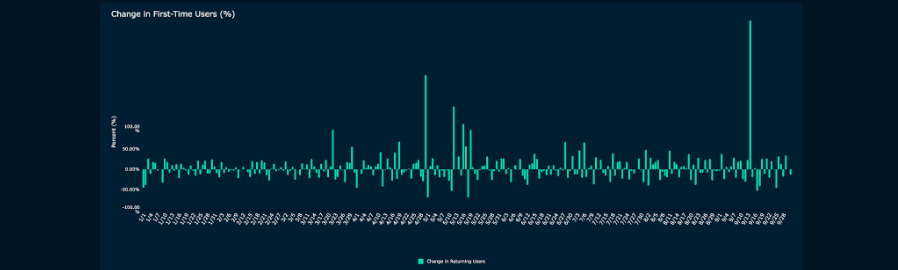
- Considering the flow of returning and new users, we zoomed in on the rate of change. YTD, the average daily change for returning users, is at +1.1% and +4.1% for first-time users.
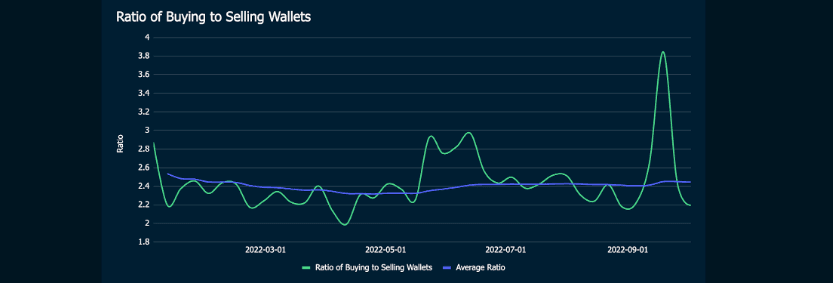
- The proportion of wallets buying-to-selling has remained relatively stable with a YTD daily average of 2.5 Buying to 1 Selling wallets.
The NFT sectors which experienced the least downturn when measured in ETH YTD are Blue Chip-10 (-7.6%), Social-100 (-9.6%) and Art-20 (-9.7%). On the other hand, Gaming NFTs experienced the biggest downturn when measured in ETH, with the Game-50 index (ETH) experiencing a YTD drop of 71.4%, followed by Metaverse-20 (ETH) experiencing a -30.3% YTD decrease. Yet, despite the retracements, investment by VC firms into GameFi and Metaverse has increased from $874m in 2021 to $2.4b in 2022. A possible explanation for the drop in ETH-related Gaming NFTs and Metaverse NFTs prices could hint at such NFTs being launched on other chains as opposed to the Ethereum chain. On-chain data shows a growth in launched games and active gamers playing on chains such as Hive, Polygon and BNB.
NFT sentiment indicator: out-of-sample behavior
We revisit our NFT sentiment indicator, created in an earlier publication (see https://www.nansen.ai/research/a-sentiment-indicator-for-nfts), to test whether it helps cushion NFT price drawdowns in this hostile macro environment.
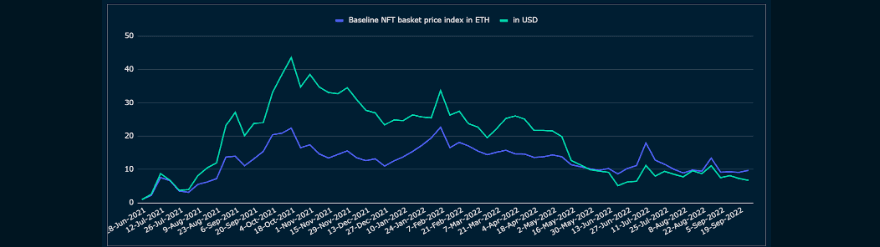
Our benchmark is the “Baseline NFT Basket Index”, composed of the following bluechip collections: Bored Ape Yacht Club, Crypto Punks, Chrome Squiggle, VeeFriends, Meebits, Autoglyths, Cool Cates, and CyberKongz Genesis. We use the equal-weighted seven-day mode price of each collection.
We observe that the index lost 73% in USD terms year-to-date (Figure 7).
We now use our NFT sentiment indicator as a signal overlay (trailing 14d signal below or above threshold implies invested / non-invested in the Baseline NFT Basket Index). The thresholds are 0% (Figures 8, 9, 12, 13) and 5% (Figures 10, 11, 14, 15) respectively.
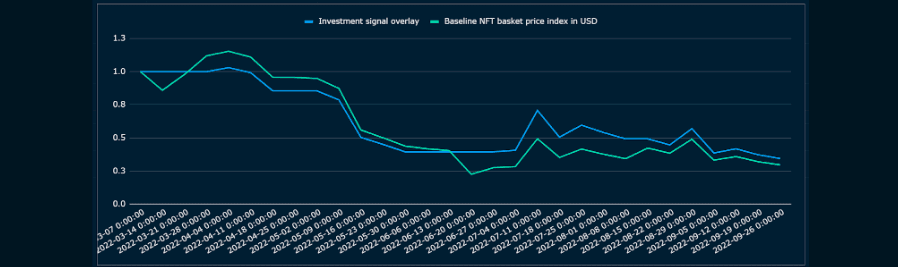
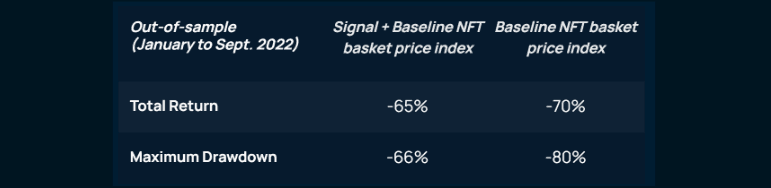
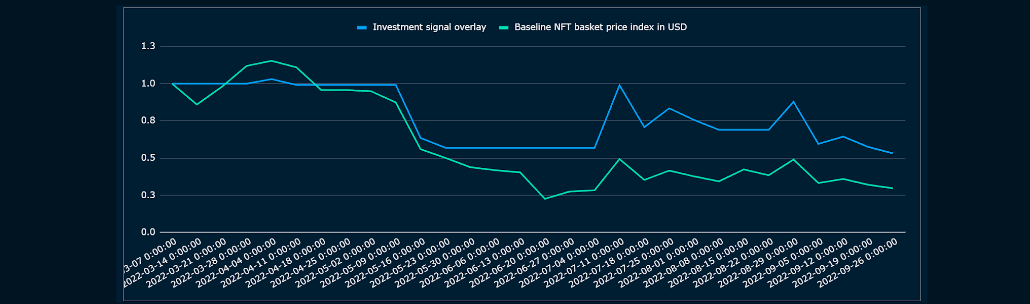
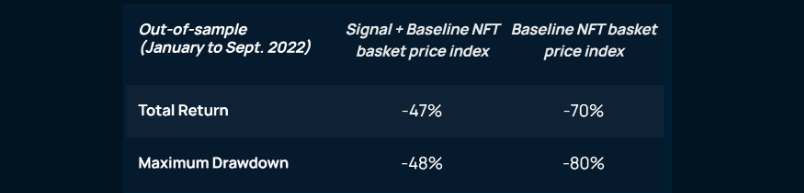
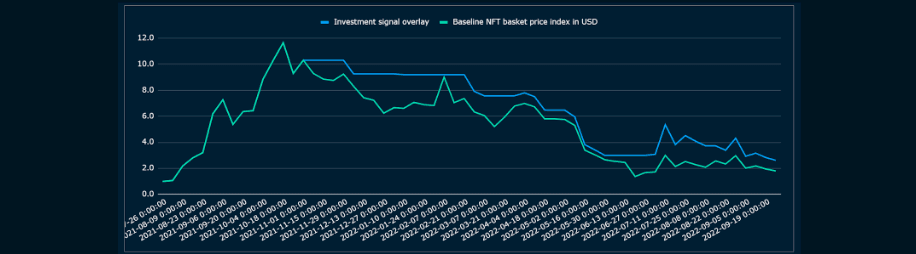
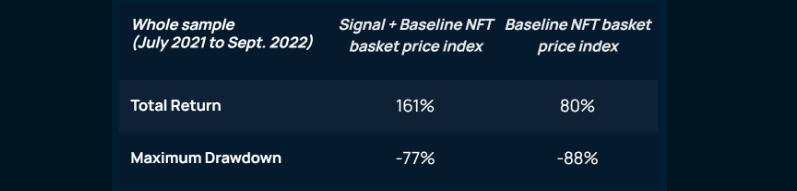
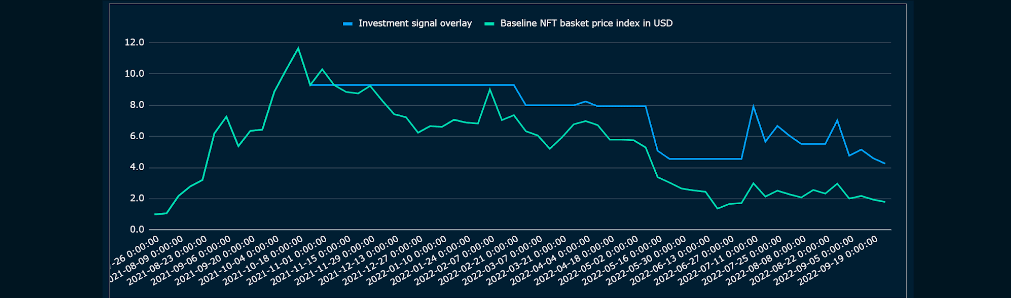
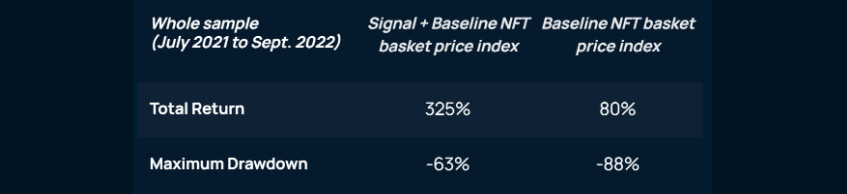
The charts and statistics above show that if the NFT sentiment indicator does not manage to “avoid” the complete price downturn (again, the pure macro analysis would be more helpful there), it does help to cushion the NFT investment performance and reduce the maximum price drawdowns by 14% and 32% respectively, out-of-sample.
This confirms the short-term predictive power of the two components of the NFT sentiment indicator 1) Realized NFT price volatility, 2) Ratio of Bluechip volume vs total NFT trading volume.