Introduction
Optimism is a Layer 2 solution introduced to increase the scalability of Ethereum. Optimism launched the first tesnet version of its Optimistic Rollup on the 24th of September 2020, while its alpha mainnet didn’t launch until January 2021.
In order to incentivize adoption on the chain, Optimism airdropped its token targeting projects and users in the space (see breakdown below). The Optimism token was launched on the 31st of May, and the initial distribution attracted a lot of criticism from the community after some users were able to claim and dump tokens early.
This was due to the team failing to make the contract pausable and underestimating the amount of load on their public RPC endpoint. Although the team admitted that mistakes were made and were transparent about the whole situation, some in the community were not happy with users who dumped their airdrops. A governance proposal was also submitted proposing to ban those who sold from receiving future Optimism airdrops.
Additionally, the Optimism foundation was also able to identify and remove 17,000 sybil attackers from the ~250k wallets that were eligible for the initial airdrop. It redistributed 14M OP tokens that were destined for the attackers to other recipients proportionally.
Overall, the airdrop distribution of OP tokens was far from straightforward. As a result, this report concentrated on examining what users and projects did with the OP airdrops that they received.
Governance Fund
Through the Governance fund, Optimism is distributing 5.4% of the total initial token supply (231,928,234 OP) to Optimism projects and communities. 18.38% of the total Governance Fund is approved for distribution and 37,980,770 OP tokens have been distributed successfully to proposals so far (Source: Optimism GovFund: Public Distribution Tracking).
The Governance Fund's main objective is to promote the long-term development of projects and communities within the Optimism ecosystem. Not all grants must be incentive schemes, though. The team outlines that any and all ideas that would promote development or fill a gap in the Optimism ecosystem, including public goods projects, will be taken into consideration. However, deliverables related to growth should be expected in exchange for governance money. Funding public goods without the expectation of future work is not the governance fund's goal.
Phase 0
Phase 0 was designed to reward existing projects that have driven the growth of the Optimism ecosystem.
The amount of funding for each project was determined by a set of on-chain metrics, calculated via a snapshot of the Optimism chain on April 1, 2022 at 12:00am UTC. A total of 36,600,000 OP tokens have been approved for distribution and 34,100,000 OP tokens have been distributed at the end of Phase 0, accounting for 15.52% of the Governance Fund.(Source: Optimism GovFund: Public Distribution Tracking)
Phase 1
The first voting cycle for GovFund Phase 1 proposals started on June 23, 2022. Phase 1 will continue until the Governance Fund is exhausted. The Governance Fund distribution for this phase can also be seen in the Governance Tracker. A forum proposal can be submitted by any project on Optimism to request any number of OP tokens. The proposal has to outline how the tokens will encourage growth on Optimism. After a proposal is accepted, a project is still allowed to submit further requests. The Optimism Foundation advises, however, that projects distribute their original allocation of tokens before requesting more.
Airdrop 1
The Optimism Foundation's Airdrop #1 (5% of the OP token supply) rewards those who have contributed significantly as early adopters and active users of projects within the Optimism ecosystem. A total of 248,699 addresses are qualified to receive OP tokens in this initial airdrop. Six sets of requirements apply to the airdrop (Source: Optimism App). They also determine the amount of distribution eligibility.
- Optimism Users: used an OP bridge prior to June 23, 2021, or used Optimism projects more than once between June 23, 2021 and March 25, 2022.
- Repeat Optimism Users: came back to use apps on OP in four different weeks between June 23, 2021 and March 25, 2022.
- DAO Voters: active participants in governance on L1.
- Multisig Signers: control over large pools of capital and key protocol functions.
- Gitcoin Donors (on L1): funded public goods on L1.
- Users Priced Out of Ethereum: used bridges while being a regularly active user on L1.
Each set is distinct, thus one address may qualify for more than one set and be given the appropriate number of tokens. A snapshot of addresses was taken on 03-25-2022 at 00:00 UTC.
The tables below give a breakdown of the allocations based on the criteria.
| Name |
| OP Allocated per Address |
| Optimism Users | 92,157 | 776.86 |
| Repeat Optimism Users* | 19,174 | 1,692.49 |
| DAO Voters | 84,015 | 271.83 |
| Multisig Signers | 19,542 | 1,190.26 |
| Gitcoin Donors (on L1) | 23,925 | 555.92 |
| Users Priced Out of Ethereum | 74,272 | 409.42 |
Source : Optimism, * Note that Repeat Optimism Users Receive 776.86 + 1,692.49 = 2,469.35 OP
| Overlap Bonuses |
| OP Allocated per Address |
| 4 Categories & OP User | 2,707 | 4,180.54 |
| 5 Categories & OP User | 627 | 13,330.16 |
| 6 Categories & OP User | 45 | 27,534.98 |
Source: Optimism
Please note the amount of OP tokens that an address receives is cumulative, meaning that the sum of OP tokens allocated for each matching criteria set is the amount that an address is eligible to claim (overlap bonuses are not cumulative).
More information can be found on this Optimism page.
Methodology
Projects
As mentioned above, Optimism airdrops were awarded to both projects and users that made significant contributions to the Optimism ecosystem, so our analysis was divided into both projects and users airdrop recipients.
In order to initiate the analysis of the project airdrop recipients, the live Optimism GovFund: Public Distribution Tracking Excel sheet (available at the Optimism site) was used as the main source for the airdrop distribution breakdown. This Excel sheet provides the list of all the projects that received the airdrop along with the amount and the date of distribution.
The table below gives a breakdown of all the different projects that were recipients of the airdrop and the allocated amount they received covered by our analysis.
| Project Name | Status | Distribution Date | Amount (OP) |
| Uniswap V3 | Sent | September 7, 2022 | 1,000,000.00 |
| Oneinch | Sent | Aug 15, 2022 | 300,000.00 |
| Celer | Sent | August 4, 2022 | 1,000,000.00 |
| Aave | Sent | Aug 3, 2022 | 300,000.00 |
| Chainlink | Sent | Aug 3, 2022 | 1,000,000.00 |
| Polynomial Protocol | Sent | July 19, 2022 | 900,000.00 |
| 0x | Sent | July 8, 2022 | 300,000.00 |
| Aelin | Sent | July 14, 2022 | 900,000.00 |
| Slingshot | Sent | July 8, 2022 | 300,000.00 |
| Wepiggy | Sent | July 26, 2022 | 300,000.00 |
| Thales | Sent | July 8, 2022 | 900,000.00 |
| Pika Protocol | Sent | August 26, 2022 | 900,000.00 |
| Layer2dao | Sent | July 8, 2022 | 300,000.00 |
| Synthetix | Sent | July 27, 2022 | 9,000,000.00 |
| Clipper | Sent | July 8, 2022 | 300,000.00 |
| Kwenta | Sent | July 15, 2022 | 900,000.00 |
| Rubicon | Sent | July 8, 2022 | 900,000.00 |
| Gelato | Sent | July 8, 2022 | 300,000.00 |
| Stargate Finance | Sent | July 19, 2022 | 1,000,000.00 |
| Lyra V1 | Sent | July 20, 2022 | 3,000,000.00 |
| Perpetual Protocol | Sent | July 8, 2022 | 9,000,000.00 |
| Balancer & BeethovenX | Sent | Aug 8, 2022 | 500,000.00 |
| Pickle Finance | Sent | Aug 15, 2022 | 200,000.00 |
| Rotki | Sent | Aug 9, 2022 | 190,770.00 |
| Candide Wallet | Sent | Aug 9, 2022 | 190,000.00 |
Data: Optimism, as of 30/09/22
Projects approved for allocation but still in the process of receiving payments were not included in the table (as well as projects that didn’t have their receiving wallet address verified).
Since the airdrops were distributed to the L2 wallets of the projects, the study focused on all the trades that happened on the two major DEXs (on the chain) after the airdrop date to identify selling activities. We limited our analysis to Uniswap and Velodrome (for selling destinations) as the majority of transactions happened on these exchanges.
Transferring out of the wallets to another wallet address is not considered a sale. As a result, it is possible that a user could’ve sold on other DEXs on the chain, not yet labeled/covered by Nansen, or withdrawn the tokens and sold on other chains as well.
After identifying all the L2 addresses of the OP airdrop project recipients, the following steps were used to determine the percentage of selling:
- Identified the OP token contract address, airdrop address, Uniswap liquidity pools addresses, and Velodrome pools addresses.
- Filtered transactions that were sending OP tokens from the airdrop address to the list of the project addresses.
- Among the airdrop recipients, tracked how many projects interacted with Uniswap and/or Velodrome liquidity pool addresses at least once, and sold OP tokens in exchange for other tokens.
- For each project, summed the OP token value sold and divided by the initial airdrop amount to calculate the percentage of the amount sold.
- Excluded the projects who did not sell OP tokens to Uniswap and/or Velodrome from the project's airdrop recipients list and labeled them as holders.
- For those projects that did not sell any OP tokens, simply set the percentage of OP tokens sold to be 0.
Users
For user airdrop recipients, the process of identifying the percentage of OP tokens sold is similar. However, the data for the user airdrop recipients was not readily available in a spreadsheet and the amount of users that participated is significantly more compared to the 25 project recipients above. Therefore, an extra step using Nansen data was performed to identify the user airdrop recipients:
- Identified the OP token contract address, airdrop address, Uniswap liquidity pools addresses, and Velodrome pools addresses.
- Filtered transactions that were sending OP tokens from the airdrop address.
- Recognized all the user addresses that received OP tokens from the airdrop address.
- Tracked how many users interacted with the Uniswap and/or Velodrome liquidity pools addresses at least once, and sold OP tokens in exchange for any other tokens.
- For each user, summed the OP token value sold and divided by the initial airdrop amount to calculate the percentage of the amount sold.
- Excluded the users who did not sell OP tokens to Uniswap and/or Velodrome from the user's airdrop recipients list and labeled them as holders.
- For those users that did not sell any OP tokens, simply set the percentage of OP tokens sold to be 0.
User Airdrops
In order to understand what users have done with the Optimism airdrops an analysis of wallet addresses that interacted with DEXs (specifically Uniswap and Velodrome) was undertaken.
While these wallets received the airdrop by meeting the requirements set by Optimism and can be referred to as ‘user’ wallets, it is not possible to determine the entity behind these wallets (at least not for the ones with no label). As a result, these wallets could potentially belong to funds, projects, or any other type of entity that is not considered a typical user. Additionally, one individual/entity could also be behind multiple wallets, meaning that a unique wallet address doesn’t necessarily represent a unique individual user.
As mentioned above, in order to determine the users who sold after receiving the airdrop the analysis focused on the top DEXs active on Optimism. It makes sense that if a user’s only intention was to sell his airdrop tokens to make a quick profit, naturally he would be incentivized to sell his tokens on exchanges with the most liquidity on the chain (hence Uniswap or Velodrome). However, it is also possible that one could choose to migrate his tokens to other chains or sell them in other low liquidity exchanges not labeled by Nansen. The main focus of this study, however, was not to track every single transaction across various chains and exchanges. The report focused on getting a general picture of the on-chain behaviors of users that received the OP airdrop.
By analyzing the transfer tokens of the wallet addresses that received the airdrop, a total of 60,180 transactions linked to sellers were identified. The average sale amount was also calculated to be 1,419 OP tokens ($1,234.88 USD as of Oct 5. 2022), while the total amount sold across the Dexs covered amounted to 111,009,499 tokens ($96,605,905.50 USD as of Oct 5. 2022). When we compare the total tokens sold by the wallet addresses in these sales (up to the time covered) to the total airdrops received, we found that they collectively sold 120% of what was airdropped. This means they’ve bought or transferred more tokens into their wallets during the period covered. It could also mean that they are accruing more OP tokens in the hopes of an upward price action.
The charts below show the breakdown of the sales volume across the DEXs. Unsurprisingly, Uniswap dominates as the most active exchange on the chain. Only 5.7% of the OP token sold across the Dexs were captured by Velodrome, while Uniswap took the rest (94.3%).
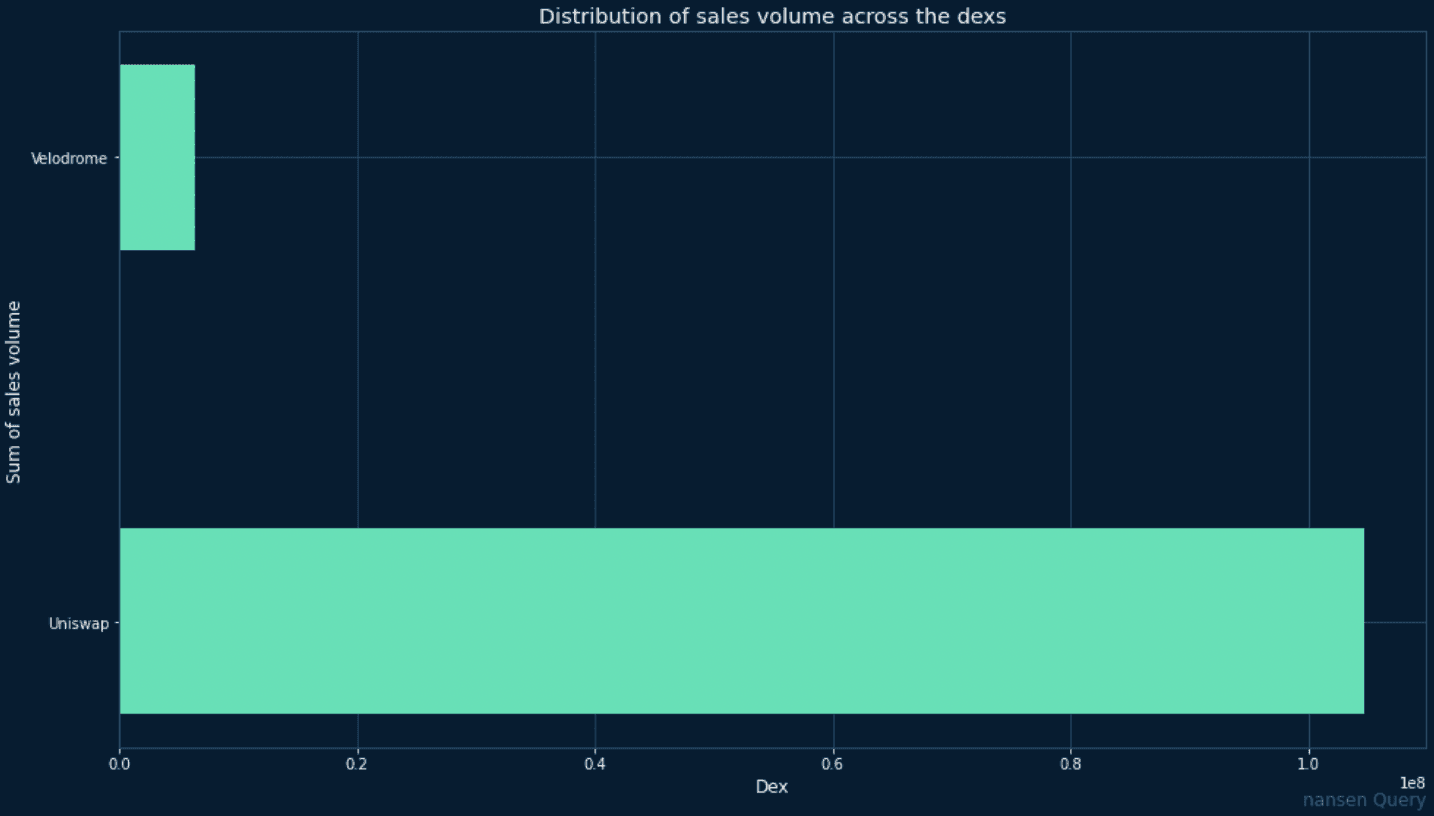
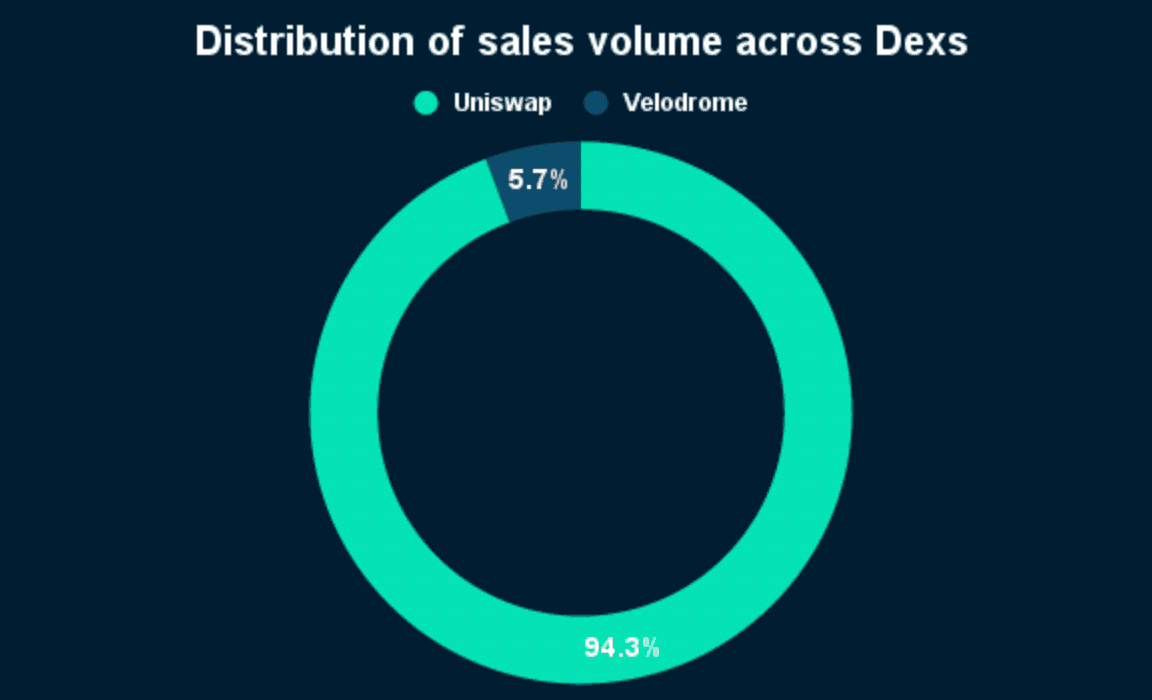
It can be seen that Uniswap took total volume sales of over 104m OP tokens while Velodrome took only around 6.3m.
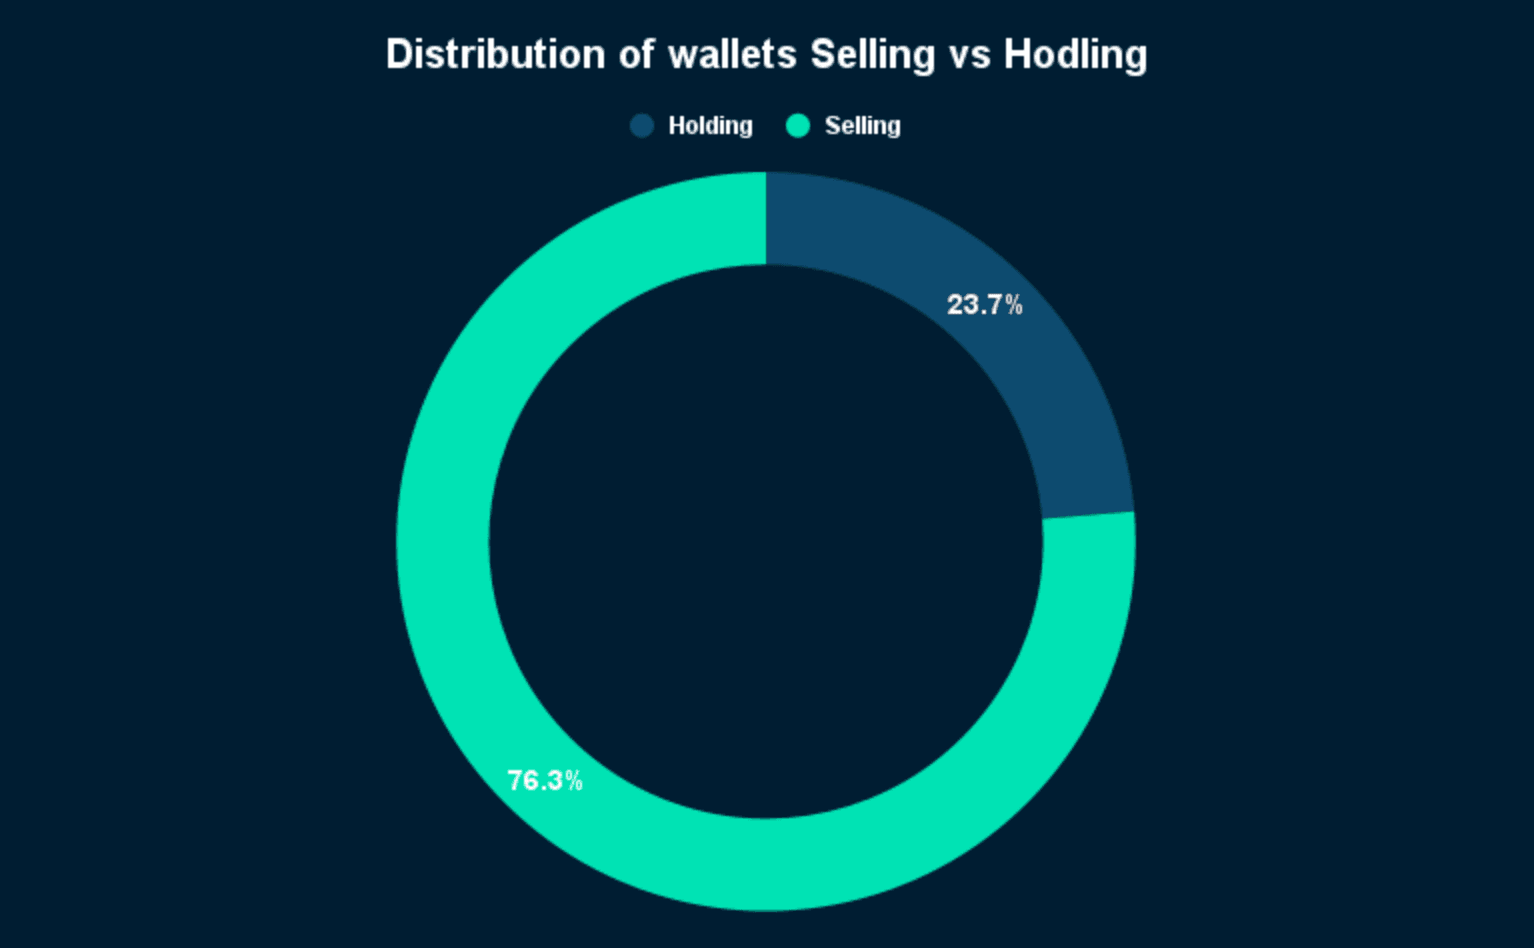
Furthermore, by aggregating all the ‘holding’ wallets (unique wallet addresses still holding on to their airdrops) and all the ‘selling’ wallet addresses (unique wallets that sold at least some amount in the DEXs covered) it is possible to get a picture of the number of wallets that hodl vs sold. It is important to highlight that there were a significant number of wallet addresses that received the airdrop that didn’t sell nor held their tokens. In other words, they transferred their token out of their wallets for a number of possible reasons, which we don’t delve into in this report.
There were a total of 18,042 unique wallet addresses belonging to the hodlers, while 58,193 unique wallets were attributed to the sellers. The chart below gives a breakdown of the distribution of unique wallet addresses hodling vs selling. It can be seen that a majority of the wallet addresses that received the airdrops have sold so far, over 76% to be more specific.
Top interacting labels
To understand the action of the various wallet addresses, investigating who they are could also be helpful. As a result, for each of the wallet addresses that hodled or sold, we tried to attach a Nansen label if it was available. This could highlight the type of wallet addresses most likely to sell and the ones most likely to hold. This would not just be useful information for projects aiming to distribute future airdrops but it could also potentially help individuals predict the price action of a token after an airdrop, as its demand and supply will be determined by the type of airdrop recipients in each case.
The following chart shows the top labels for the wallet addresses belonging to the hodlers.
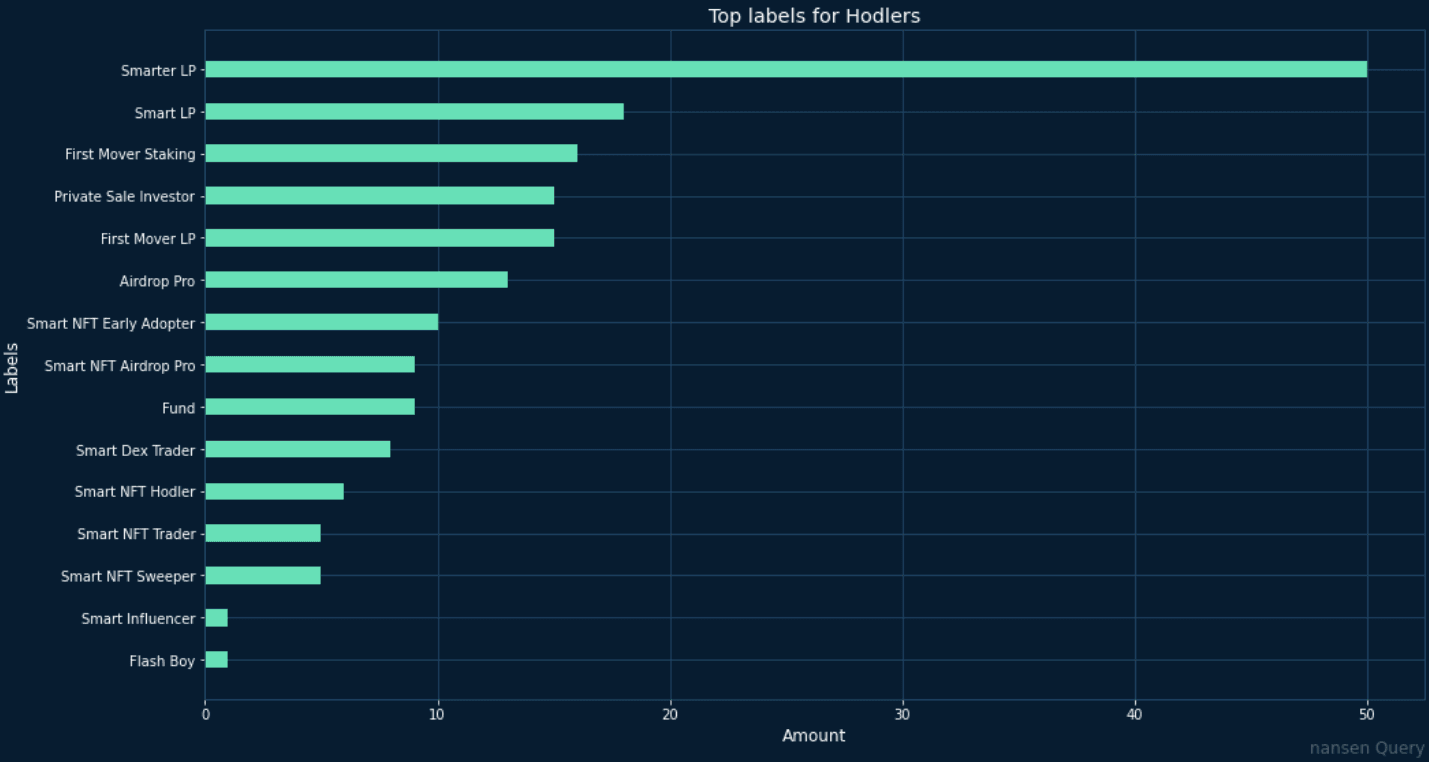
It can be seen that the labels for the top hodlers include Smarter LP, Smart LP, and First Mover Staking. Interestingly all three are related to providing liquidity and staking. The definition for each label is given below:
Smarter LP - Top 1% of addresses providing liquidity and mining liquidity by staking pool tokens on any Uniswap V2 type of DEX in terms of profit and ROI. Profit calculations include impermanent loss.
Smart LP - Made more than $100,000 providing liquidity and mining liquidity by staking pool tokens on Uniswap or SushiSwap. Profit calculations do not include permanent loss.
First Mover Staking - The top 200 addresses that have been the fastest to enter the most staking pools of a certain size. To be considered “first movers” in a given pool, they had to be among the first 100 addresses to enter it. The top 200 are ranked by the number of staking pools they have been “first movers” in.
This could imply that these wallets are holding onto their tokens as they are long-term believers of the project, or possibly in the hopes of using them to earn rewards from high-yield farms.
On the other hand, wallet addresses with the labels Smart Influencer and Flash Boy are the least likely to hold on to their tokens. It's interesting that many in the space criticize influencers for having weak hands, and when compared to other labeled wallets, the criticism seems to be supported by the data.
Finding Flash Boy labeled wallets at the bottom of the list is not that surprising as well. Flash Boys are wallets that have made multiple dex trades in a single transaction that are profitable in nature, as a result, these types of wallets are more interested in short-term trades and making quick profits.
The following chart shows the top labels for the wallet addresses belonging to the sellers.
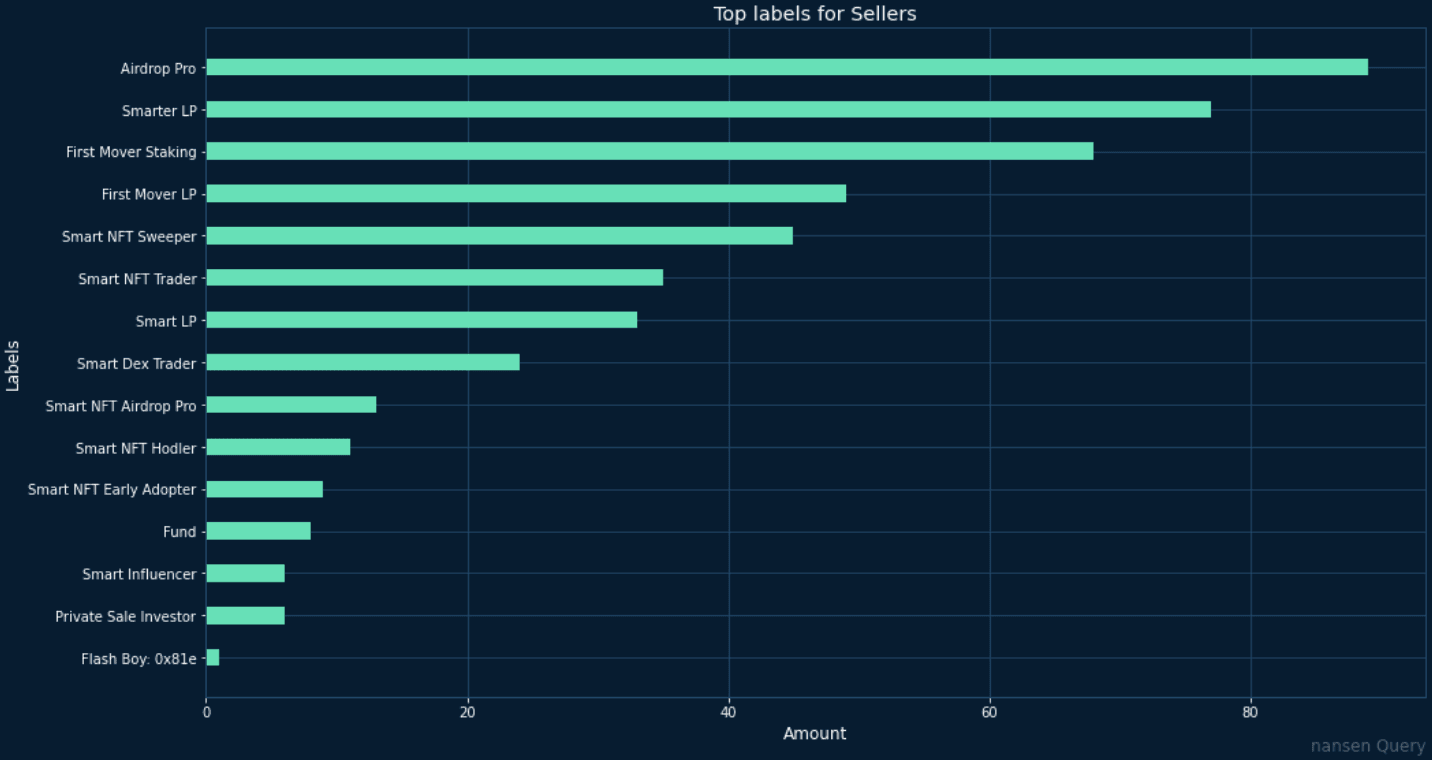
The chart shows that Airdrop Pro labeled wallets were the top labeled wallets to sell their tokens.
This is however expected as Airdrop Pro labeled wallets are wallets that have been proven to make the most profits from airdrop tokens.
Surprisingly, Smarter LP and First Mover Staking wallets have also made it into the top three positions in this chart contradicting the earlier findings. As a result, a deeper look into the percentage breakdown of those specific labeled wallets was undertaken. From this analysis, it was found that out of the total number of Smarter LP labeled wallets in the dataset (hodling + selling), 60.6% are sellers while 39.3% are hodlers. For First Mover Staking the numbers were 81% selling compared to 19% hodling.
Furthermore, Funds and Private Sale Investor labeled wallets were the least represented wallets for selling airdrops.
Funds - Public entity that invests and manages money in crypto.
Private Sale Investor - Addresses that have received at least $100,000 from investor distributor addresses across a significant number of different tokens.
Finding the Funds and Private Sale Investor at the bottom of the list is also not that surprising, as their expected ROI spans over a longer period of time compared to a lot of other labeled wallets. The Smart Influencer labeled wallets in this position, however, contradicts the results from the hodlers chart (which suggested that Smart Influencers were the least likely to hold on to their tokens). By looking at that segment more closely (Smart Influencers that sold + hodled), it was also found that 85.7% of Smart Influencers sold compared to 14.3% that hodled. As a result, it can be suggested that the Smart Influencer label is overwhelmingly associated with selling rather than hodling airdrops.
Project Airdrops
By analyzing the on-chain activities of the projects that received the airdrop (as outlined in the methodology section), it was possible to distinguish between projects that held on to their airdrops vs those that directly sold their tokens. There was also a third category of projects which transferred the tokens that they received out from the receiving wallet address. This could be for various reasons, but one of the main ones is to distribute the tokens to their most active users, in order to incentivize activity on their projects (on the Optimism network). The analysis didn’t focus on such transactions, rather it tried to identify projects that sold the airdrops straightaway, signaling that such projects didn’t have a long-term interest in Optimism or were more interested in making a quick profit.
The table below shows the breakdown of the Projects that sold vs the ones that are still holding on to their tokens.
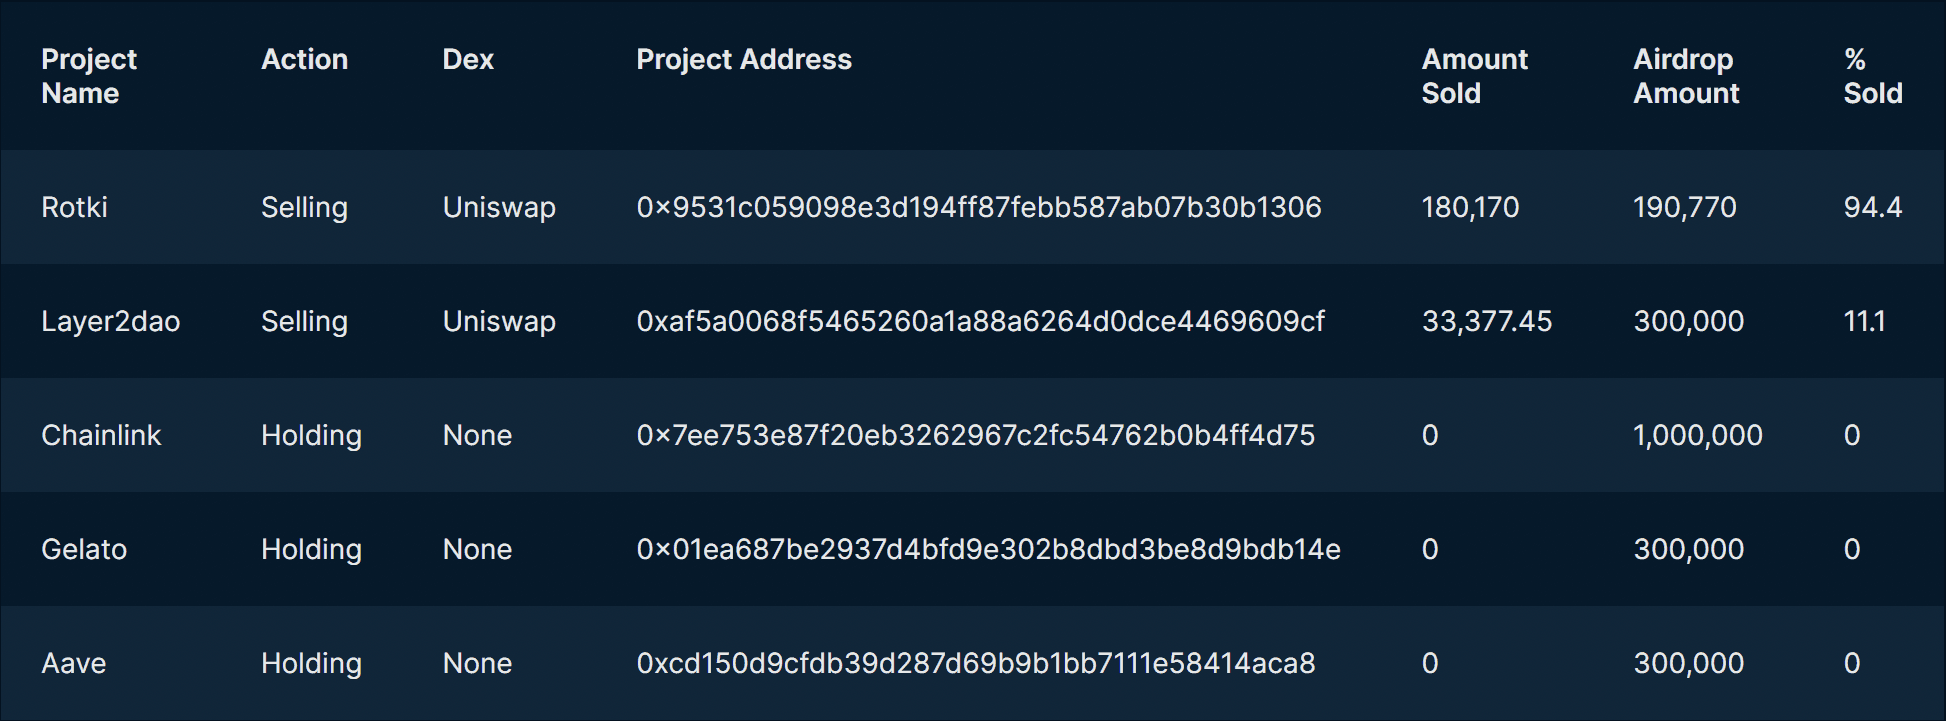
It can be seen that, unlike the individual users that received the airdrops, a significant majority of the projects haven’t directly sold their tokens on the DEXs covered. The sale transaction of only two projects was captured, Rotki and Layer2Dao. Interestingly, as shown by the table, there was only one project which sold a significant amount of the airdrops received (94.4%). The project in second position for the most amounts of tokens sold dumped only 11.1% out of the total amount received. This suggests that the interest of the majority of projects that were early to deploy on the chain aligns with the interest of the Optimism network.
Takeaway
- Over 76% of wallet address that received the airdrops have been selling their OP tokens.
- Uniswap dominates as the most active exchange on the chain for the OP token. Only 5.7% of the OP token sales across the Dexs covered were executed on Velodrome. Uniswap took the rest (94.3%).
- The top labels for hodlers (among users that received the airdrop) include Smarter LP, Smart LP, and First Mover Staking. Interestingly all three are related to providing liquidity and staking.
- Wallet addresses with the labels Smart Influencer and Flash Boy are the least likely to hold on to their tokens.
- Airdrop Pro labeled wallets were the top labeled wallets to sell their tokens.
- Smarter LP and First Mover Staking wallets have also made it to the top three positions for top sellers.
- It was found that out of the total number of Smarter LP labeled wallets in the dataset (hodling + selling), 60.6% are sellers while 39.3% are hodlers. For First Mover Staking the numbers were 81% selling compared to 19% hodling.
- Furthermore, Funds and Private Sale Investor labeled wallets were the least represented wallets for selling airdrops.
- It was also found that 85.7% of Smart Influencers sold compared to 14.3% that hodled. As a result, it can be suggested that the Smart Influencer label is overwhelmingly associated with selling rather than hodling.
- Unlike the individual users that received the airdrops, a significant majority of the projects haven’t directly sold their tokens.
- Only two projects sold from all the ones covered in the analysis. Only one project sold a significant amount of the airdrops received (94.4%). The project in second position for the most amounts of tokens sold dumped only 11.1% out of the total amount received.
- This suggests that the interest of most projects aligns with the interest of the Optimism network. The projects that are already deployed on the network are more likely to have a long-term interest in Optimism.