
In this note, we will go through regional growth divergences and how these impact traditional assets such as currencies and equities. We will analyze central banks’ likely next steps, and review cryptocurrency tactical indicators after the weekend’s price pump.
China and global demand
Chinese economic data mostly beat economists’ expectations for September: retail sales came at 5.5% YoY (vs 4.9% YoY expected, and up from 4.6% YoY in August). This and earlier data from the Golden Week paint a picture of a recovering consumption, especially for domestic services.
However, Mainland and Hong Kong equity markets were among the worst regional equity performers week-on-week, down by close to 4% (the week the data was released).
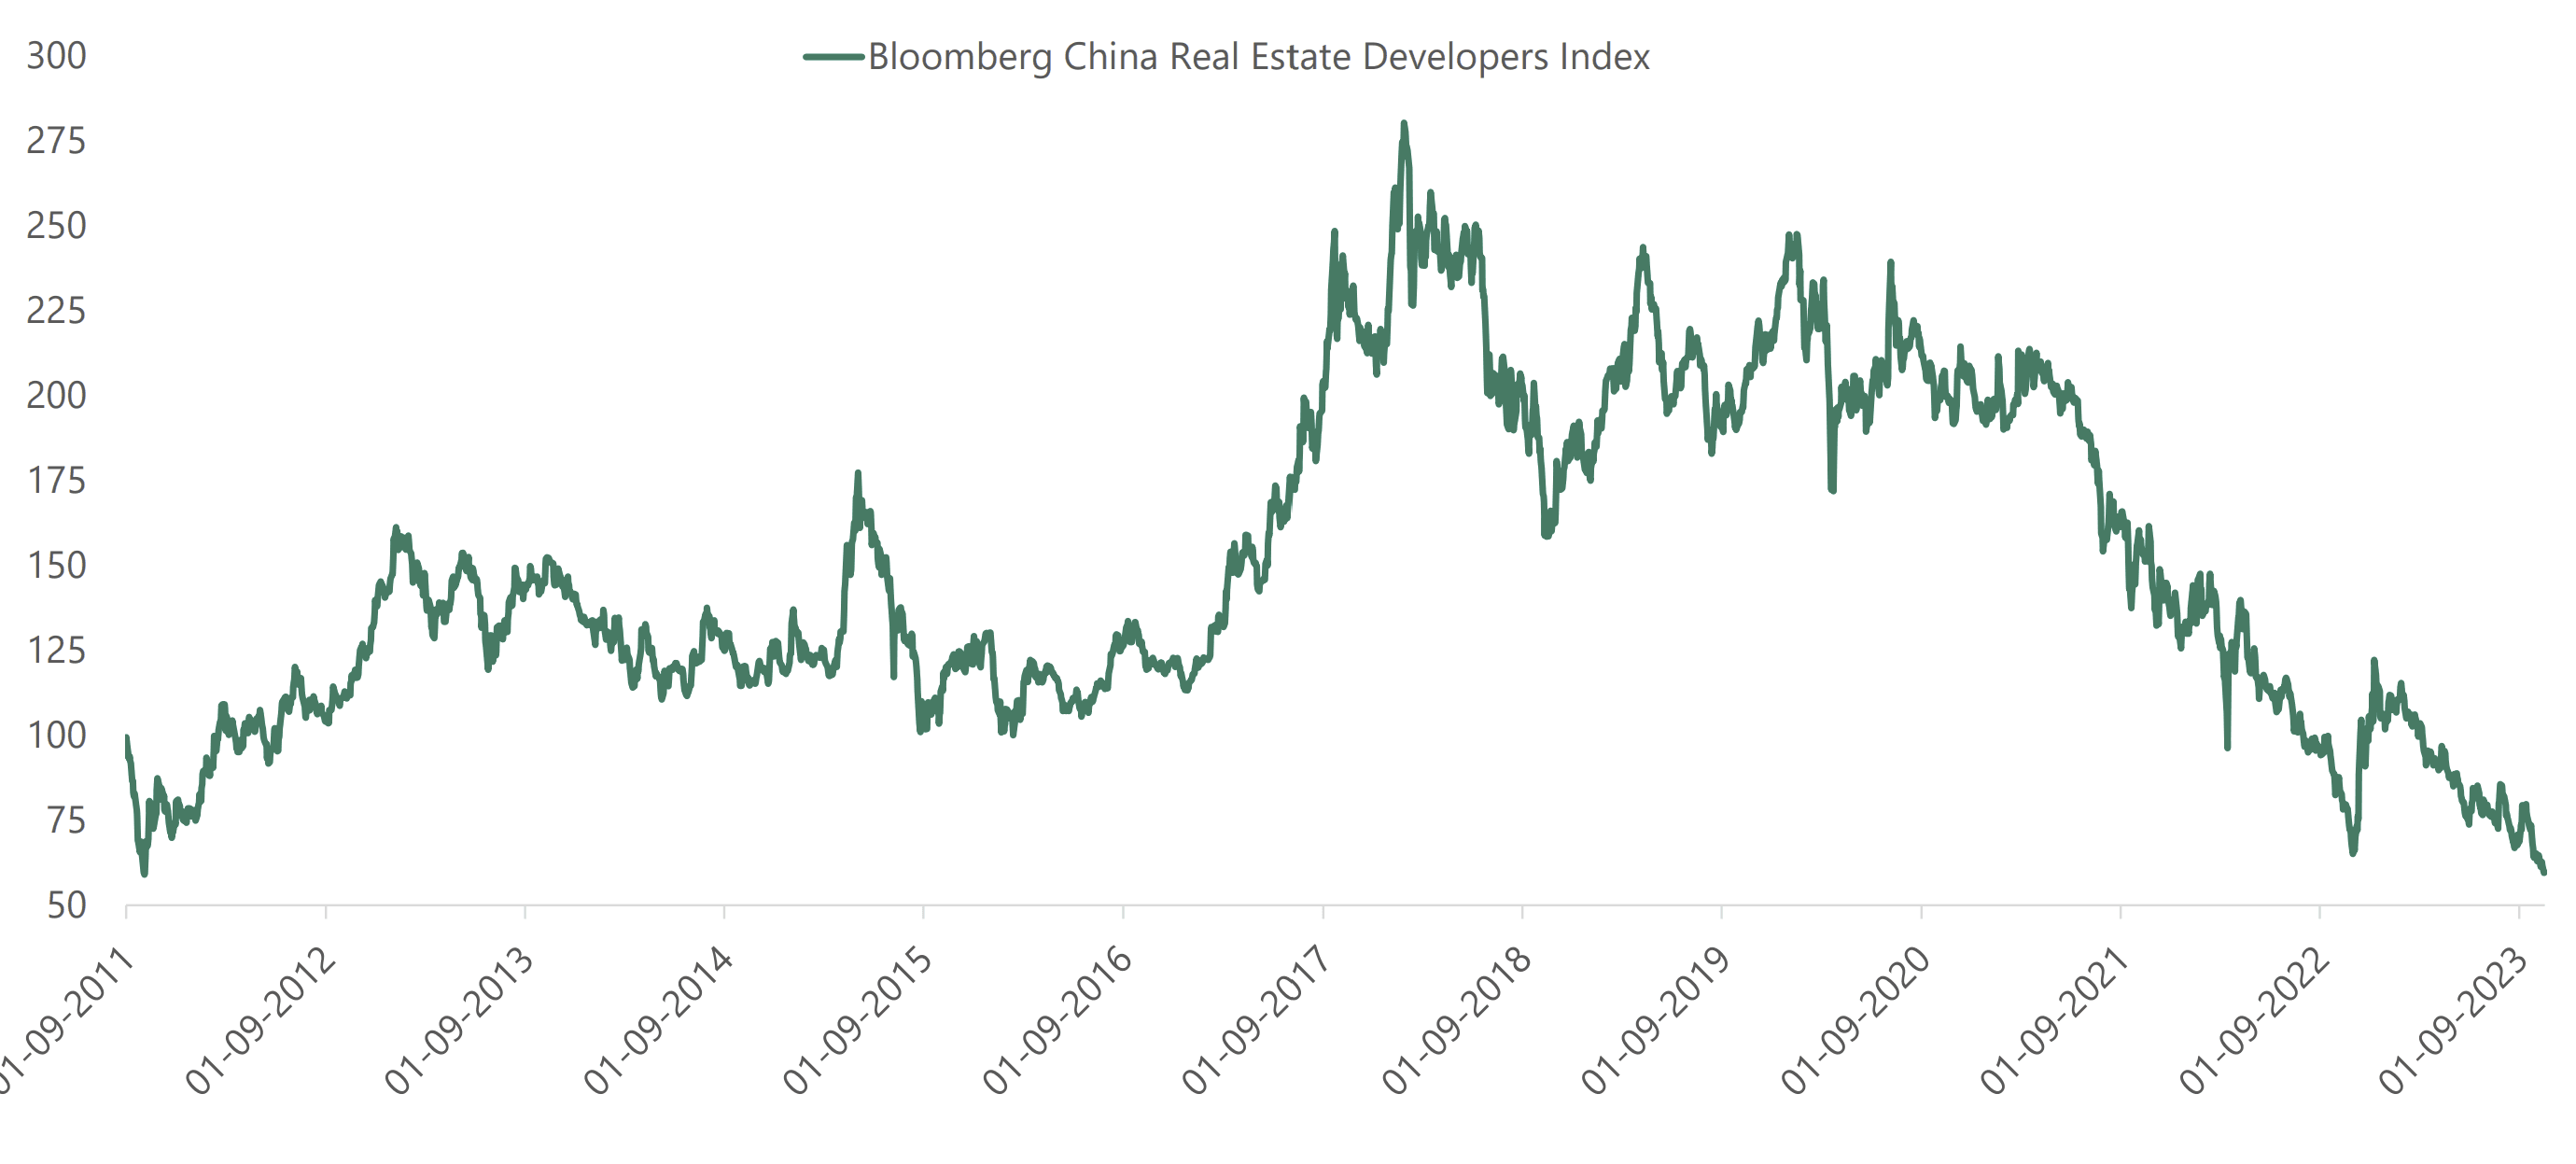
We conjecture that two major structural issues are still in the way of Chinese assets’ performance: first, the property sector debt overhang (property has played a leading role in Chinese growth since 2009) and second, ongoing geopolitical escalation with the US. Last week, China introduced export controls on graphite, an input in electric vehicle battery manufacturing. This was in retaliation for the US imposing restrictions on exports of AI chips. US stocks such as Nvidia fell 9% week-on-week, with the latter stock being on the way to completing a technical head & shoulder (bearish technical) pattern.
Interestingly, the weakness of Chinese good demand has started to propagate to the rest of the world. We flagged that International Luxury company stocks such as LVMH and Hermes were rolling over in prior publications. The Swiss equity index SMI was the worst-performing regional index last week (down almost 6%) with the industrial power and technology group ABB leading the losses. ABB flagged some stabilization in Chinese orders, but expected a slow growth for global orders in 2024 (earnings release).
All of these market and macro developments point to a few key messages. Chinese domestic demand is improving, but slowly, with the outlook still clouded by the real estate bubble deflation and by geopolitical frictions with the US. And also, global growth is clearly on a slowing trajectory.
US vs the rest of the world, and the US dollar
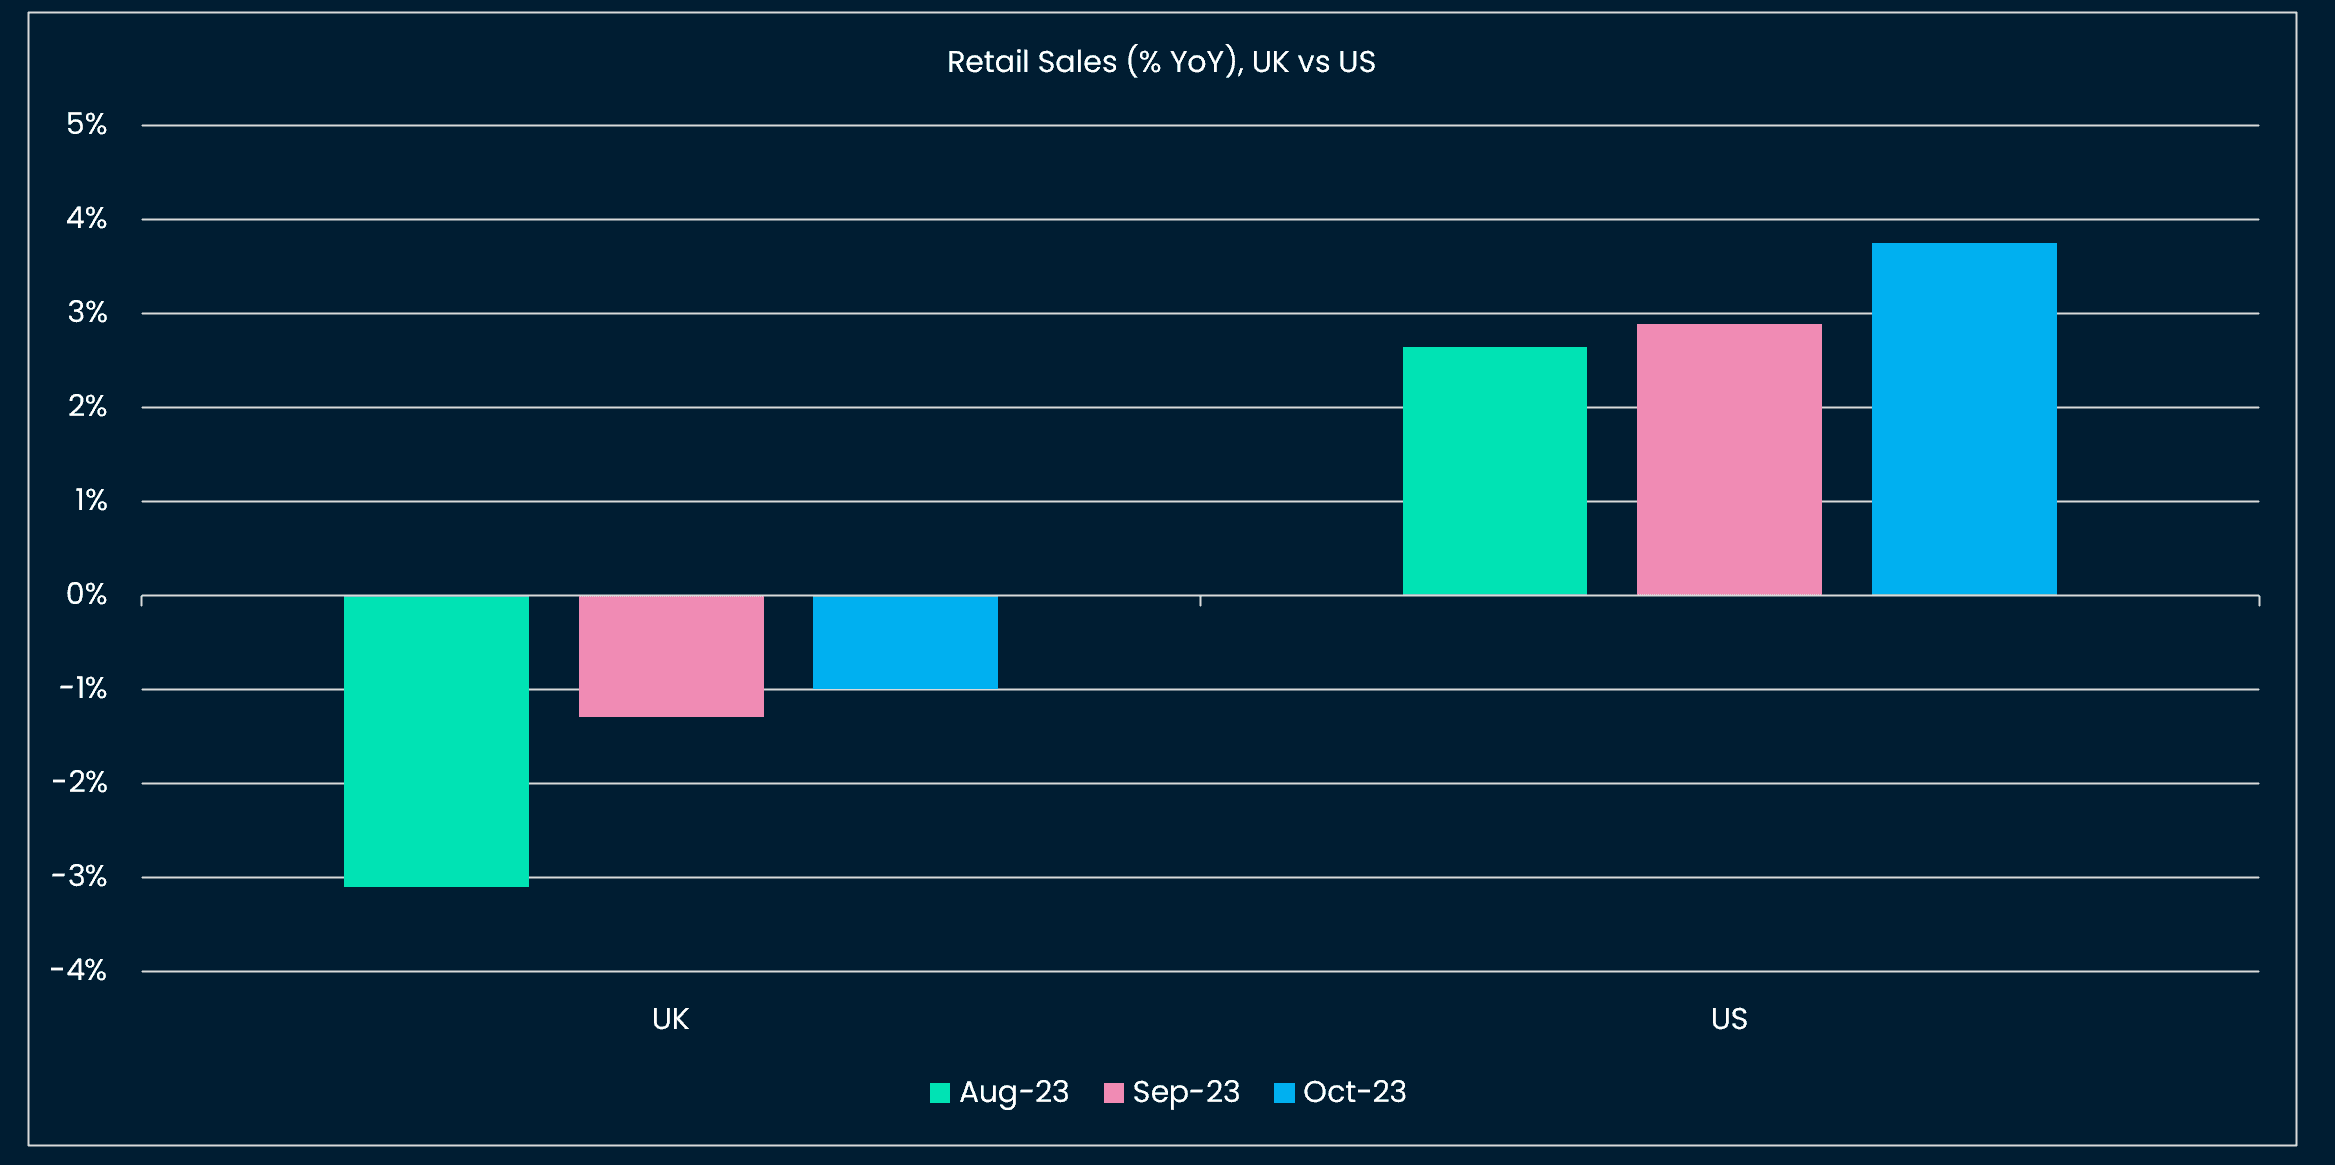
In a context of weaker global growth, the US continues to fare better than the rest of the world. This is especially obvious when considering US vs UK data: UK retail sales have been contracting (even in nominal terms) in the past few months vs ongoing beats of expectations for US retail sales.
Inflation appears stickier in the UK too (average earnings/wage growth close to 8% YoY) which makes for a “stagflationary” situation that prevents the Bank of England to rise interest rates too fast (as a result the real rate e.g. policy rate - inflation remains negative).
This divergence between the US and the UK will likely continue to weigh on the GBP/USD. We note that the picture has become more ambiguous for the EUR/USD, because German data (the ZEW last week) has had a streak of positive surprises. Last week 10yr yields rose across the Atlantic, with the leadership still held by the US: US 10yr yield +26bps > German 10yr yields +20bps > UK 10yr yield +18bps.
The Fed’s next steps
Last week, quite a few FOMC voting members were on the wire, with two hawkish defenders of an incremental rate hike (Waller and Bowman).
The most important speech was delivered by Fed Chair Powell, of course. The Fed Chair had penciled in a further rate hike in the Summary of Economic Projections published during the September FOMC meeting. However, Powell’s intervention at the Economic Club of New York last week pointed to more dovishness, first in acknowledging the progress made on desinflation (more heartily than in his prior speeches) “12m core PCE inflation peaked at 5.7% in February 2022, and is estimated at 3.7% through September, so clear progress there [...] a very favorable development”, and then by giving the following interpretation of the recent increase in long-term US Treasury yields: “it is happening in term premiums [...] and not principally about the market looking at short-term rates. [...] It does not seem to be principally about expectations of us doing more”. By pointing towards the “term premium” as the main driver of higher yields, the Fed chair suggested no impetus for the Fed to hike more as financing conditions are tightening without the Fed having to do more.
Future markets’ pricing for an additional rate hike came down from 32% to 20% for December 2023 after Powell’s speech.
US economy and markets in 2024
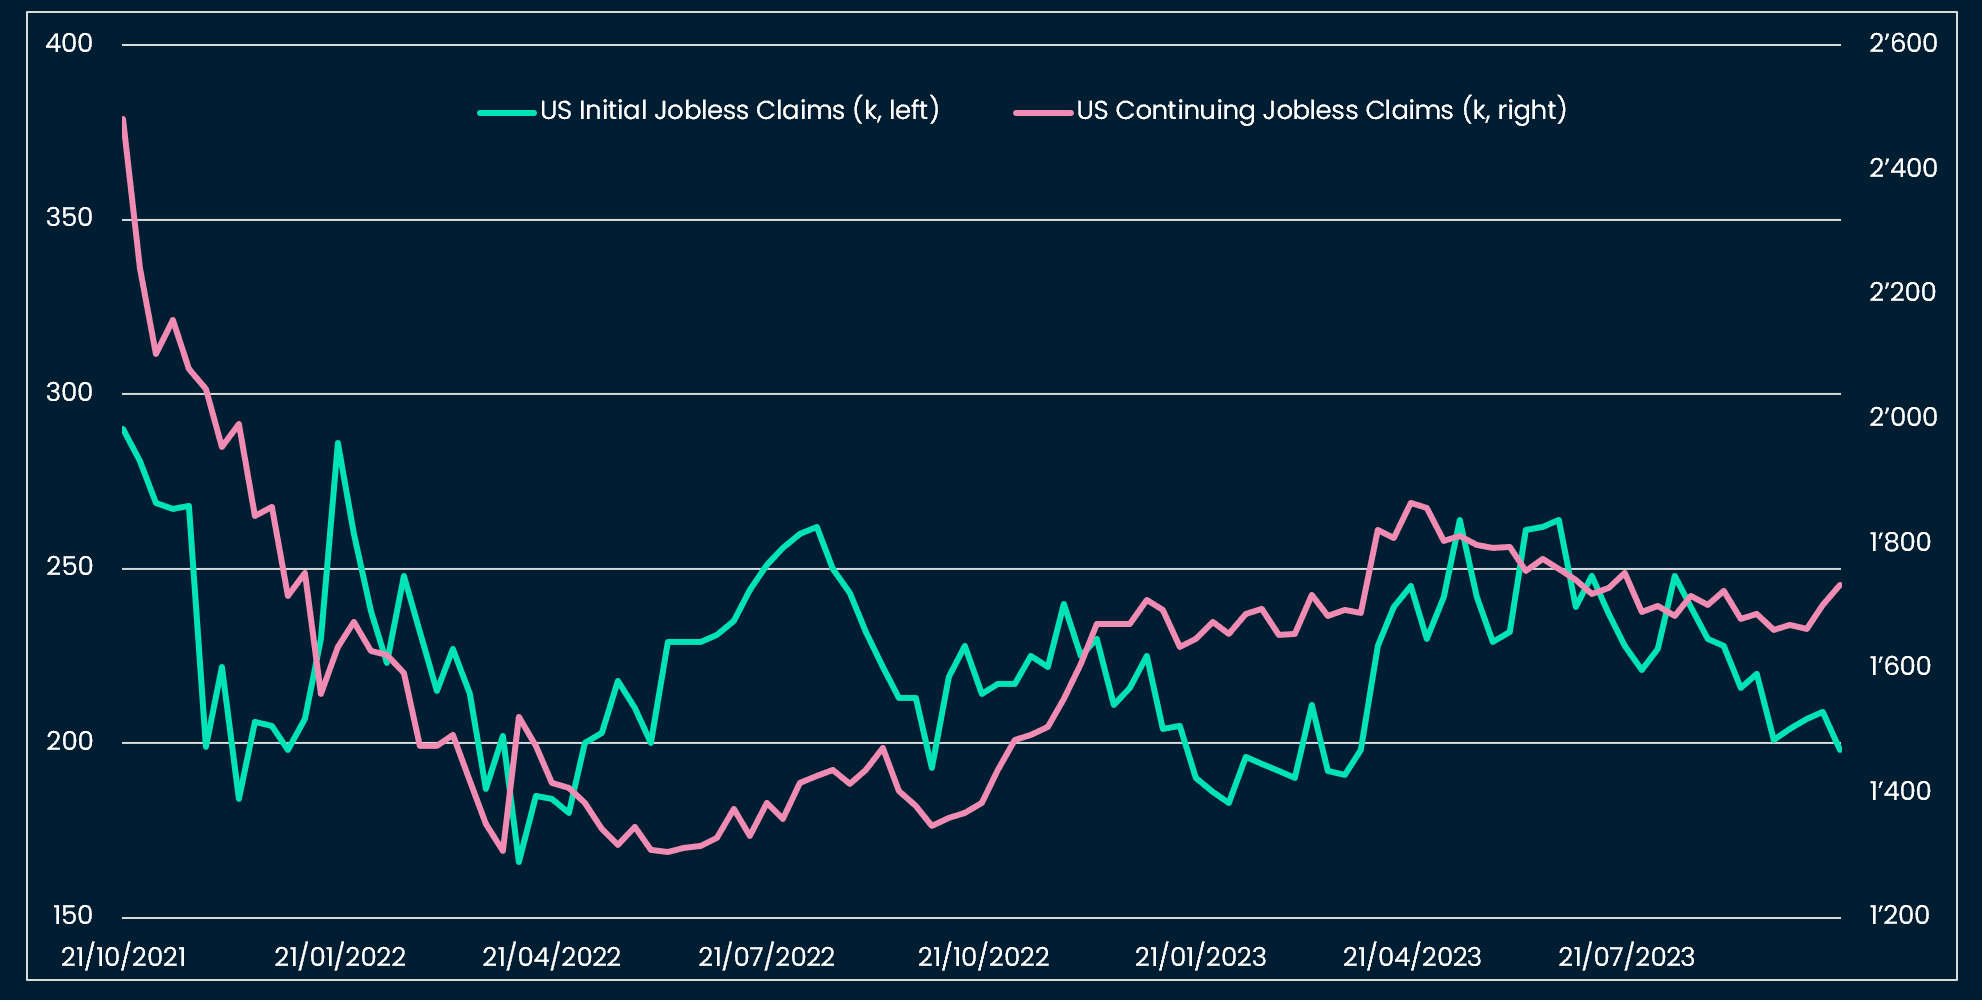
Even in the absence of an incremental rate hike, rates are projected to stay “high for long” in the US. The labor market still paints a solid picture of the US economy. Interestingly initial jobless claims have remained close to cyclical lows while jobless claims are slowly increasing, suggesting that the flow of newly unemployed people remains historically modest, but that unemployed people need more time to find a new job.
Meanwhile there are signs that fiscal spending is becoming slightly less of a tailwind for the US economy into 2024 (student debt payments plus other social benefits expiring). The US Federal deficit was 4% of GDP in FY22 and is estimated at 7.6% of GDP in 2023. 2024 will probably be the year of tighter fiscal policy, but, as it is also an election year, it is unlikely that the incumbent administration will let fiscal policy become a big headwind for the economy. President Biden just requested another USD 105bn or ~0.4% of GDP for military financing in the Ukraine and Israel conflicts.
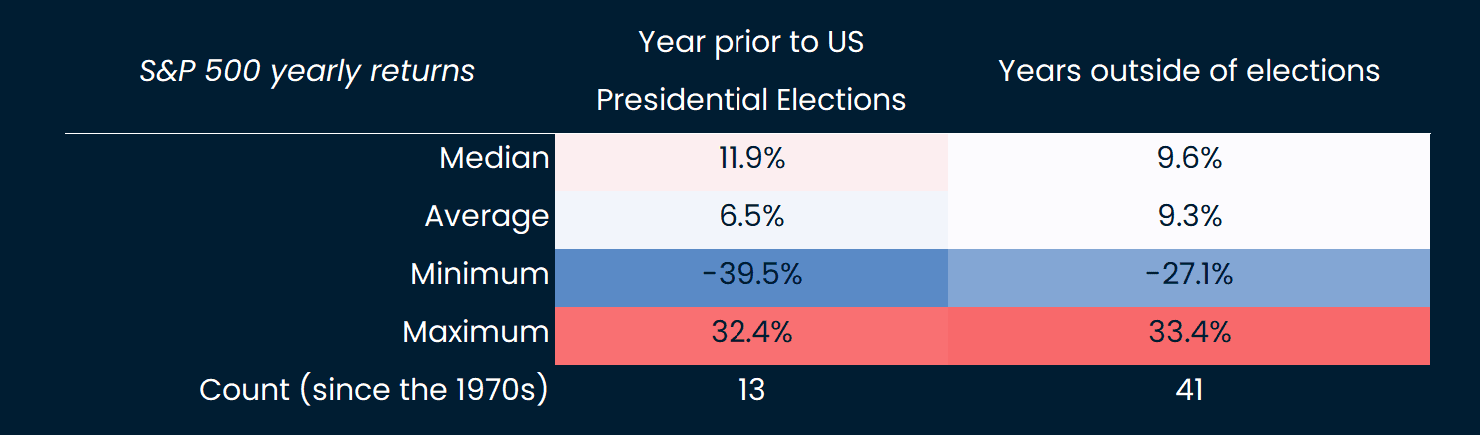
We conducted a historical study comparing the annual return of the S&P 500 in the year preceding Presidential elections vs other years. The median annual return prior to elections is superior, but the average and max drawdowns are weaker. This is partly due to one of the election years in our historical sample having occurred during the global financial crisis.
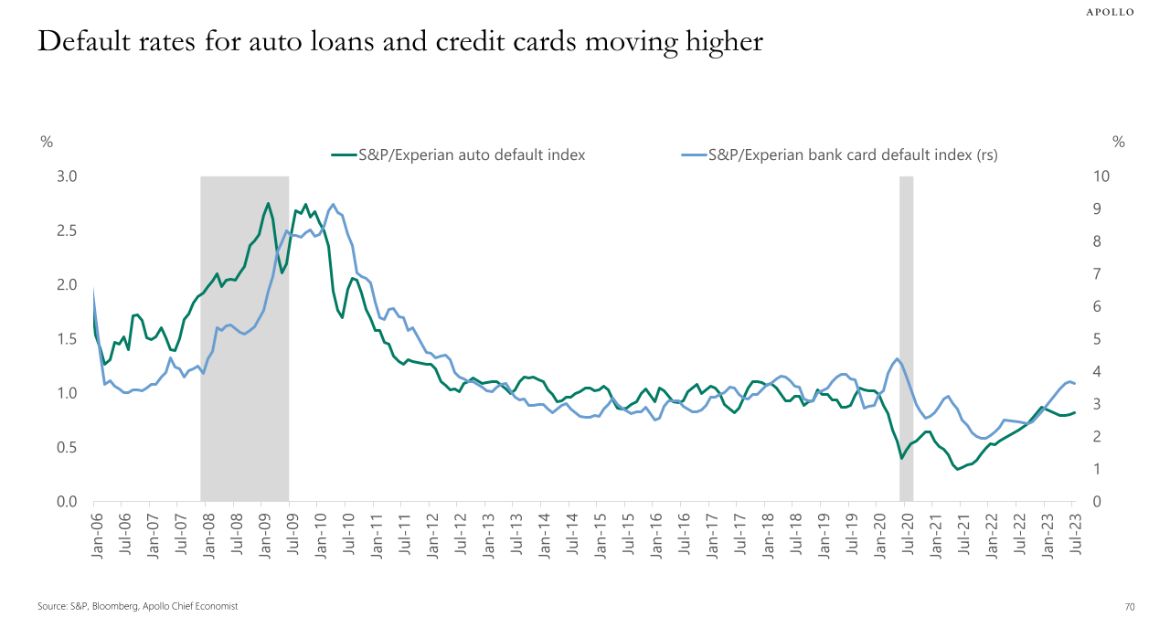
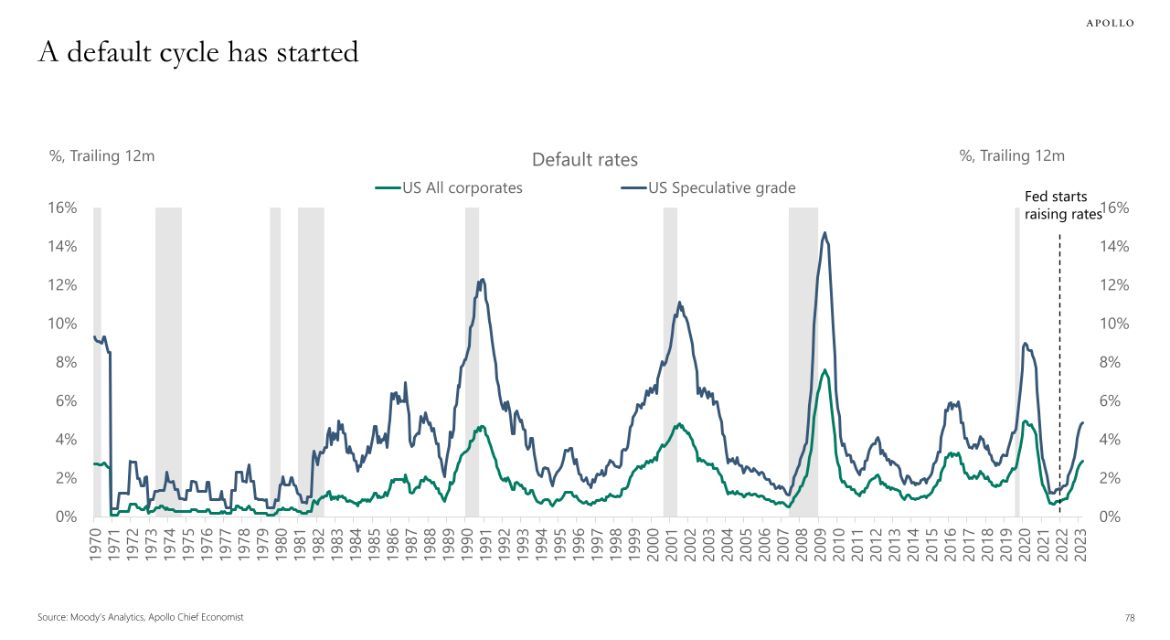
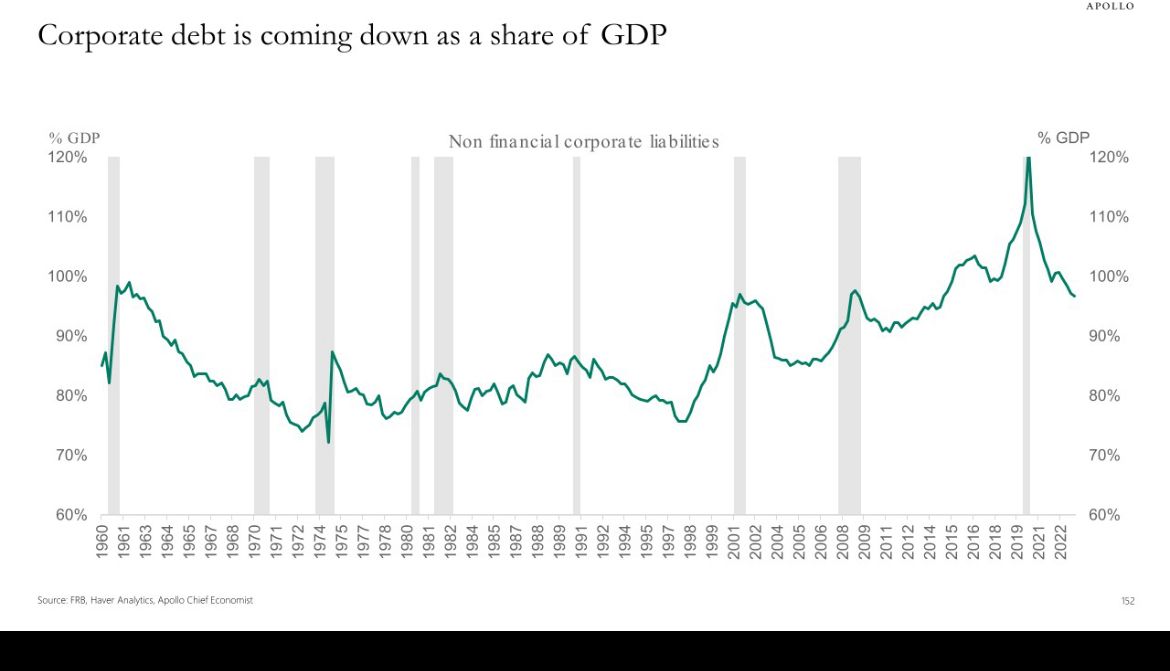
We think that the US is experiencing a “boiling frog” situation. Interest rates are at restrictive levels for borrowing, and default rates are creeping higher (still not at recessionary levels) and there are signs of increasing distress in some areas of consumer loans. However, both corporates and households have entered this period of high interest rates with relatively strong balance sheets (see below). To put in another way, the frog has a thicker skin this time, and is taking a bit more time to cook.
US Treasury curve steepening
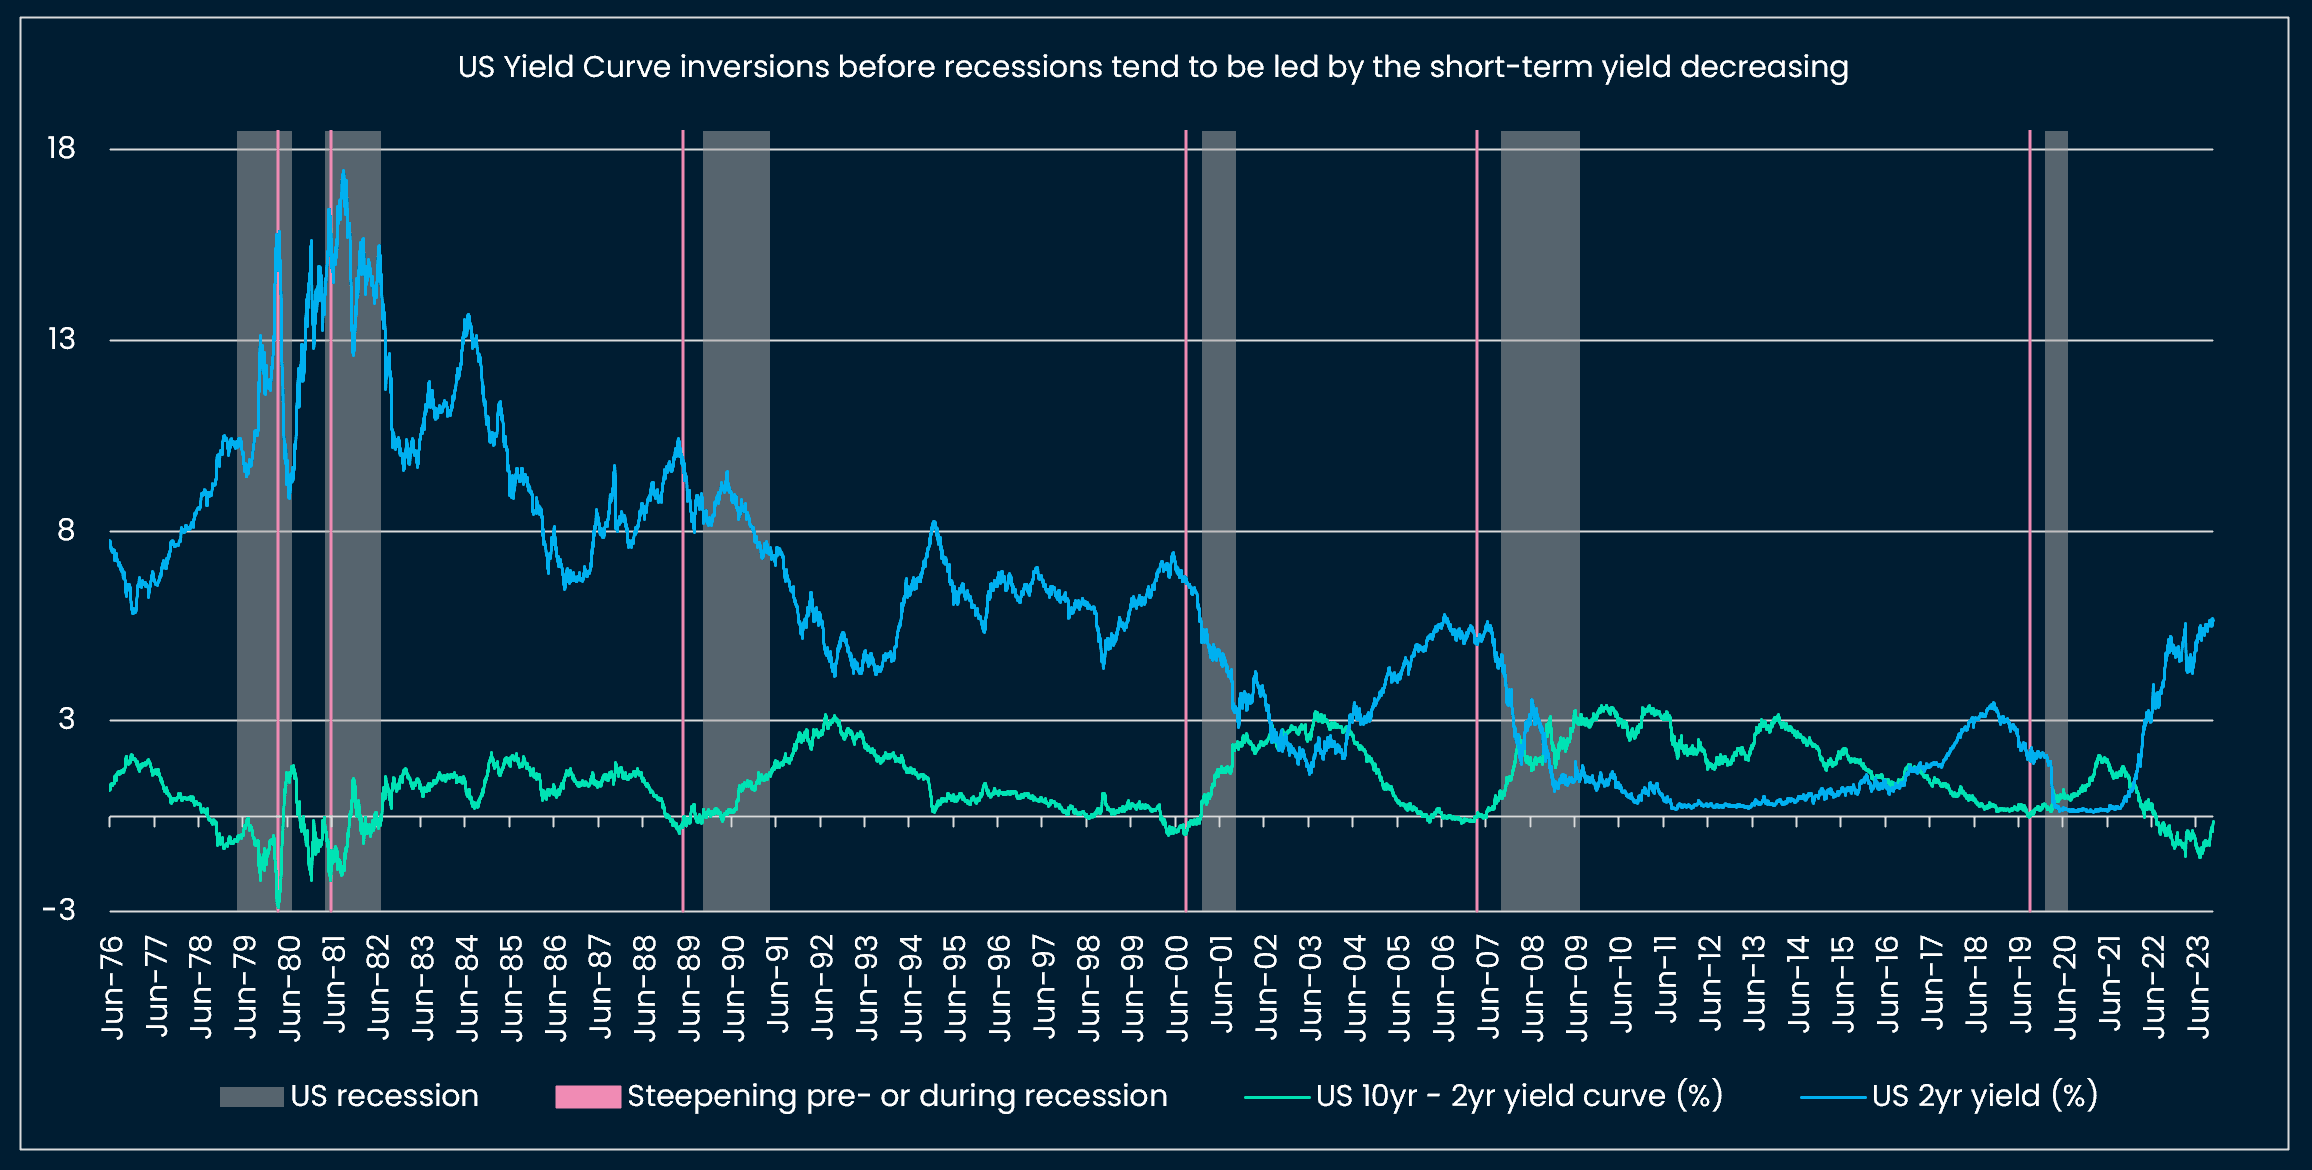
We turn to the recent steepening in the US Treasury curve, as some have argued that it was the sign of an imminent recession. Interestingly, we find that the steepenings that historically preceded recessions came from the lower-duration yield going lower. Recently, we have seen the long-end e.g. US 10yr yield, moving higher, but the US 2 yr Treasury yield has not decreased.
The equity sell-off will likely take a breather in the short-term as markets move away from geopolitical fears (Israel conflict). At the same time we are concerned longer-term by some technical patterns e.g, signs of double tops in major indices like the S&P 500 and sector leadership, with the laggards being the US Consumer Discretionary sector, pointing again, towards lower growth.
Crypto assets
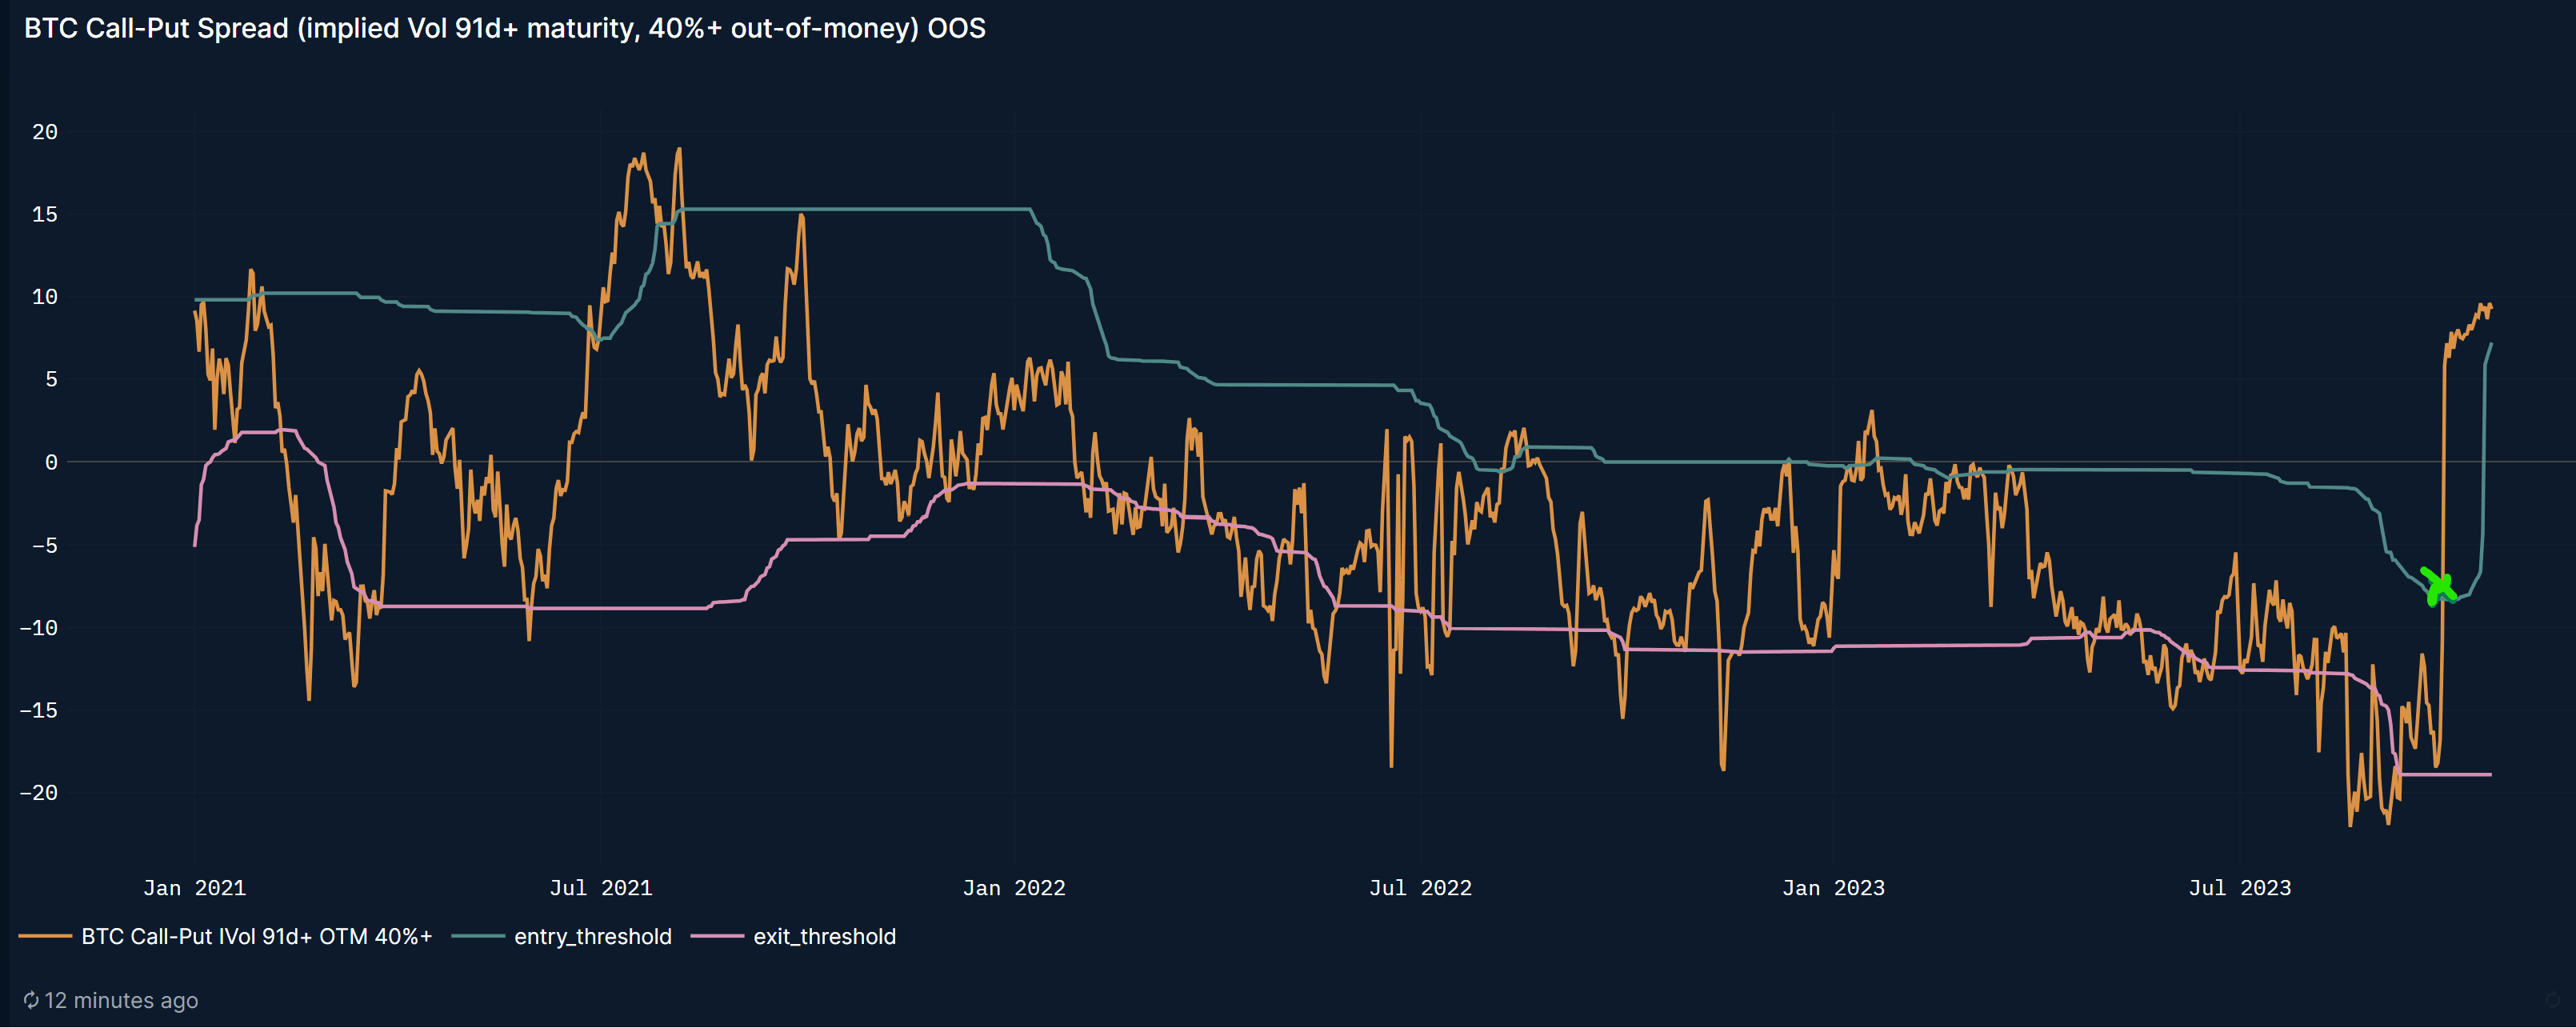
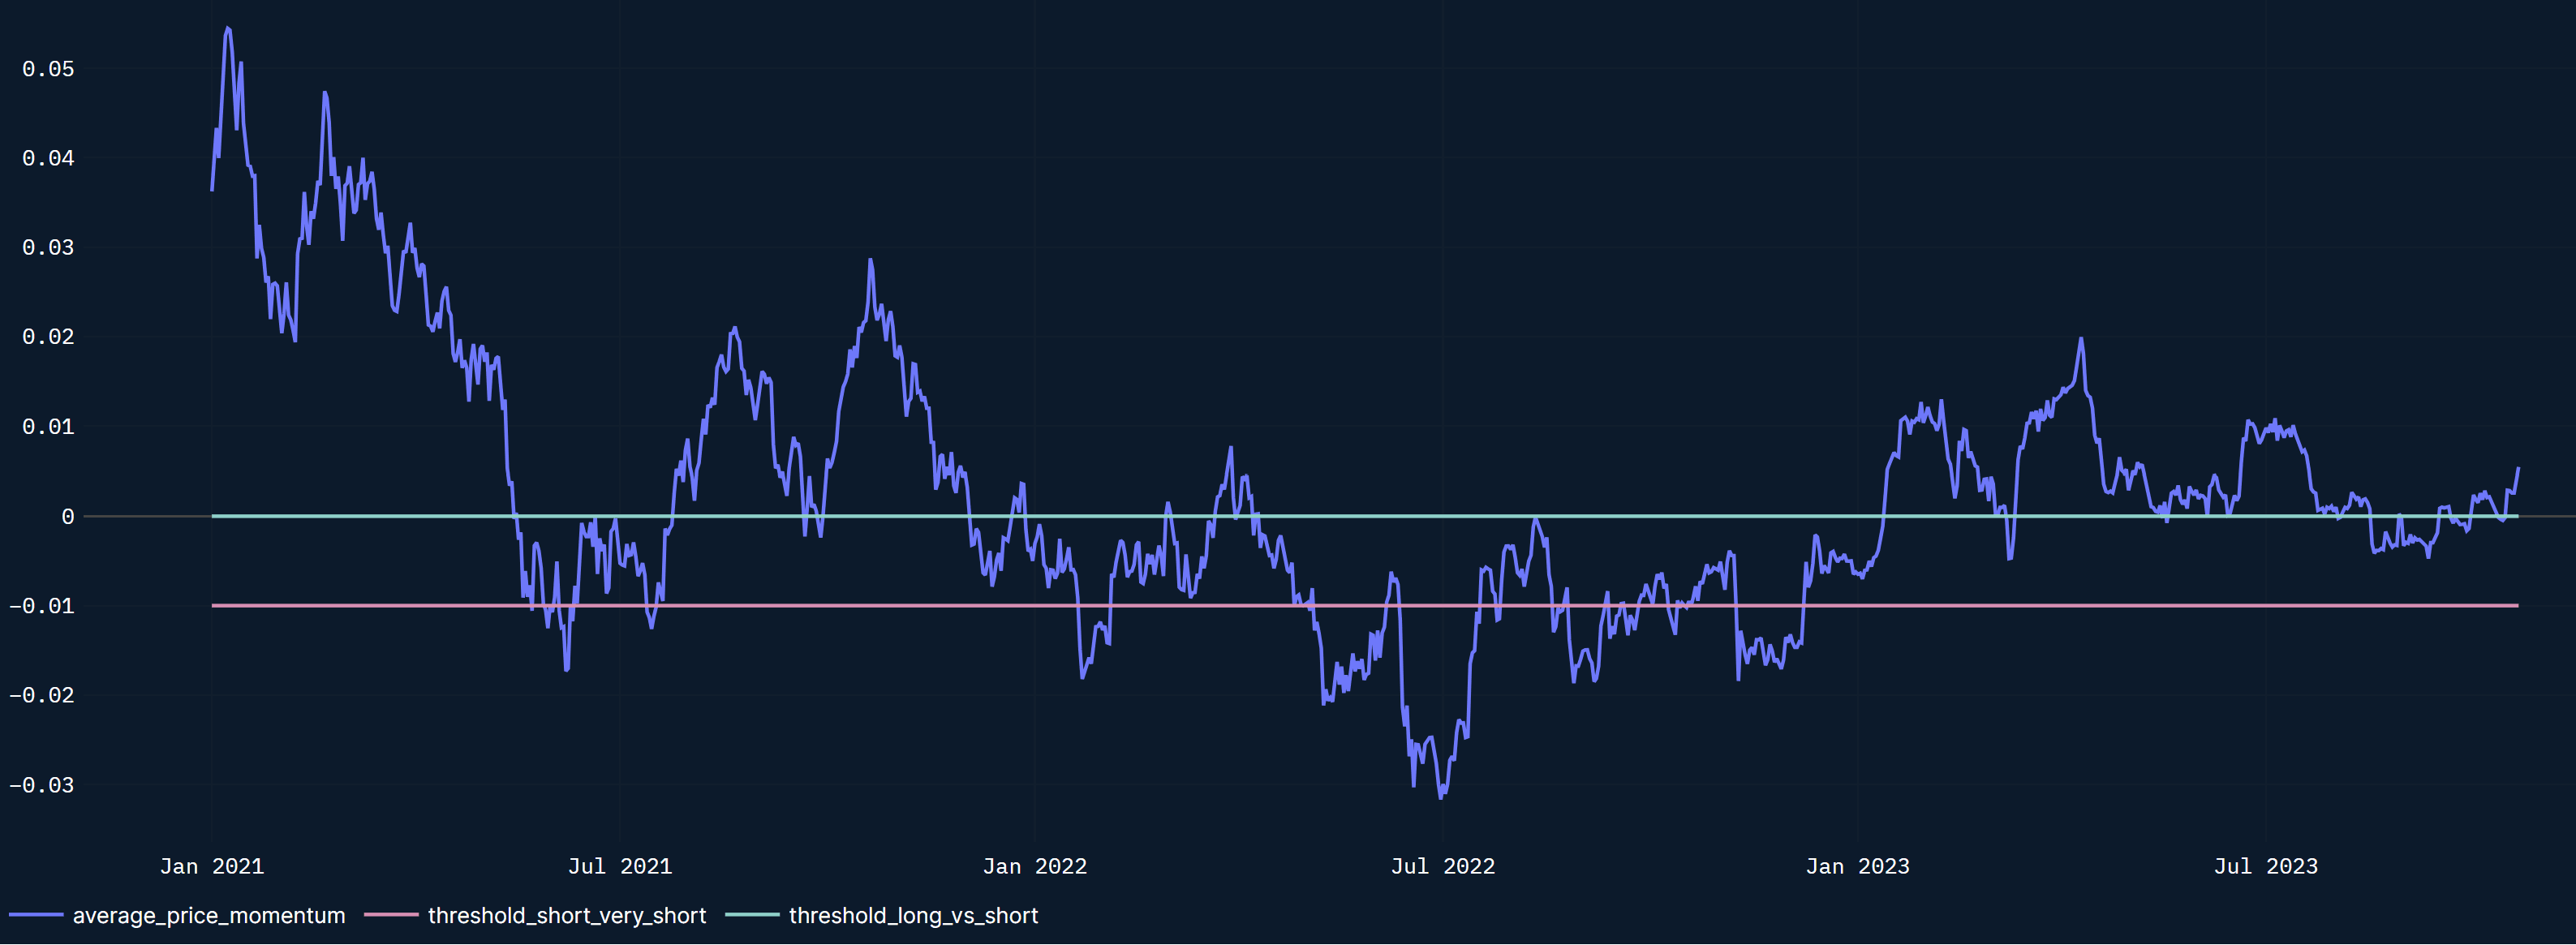
Crypto asset prices are “living a life of their own” recently, separate from equities. Two of our tactical indicators turned bullish on September 29 (BTC call-put spread) and October 16 (BTC Momentum indicator), and remain in bullish territory as we write.
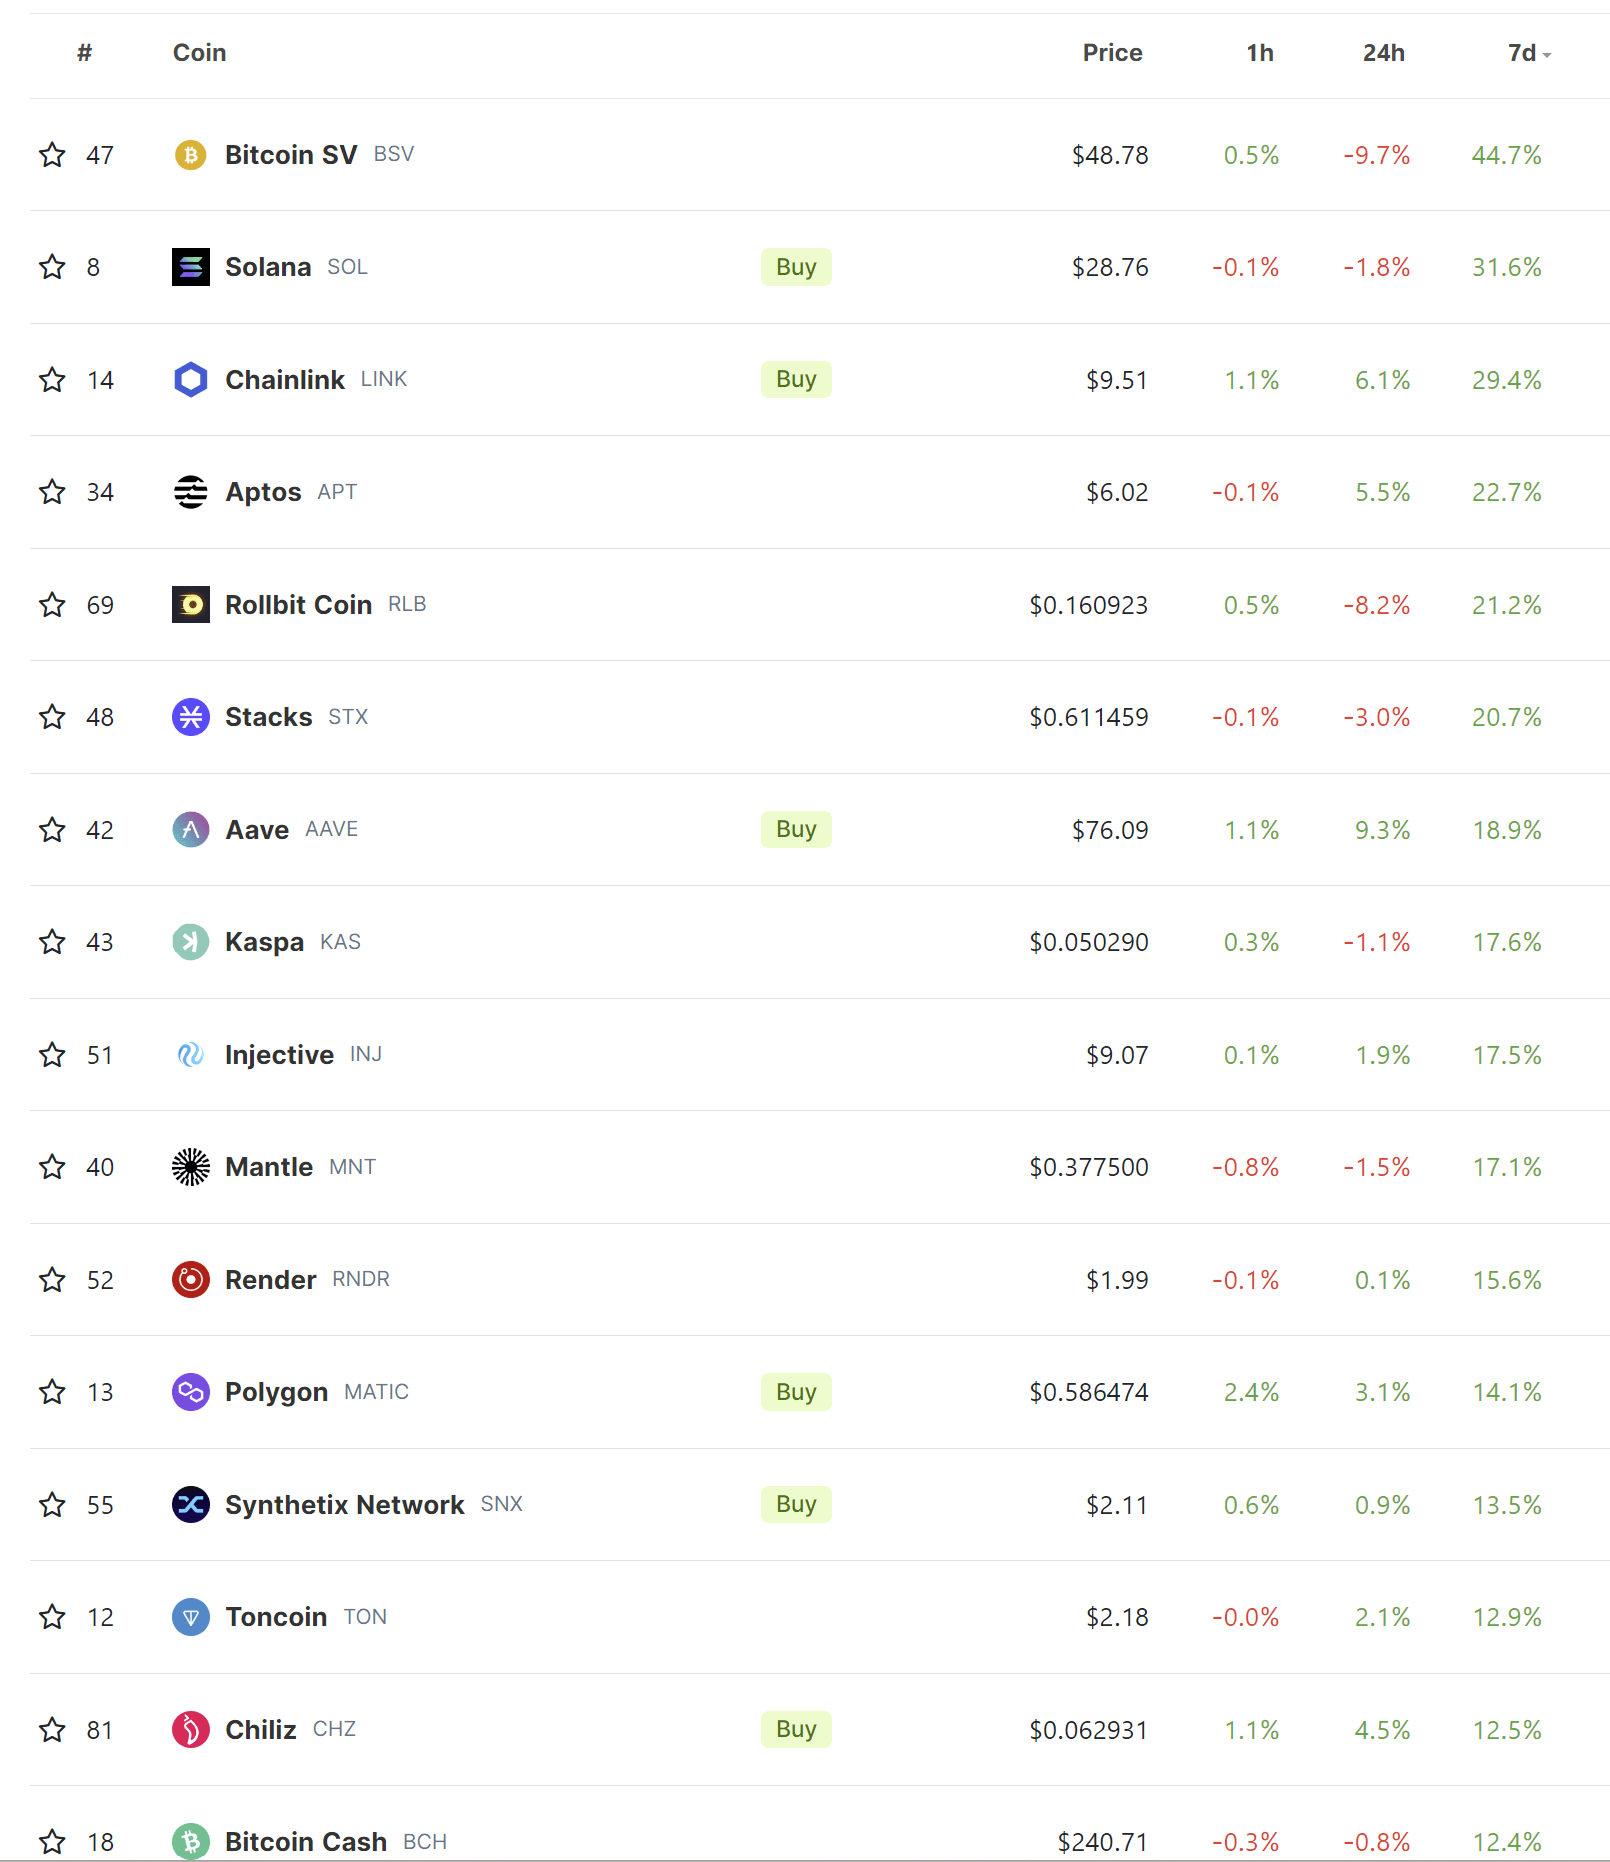
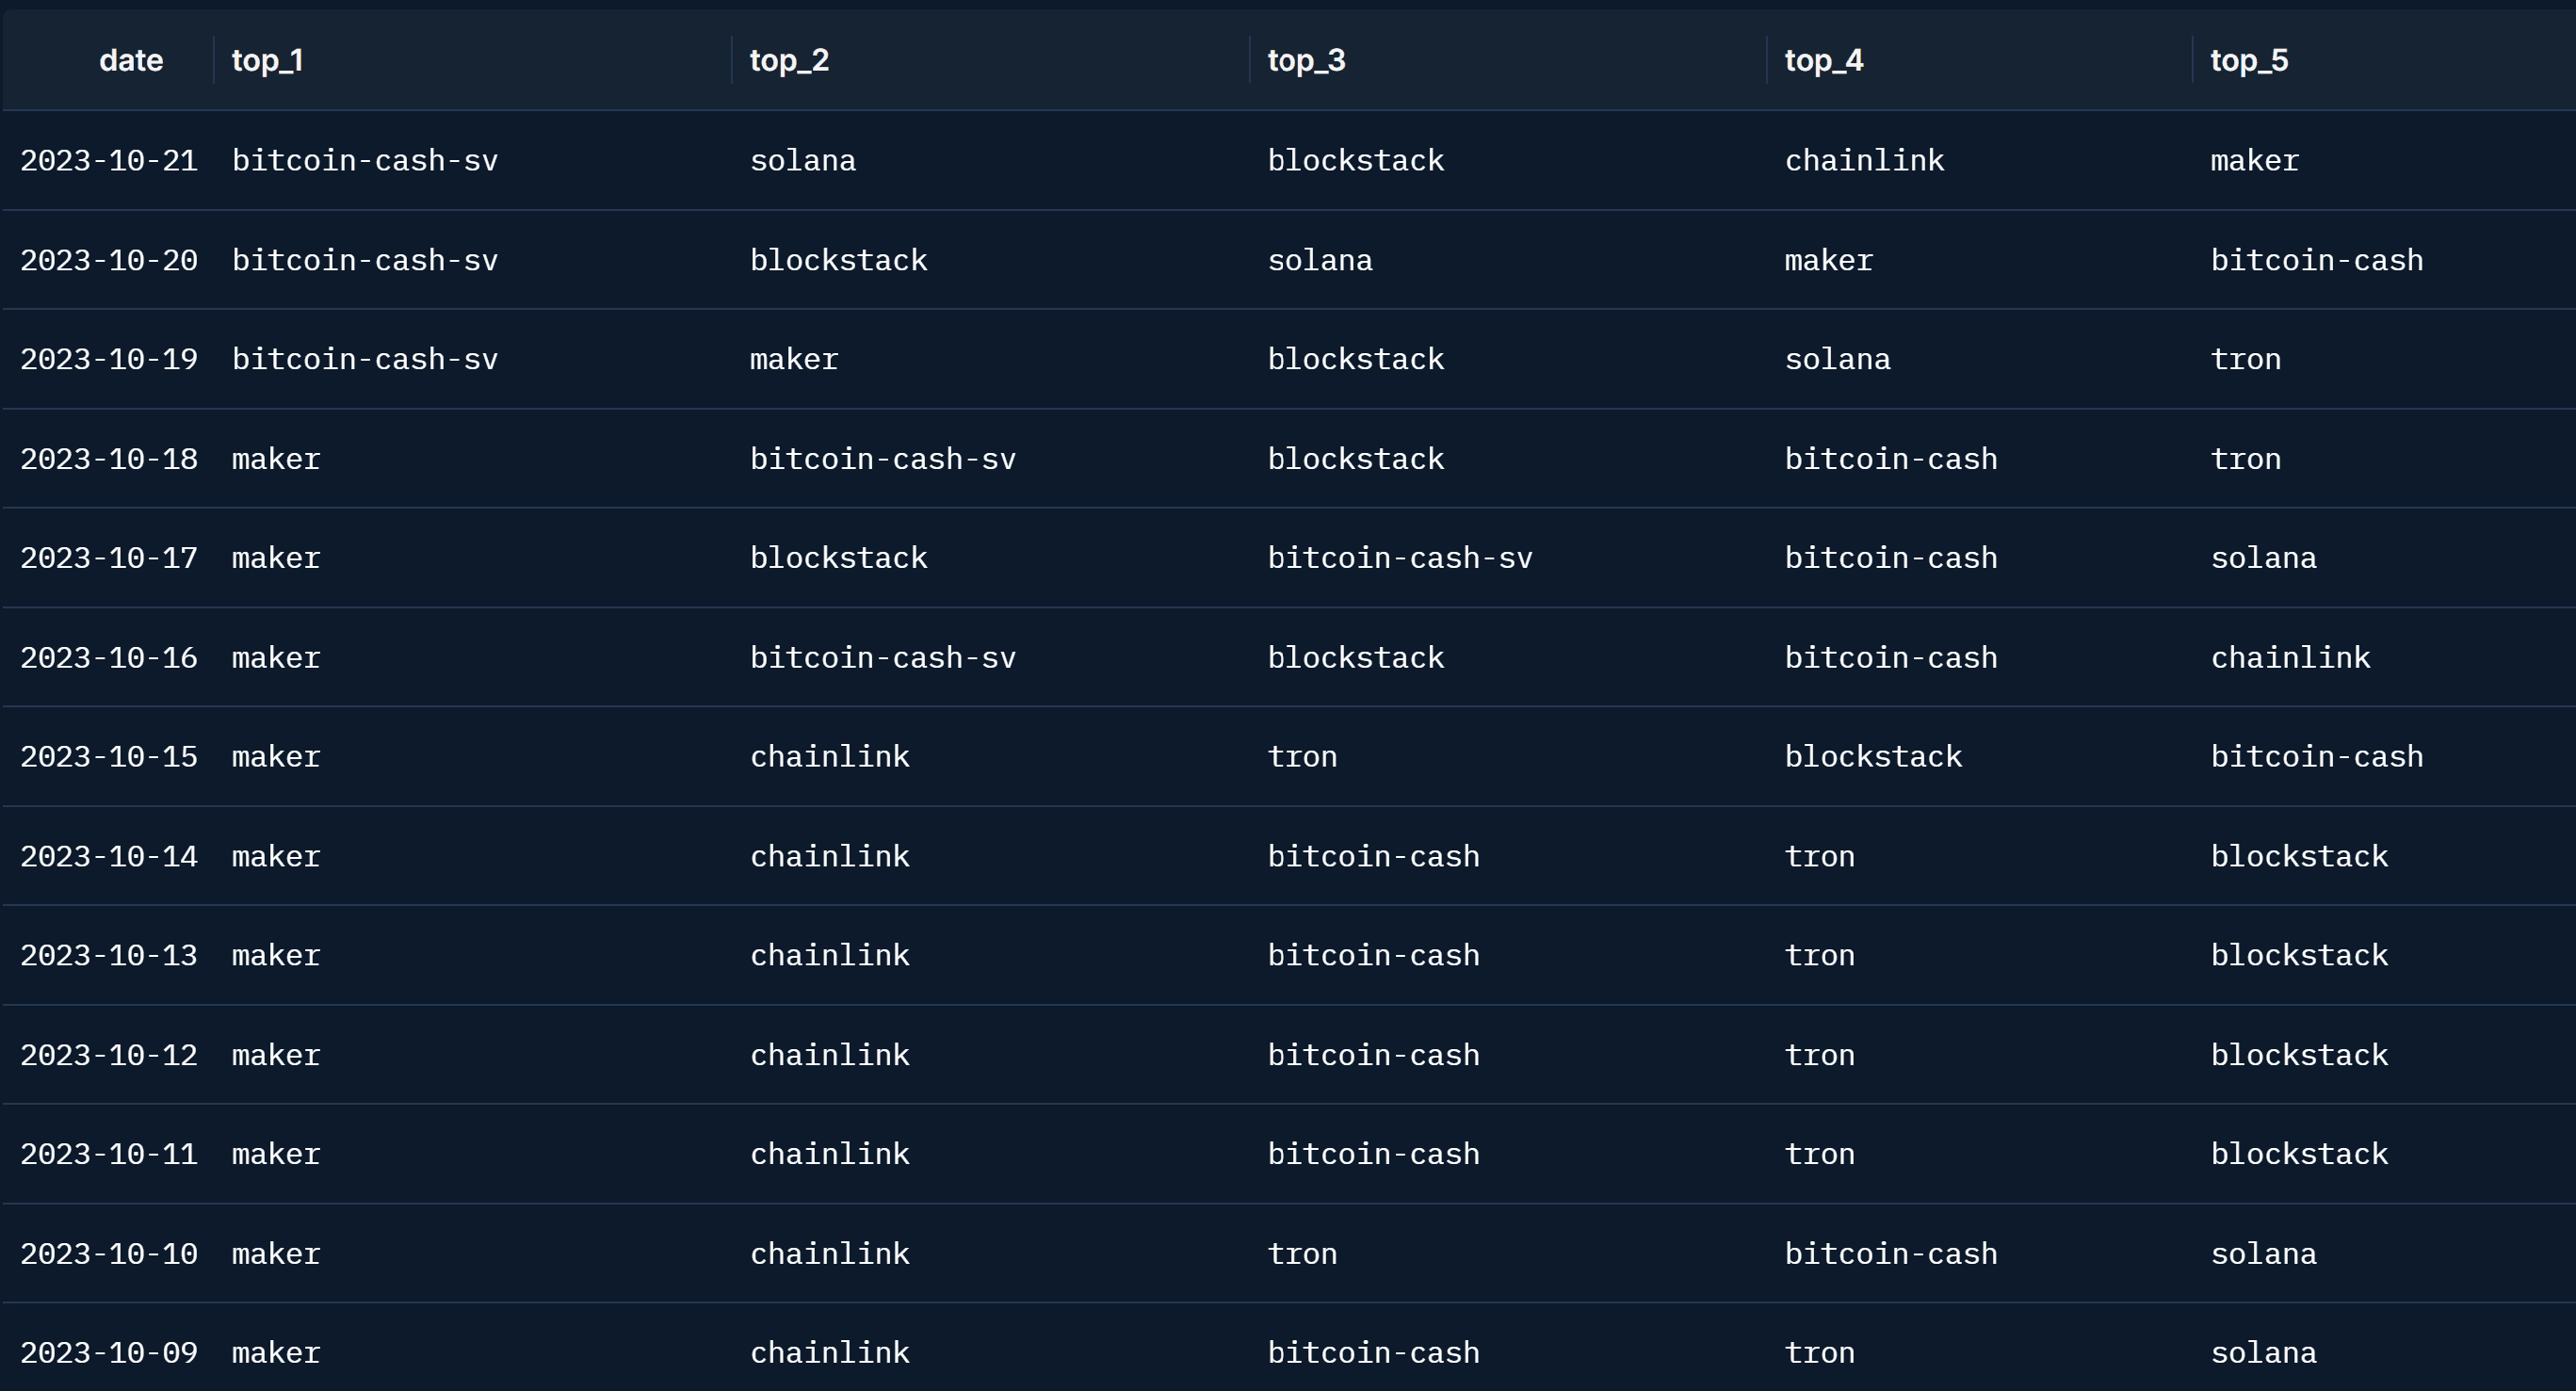
Looking at the best performing tokens in the last 7 days, we find familiar names: our Cross-momentum indicator had been notably flagging LINK, SOL, AAVE this past month (see report here). We also published a more fundamental deep-dive into Solana earlier in the month (see report here).
This week: Flash PMIs, core PCE; The European Central Bank and the Bank of Canada meet
Tuesday 24
- UK labor report (consensus on employment change -198k)
- Eurozone, UK, US Oct. Flash PMIs
- Australia Q3 CPI (consensus 5.3% YoY)
Wednesday 25
- German Oct. Ifo Business Climate (consensus 85.9)
- US Building Permits (consensus 1.473m)
- Bank of Canada’s interest rate decision (consensus on hold at 5.00%)
- Fed Chair Powell and ECB President Lagarde speak
Thursday 26
- European Central Bank meets (we and the consensus expect the ECB to remain on hold at 4.50%)
- US Q3 GDP (consensus 4.2% YoY and 2.5% QoQ)
Friday 27
- US Sept. core PCE index (consensus 0.3% MoM and 3.7% YoY)