
Fundamentals and valuations
Last week, we reviewed pure quantitative crypto indicators. This week, we are diving into the macro and cross-asset markets to assess the state of growth, financing conditions as well as investors’ expectations.
We find that Tech equities, and to a lesser extent crypto assets have been less reactive to fundamental changes. Namely, in the last two weeks, bond futures have priced a further Fed rate hike this June and pushed back the estimate for future policy rate cuts. At the same time, Bitcoin has tested the 26,000 level but not broken below. Meanwhile, US tech, Taiwanese, and Korean equities (biased towards semiconductor and other electronic products) have outperformed other markets.
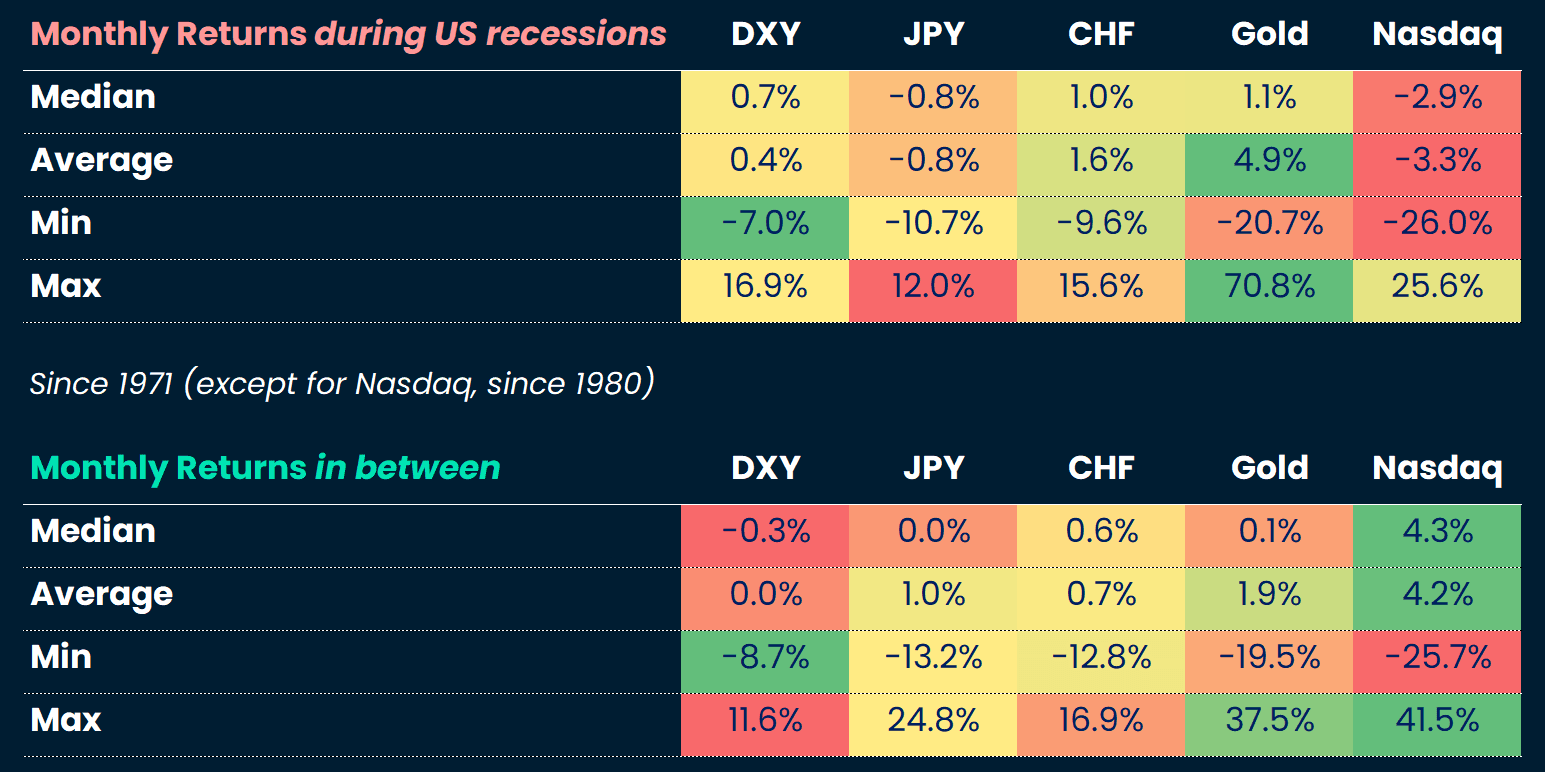
So why worry about macro, if it seems to have played a minor role in explaining crypto and tech price moves recently? We do think that a significant economic contraction would matter for both US Tech equities and crypto assets, as has historically been the case (see chart below). Also, we remain convinced that it will be difficult for crypto assets to transition to a bull market as long as “safe” assets such as US bills yield 5%+ (see our last newsletter on yield and risk differential between ETH and traditional financial assets).
Finally, looking at metrics such as valuations helps us judge whether an asset is more likely or not to exhibit the patterns of prior asset bubbles. We consider historical S&P 500, Nasdaq and single stocks’ valuations. Given the still elevated correlations between crypto and Tech stock prices, studying Tech equity valuations is insightful because of the availability of historical data.
Macro diagnostics
We first review the financial state of US consumers, given the importance of consumption for the US economy, inflation, and ultimately, for monetary and fiscal policy.
The diagnostic is that the US consumer is in strong financial shape, but starting to cut back on more “superfluous” budget items. In Q1 2023, an increase in wages enabled the US consumer to step up spending for discretionary goods (notably autos) and services. The saving rate remains at a solid ~4%. According to a study of the San Francisco Fed, that we have already quoted before, excess nominal savings from the post-pandemic fiscal boost are expected to revert to normal at the end of this year / beginning of next year. This gives us a rough timeline of when the boost from extra savings is likely to fade.

We add two quotes from Walmart’s Chief Financial Report, following Q1 earnings reporting, on retail spending behavior who said that “consumers are buying fewer discretionary items, waiting for promotions before making pricey purchases like TVs and trading down to lower-priced items, such as buying a smaller box of cereal. Yet shoppers are still spending.” “We’re seeing in these economic indicators that there is some strain on the consumer, but the resilience has surprised us. And I think that’s in part probably because balance sheets are much stronger than they were pre-pandemic, even at this point.”
Keeping in mind the state of the US consumer’s finances, we turn to macro financing conditions, starting by lending. Lending growth has continued to slow steadily since it peaked in Q4 2022. The impact of the US regional banks’ failures and the overall fall in banking stock prices will have probably confirmed the trend of slowing lending growth. It is difficult to forecast the end point for lending, but, given the current monetary policy stance (high rates for longer) it would make sense for lending growth to keep cooling.

Putting it all together, as long as wage income is steady, and the US consumer is selective in his spending, growth could slow but avoid a collapse. But, in parallel, lending conditions are getting more restrictive, and excess savings will become more sparse at some point in the next six-to-nine months, which will leave little cushion for a soft landing of consumption and growth, in our view.
Growth differentials
Because, globally, services spending is being prioritized over goods expenses, this is reflected in a two-speed global economy with manufacturing lagging services, including in China, which exited covid lockdowns barely a few months ago.
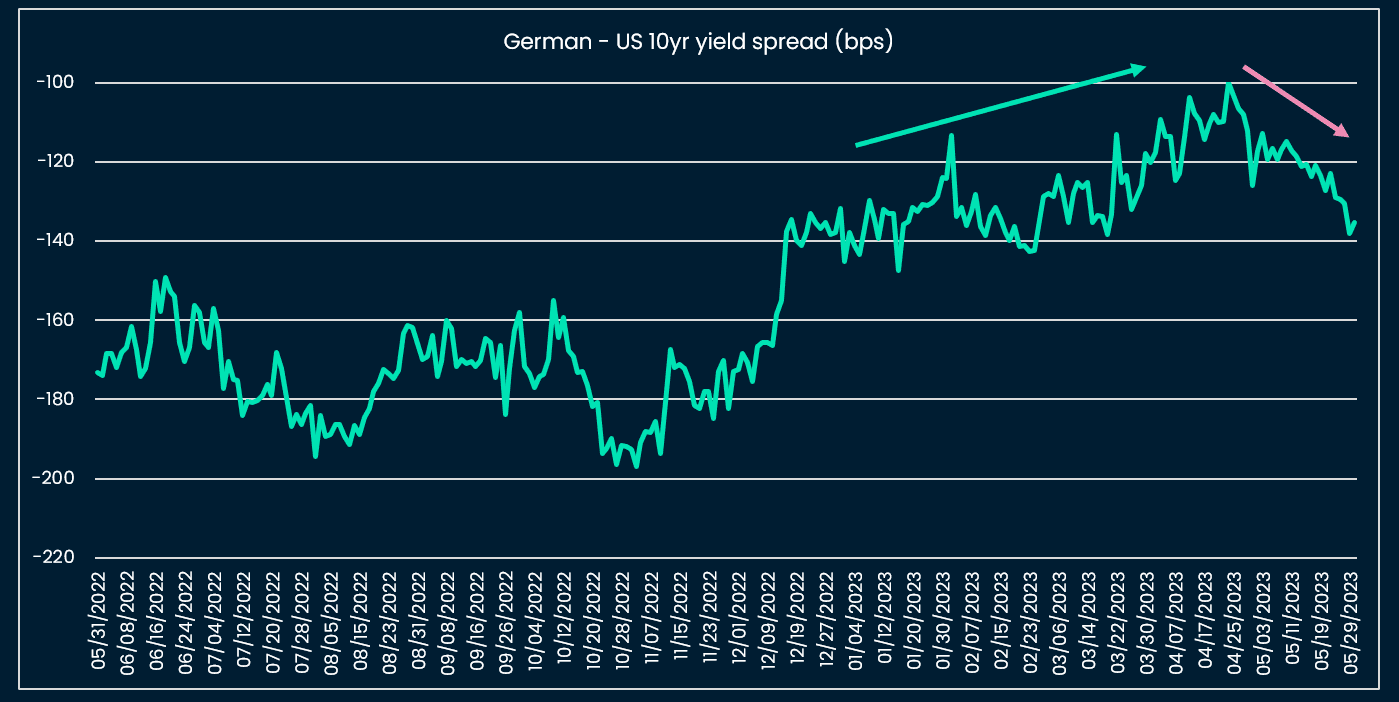
Another notable differential in growth has emerged between the US and the rest of the world, notably Europe, the UK, China, and in favor of the US. This has probably supported the recent price bounce of the US dollar that has come with the re-pricing of the Fed’s terminal rate higher, to 5.25%-5.50% from 5.00-5.25%, by markets.
Meanwhile Japan is the major economy where monetary policy remains supportive for now plus is benefitting from its recent lifting of covid measures.

We see the following scenario playing out: US rates high for long into 2024 until a significant growth shock forces a Fed pause. In the meantime, Tech equities and crypto can continue to diverge from “fundamentals”, until valuations become too stretched by historical measures.
Market diagnostics
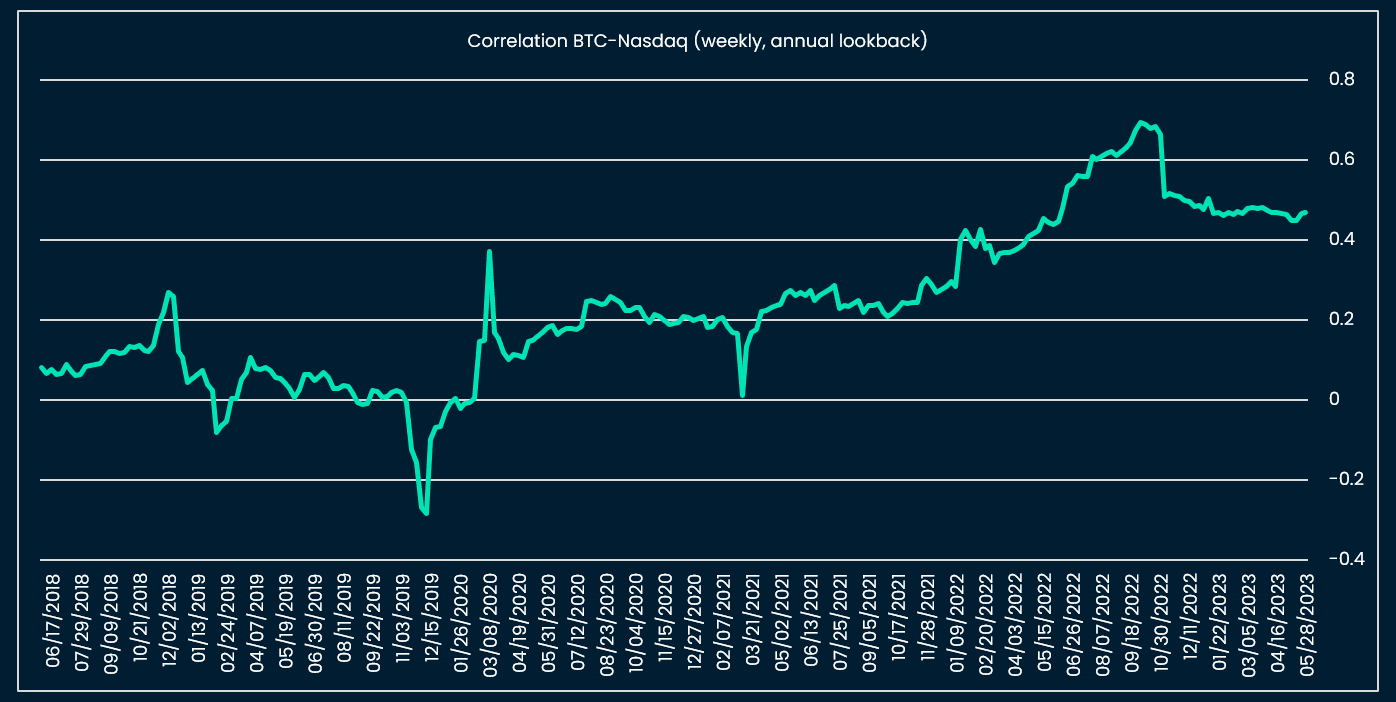
In this section we focus on Tech equities as a proxy for crypto assets, because of the availability of historical data, and the ongoing strength in correlations between crypto and Tech.
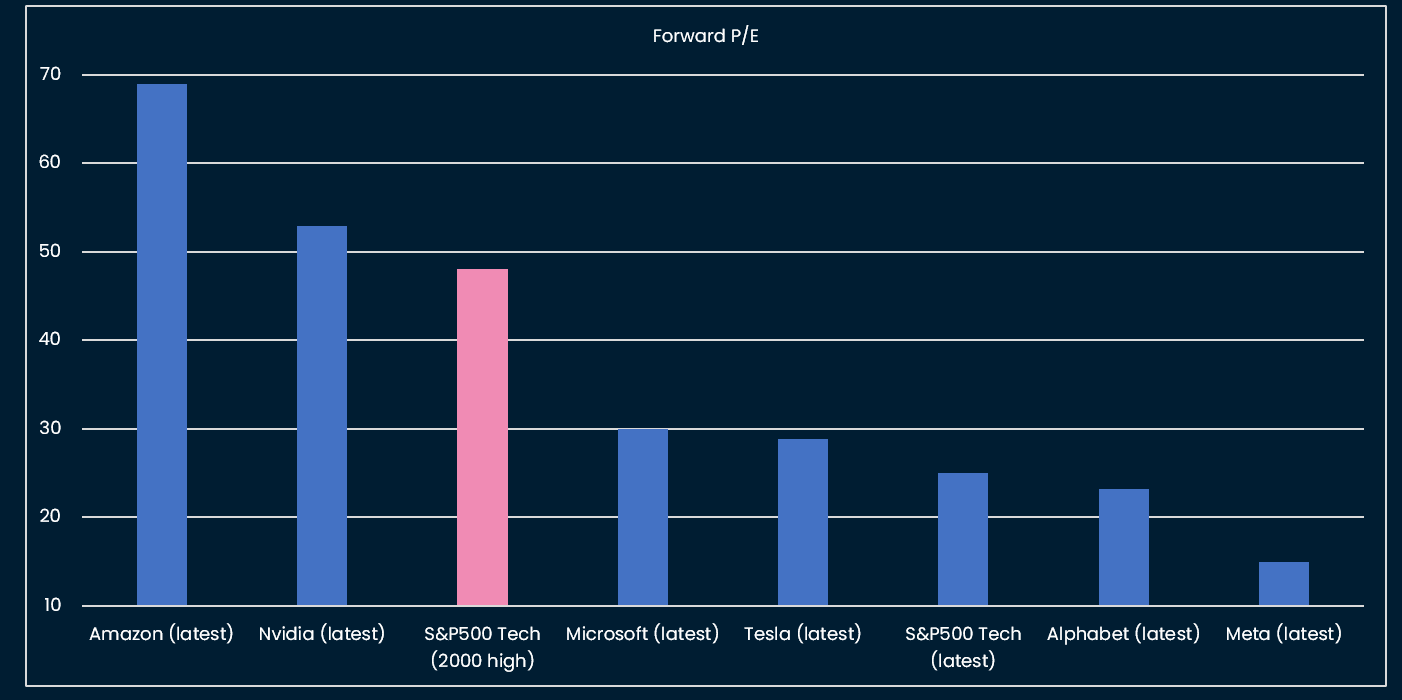
We find that Tech stocks’ valuations are historically elevated, although below the highest valuations reached in 2000, prior to the Tech bubble’s burst.

However, diving into single stocks’ valuation, some names pop up as more expensive, and for some, above the 2000 valuation levels of the S& P500 Tech index:
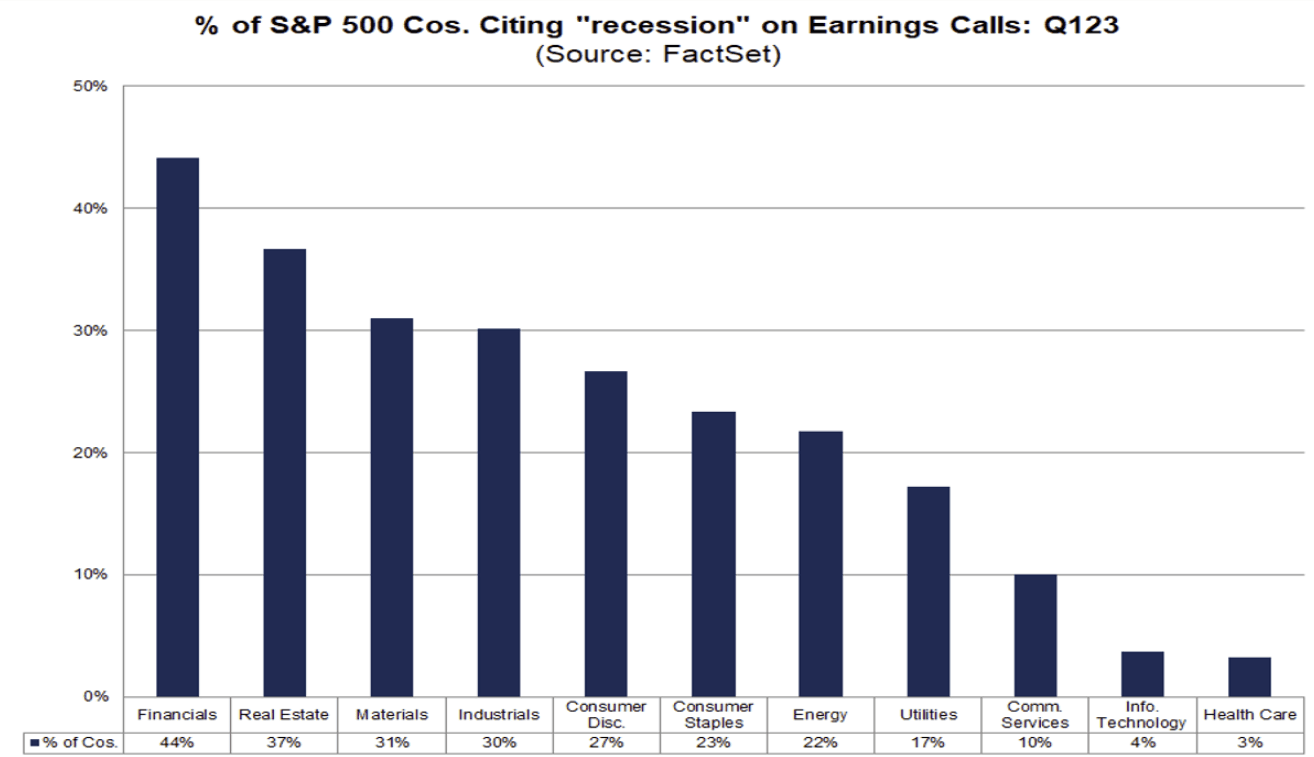
We also highlight the discrepancies between sectors, with Financials and Real Estate companies still very much preoccupied with a recession while at the opposite end, Information Technology and Healthcare companies have mentioned the word “recession” much less frequently in their latest earnings reports.
Tech equities’ outperformance would be good news in an environment where monetary and fiscal policy would become more supportive. We know though that both monetary and fiscal policy will be restrictive given sticky inflation, a resilient labor market and a political standstill in the US because of a politically divided Congress.
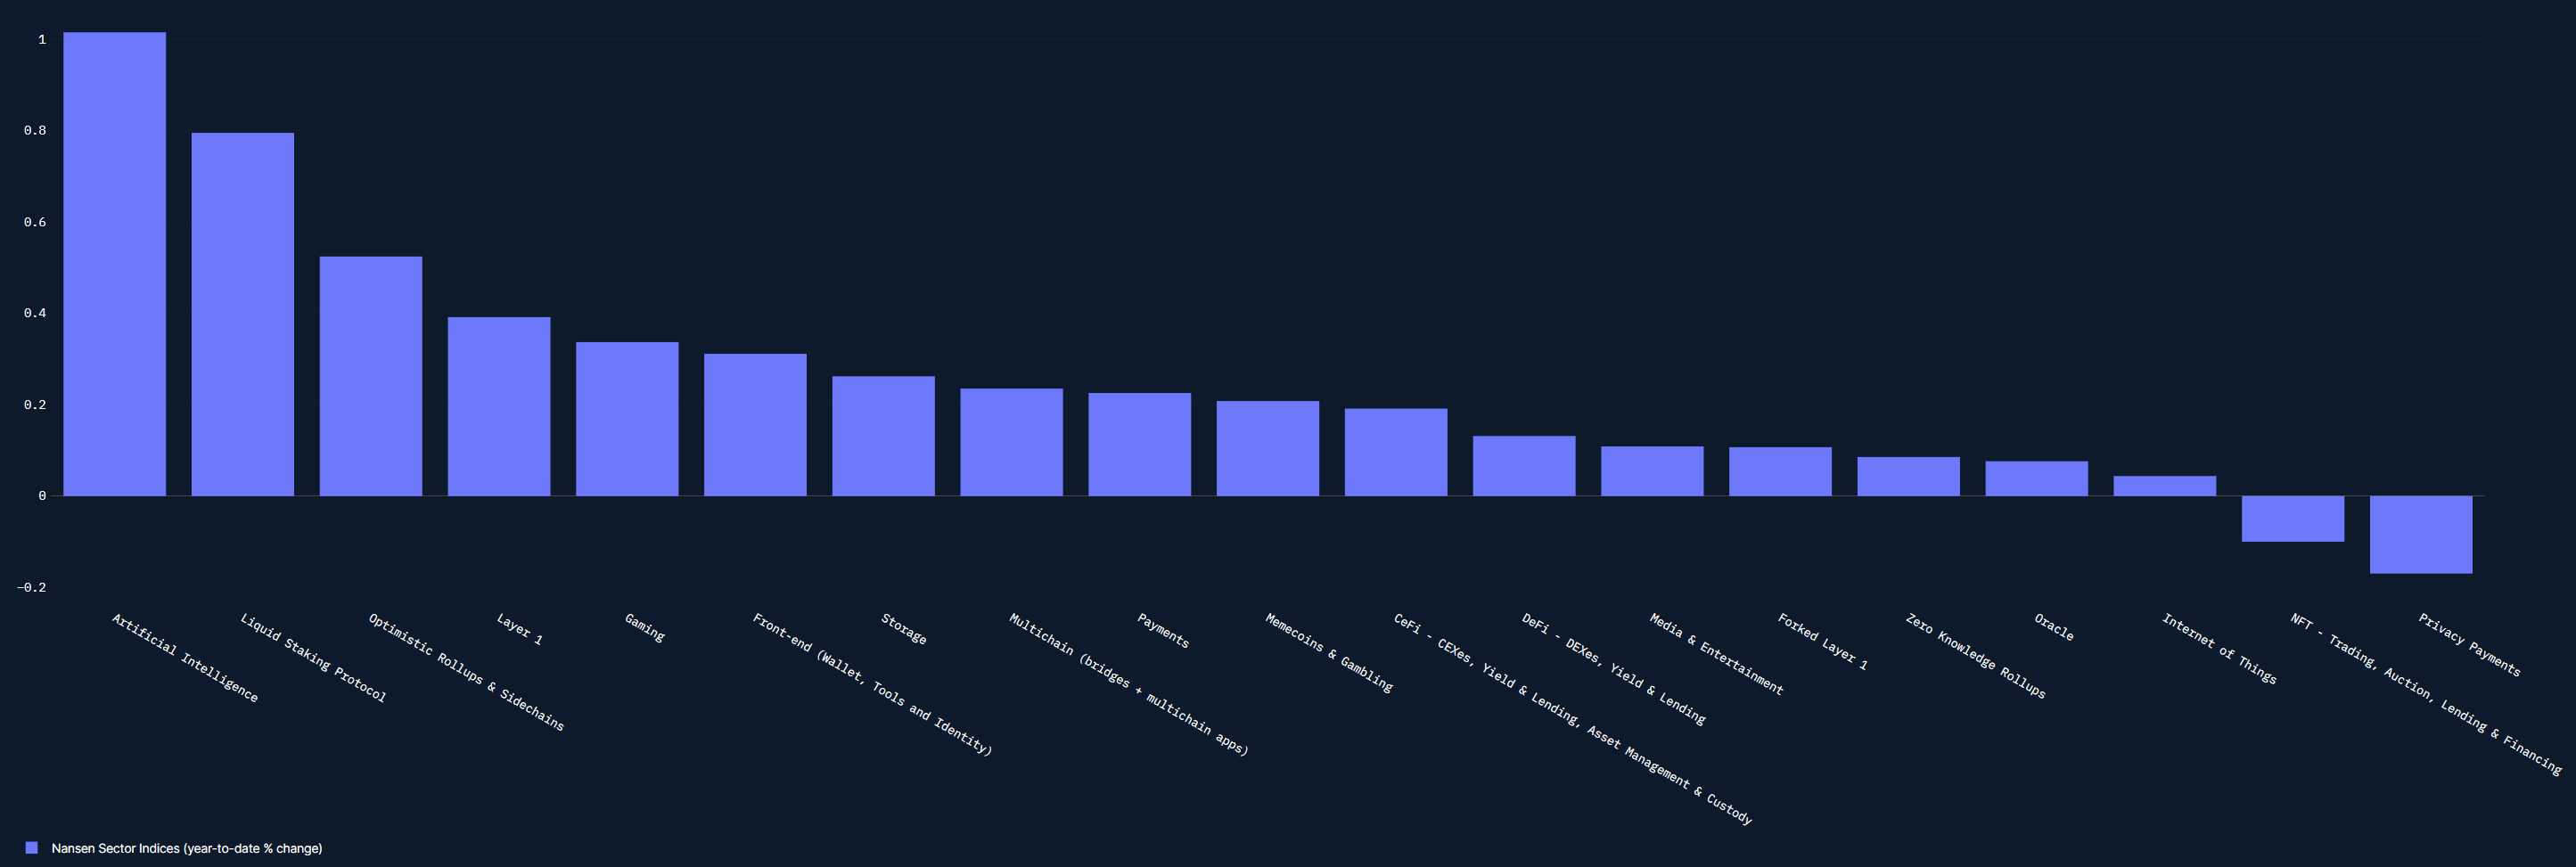
Crypto has seen the following sectors driving the rally YTD:. We think that some narratives are based on new fundamentals (Liquid Staking) while others (AI) might be a corollary of the rally in Semi and AI equity names.
This week: PMIs and US job report
Wednesday 31 May
US JOLTS job openings (consensus 9.775m) China Caixin Manufacturing PMI (consensus 50.3)
Thursday 1 June
Eurozone May CPI (consensus 7.0% YoY) US ISM Manufacturing PMI (consensus 47)
Friday 2 June
US Nonfarm Payrolls (consensus 180k) US Unemployment Rate (consensus 3.5%, participation rate 62.5%)