Introduction
The double-whammy of a USD ~1.5bn crypto exchange hack following a record 44-minute rug pull of a presidentially endorsed meme coin (see our read and stats here) were enough to push already “weakish” crypto prices to breaking lower.
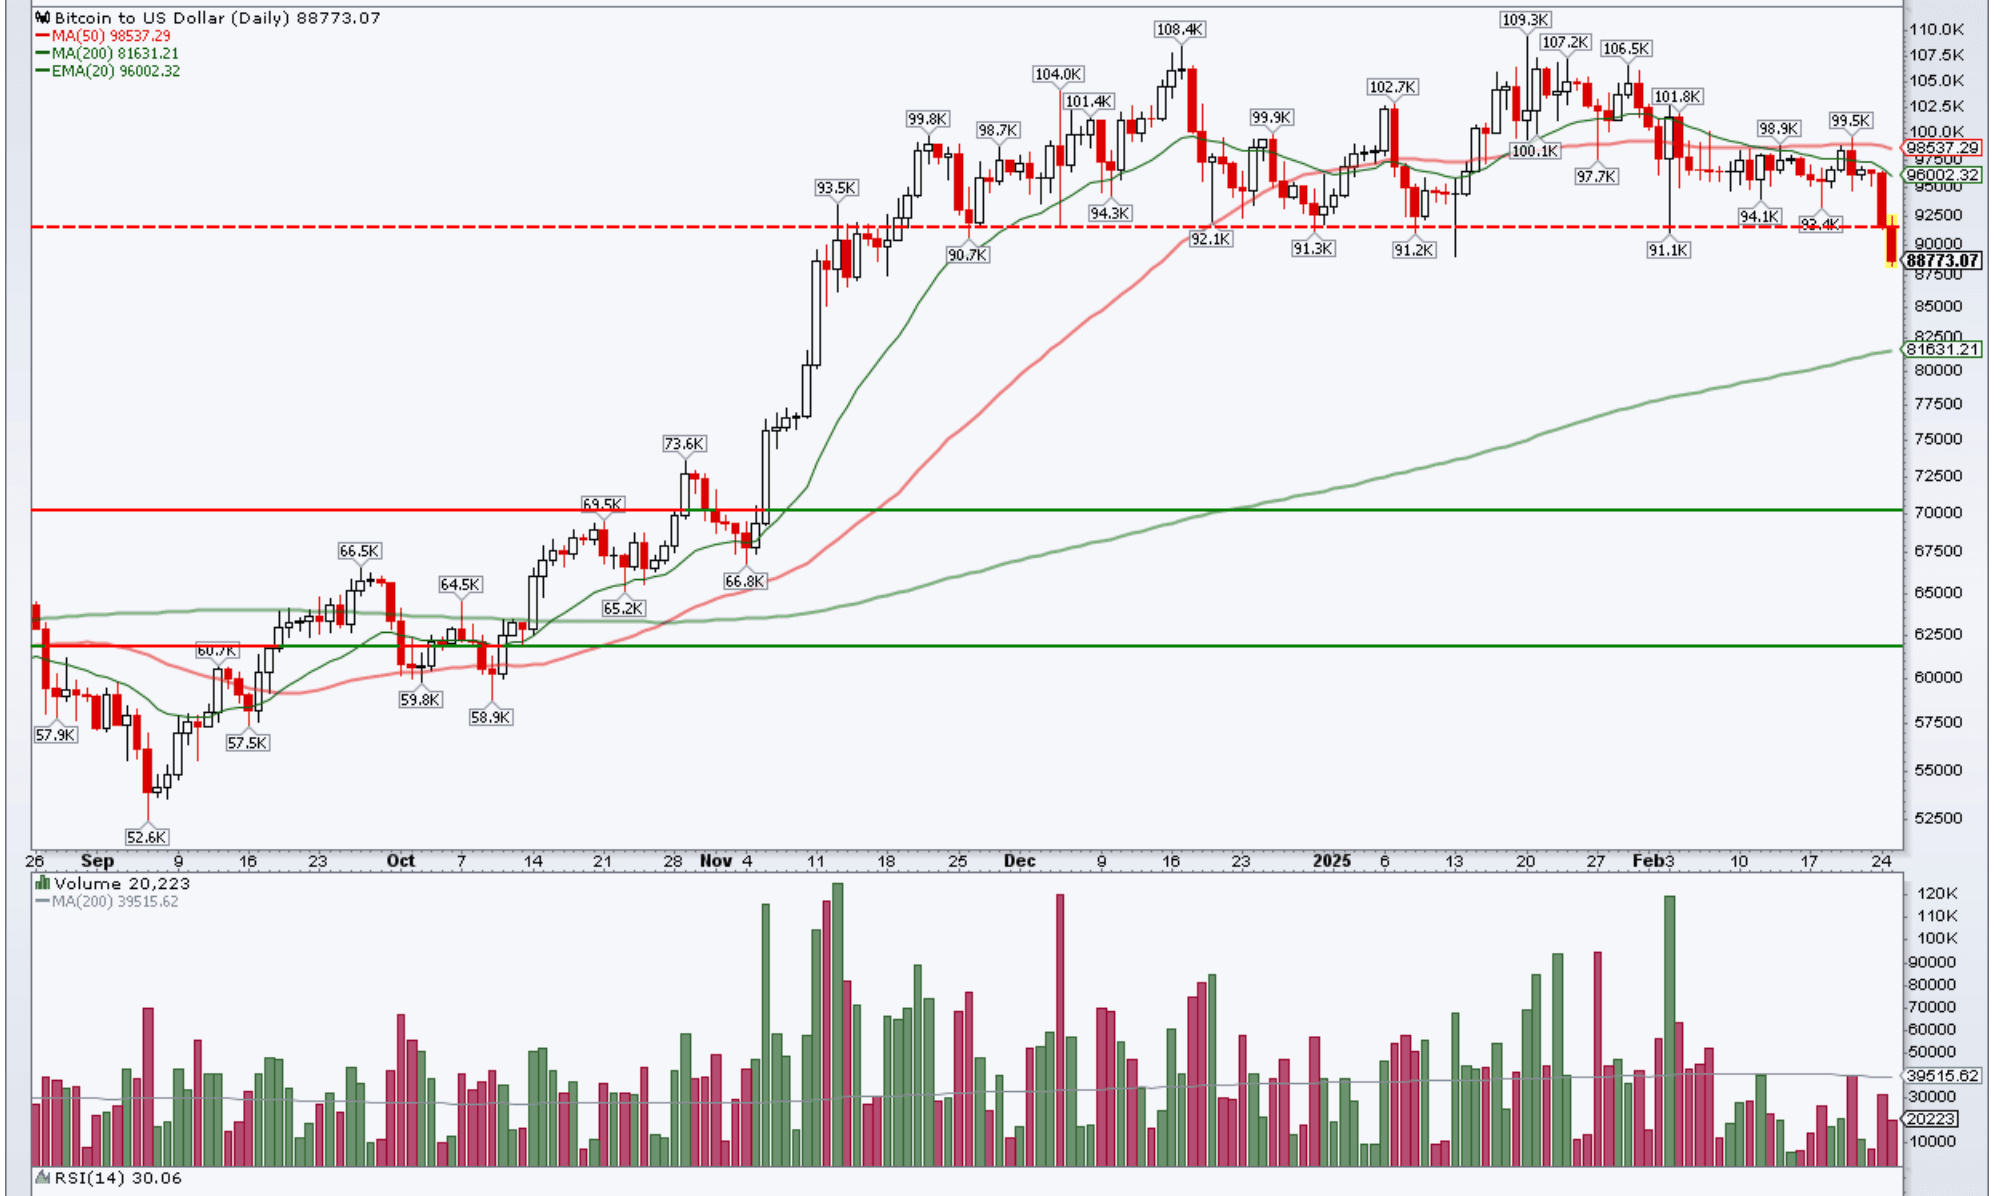
As we write, BTC, which has been a bastion of resilience so far, carried by Strategy’s and institutional buying, has also broken below its year-to-date ~91K support level, and the 20-day exponential moving average (light green below) has crossed below the 50-day moving average (red line).
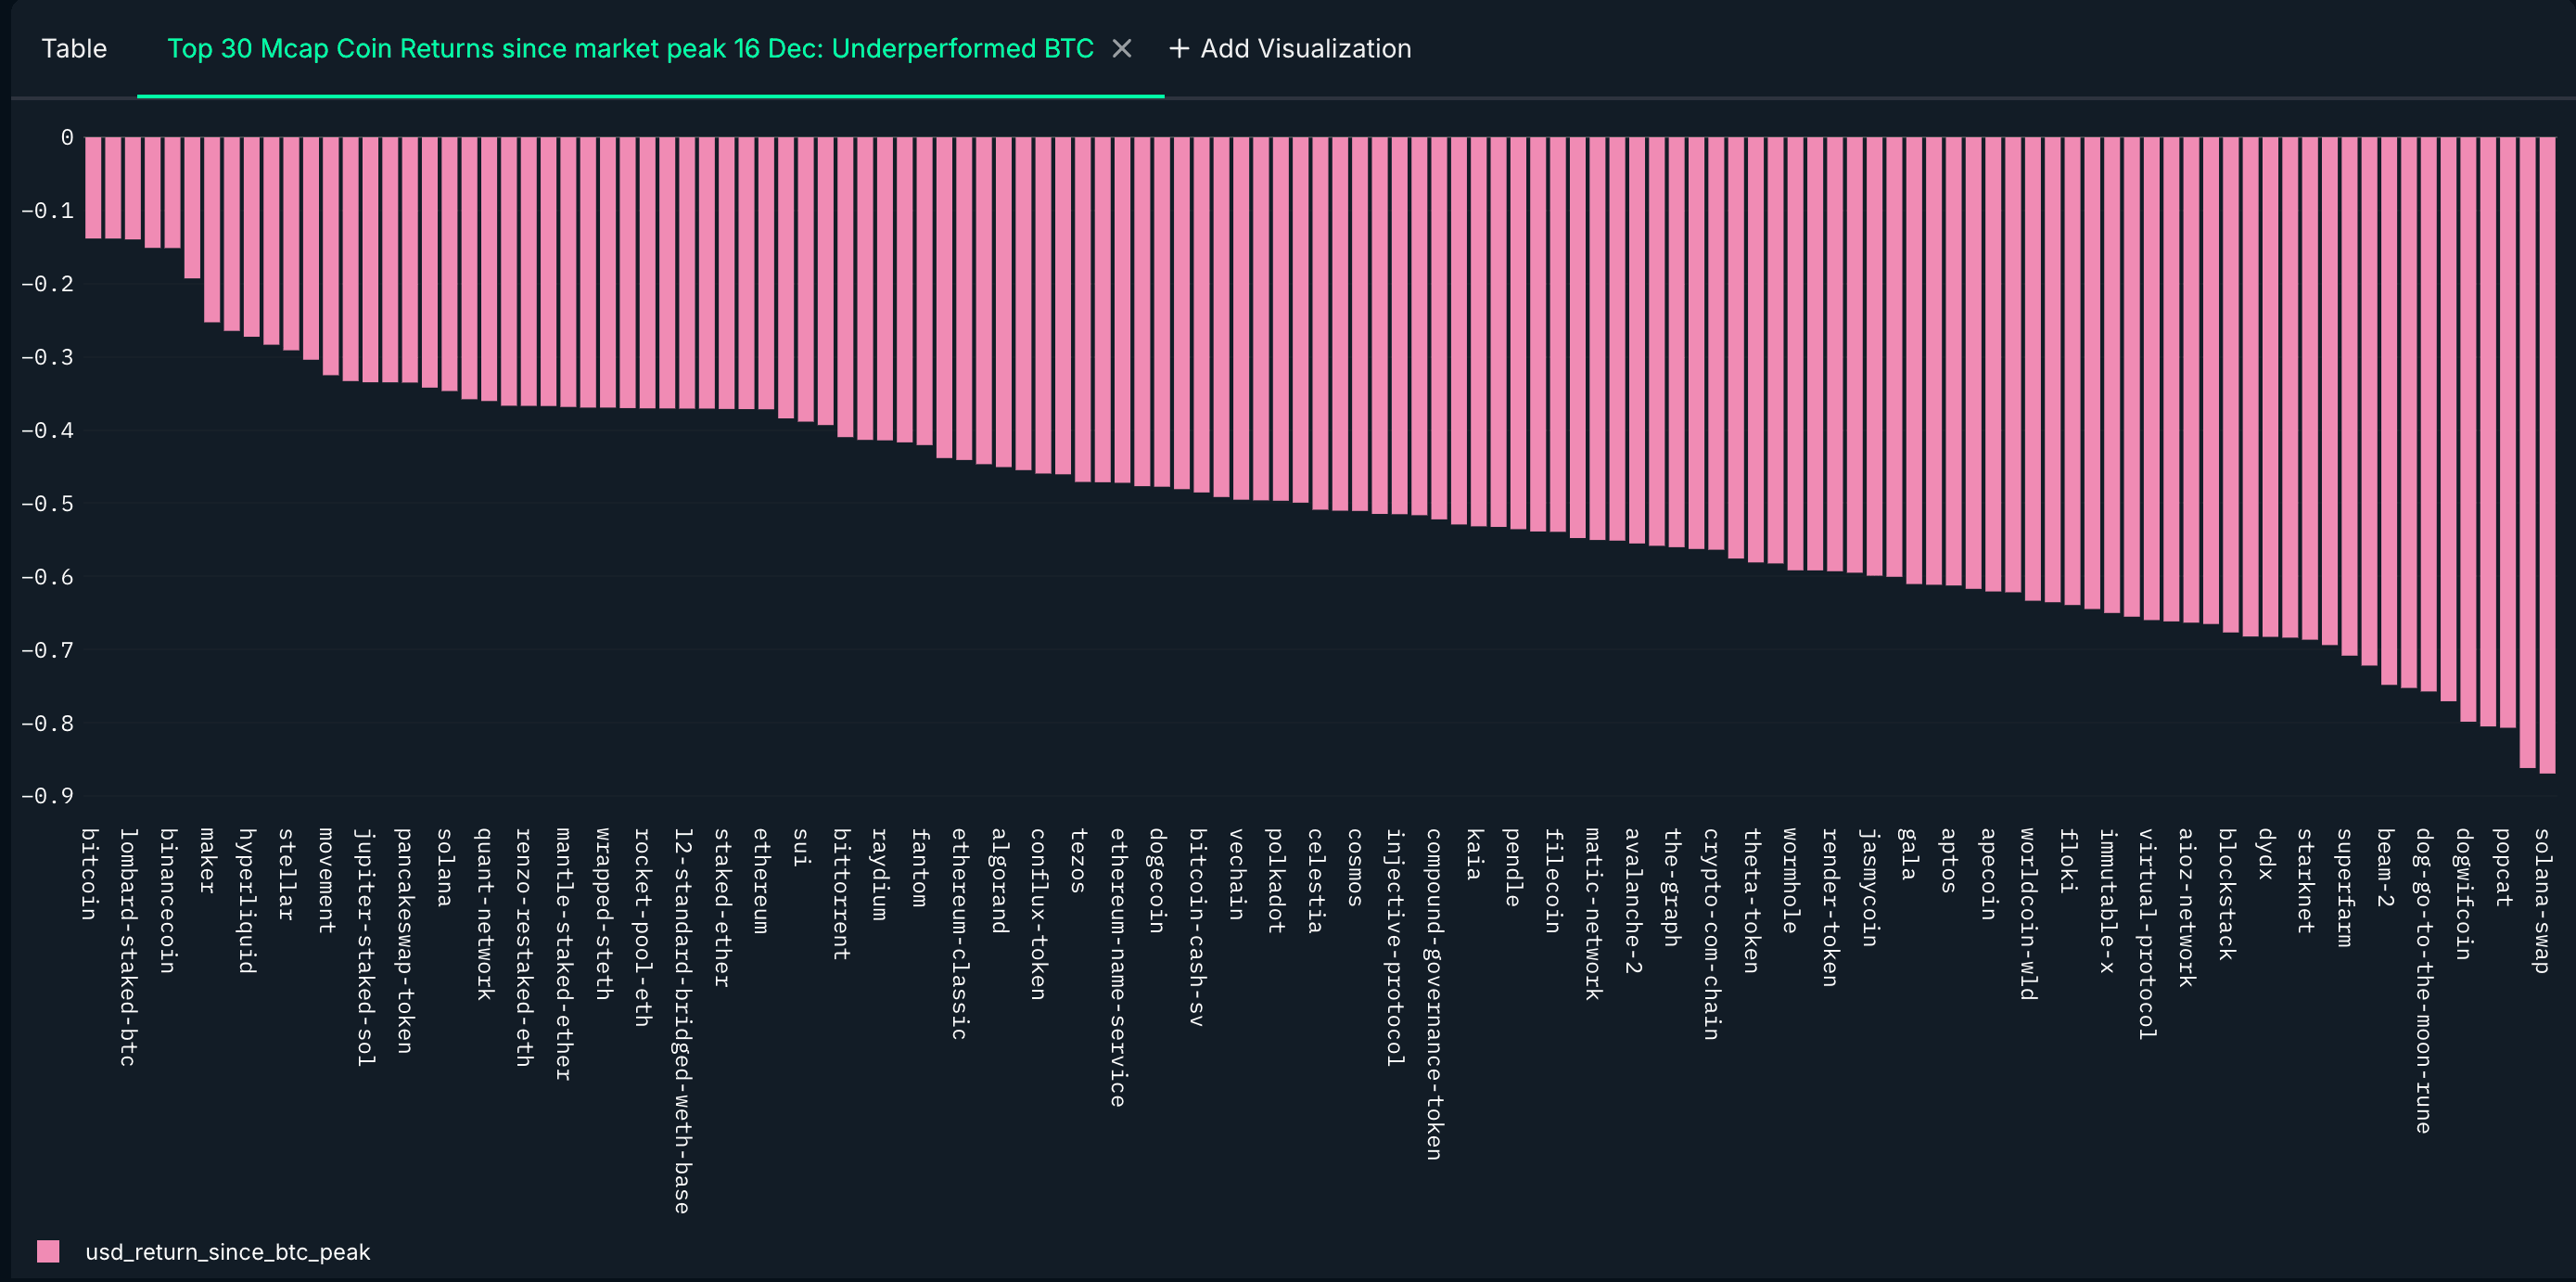
This follows a very lackluster performance of altcoins since mid-December. Of the top 150 tokens per market cap, 124 underperformed BTC since the mid-December market “peak”, with downsides ranging from -14% to -87%.
However, equity markets also faltered towards the end of last week, with US markets, especially the Russell 2000 Small Caps, down -3.2%, while US Treasury rates were down -20bps. To us, it seems that US markets are pricing a somewhat higher probability of a “lower growth/ sticky inflation” scenario under the new US administration (see here for a more detailed analysis of the impact of tariff policies on crypto markets).
What if the Trump era = low growth and sticky inflation?
After a brief market honeymoon that followed the Trump administration’s investiture, investors’ focus turned to geopolitics and tariffs. This sequencing was to be expected (tariffs do not need Congress approval and are therefore quicker to use), but the surprising elements were the targeted countries, which included Canada and Mexico, two historical allies in the North American trade agreement. Ultimately, these are likely to be negotiation techniques by the US administration. However, while negotiations last, the uncertainty for US businesses around their local supply chains has likely been sufficient to put a larger question mark on their revenue and cost prospects.
In contrast to the January PMIs, the February Flash PMIs were sampled after the Mexico-and-Canada 25% tariff salvo and showed a 22-month weak Services sector activity, partly offset by an improving Manufacturing PMI. The latter potentially reflects some tariff front-loading, though.

The PMI press releases pointed towards policy uncertainty as a key factor for February's weakness: “The deterioration in February was primarily a reflection of increased uncertainty about the business environment, especially in relation to federal government policies related to domestic spending cuts and tariffs. Worries over higher prices and broader geopolitical developments were also noted.”
Considering the composite PMI, which weighs the Services economy higher than Manufacturing, if the February flash number is taken at face value, it would be consistent with a 0.6% US real growth, this would be down from 2.3% in Q4 2024, and from 3.1% the prior quarter.

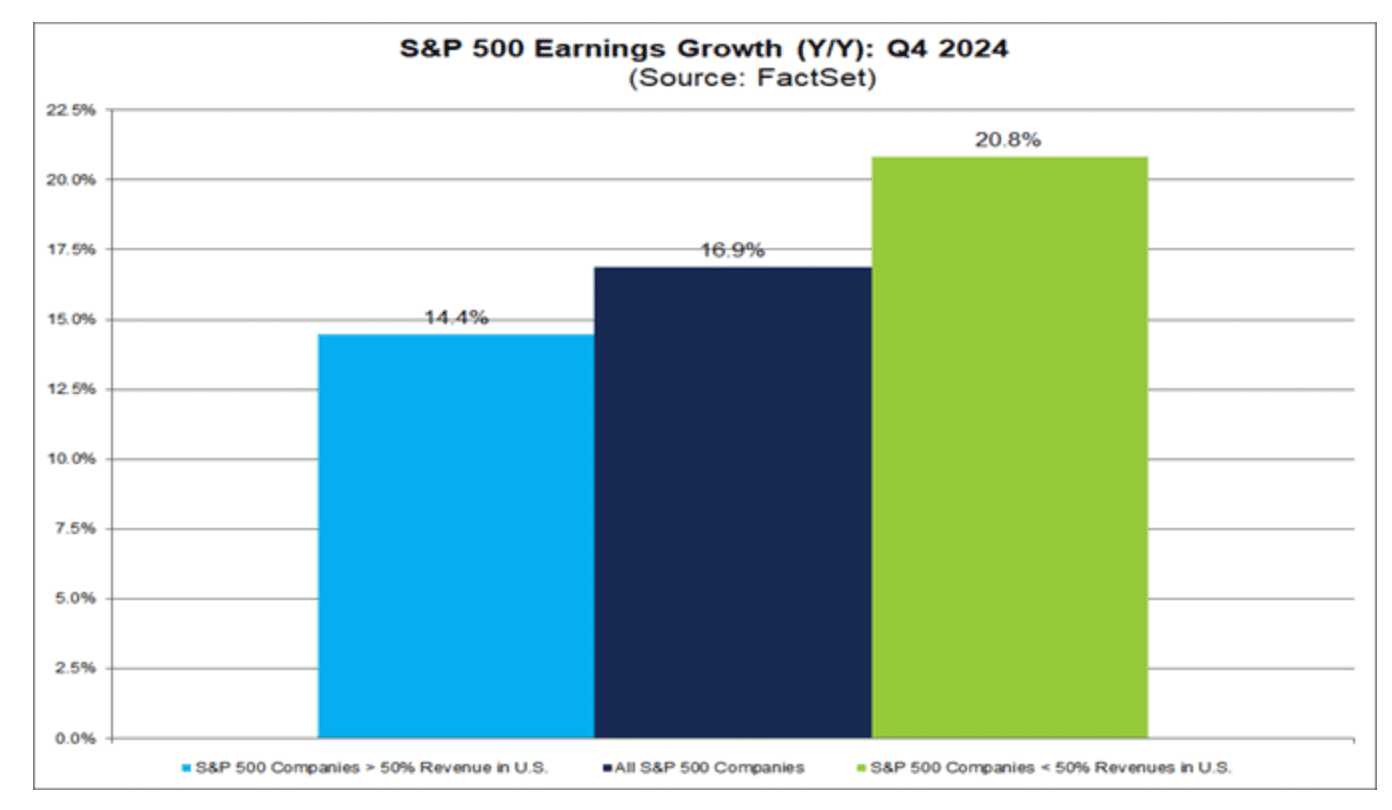
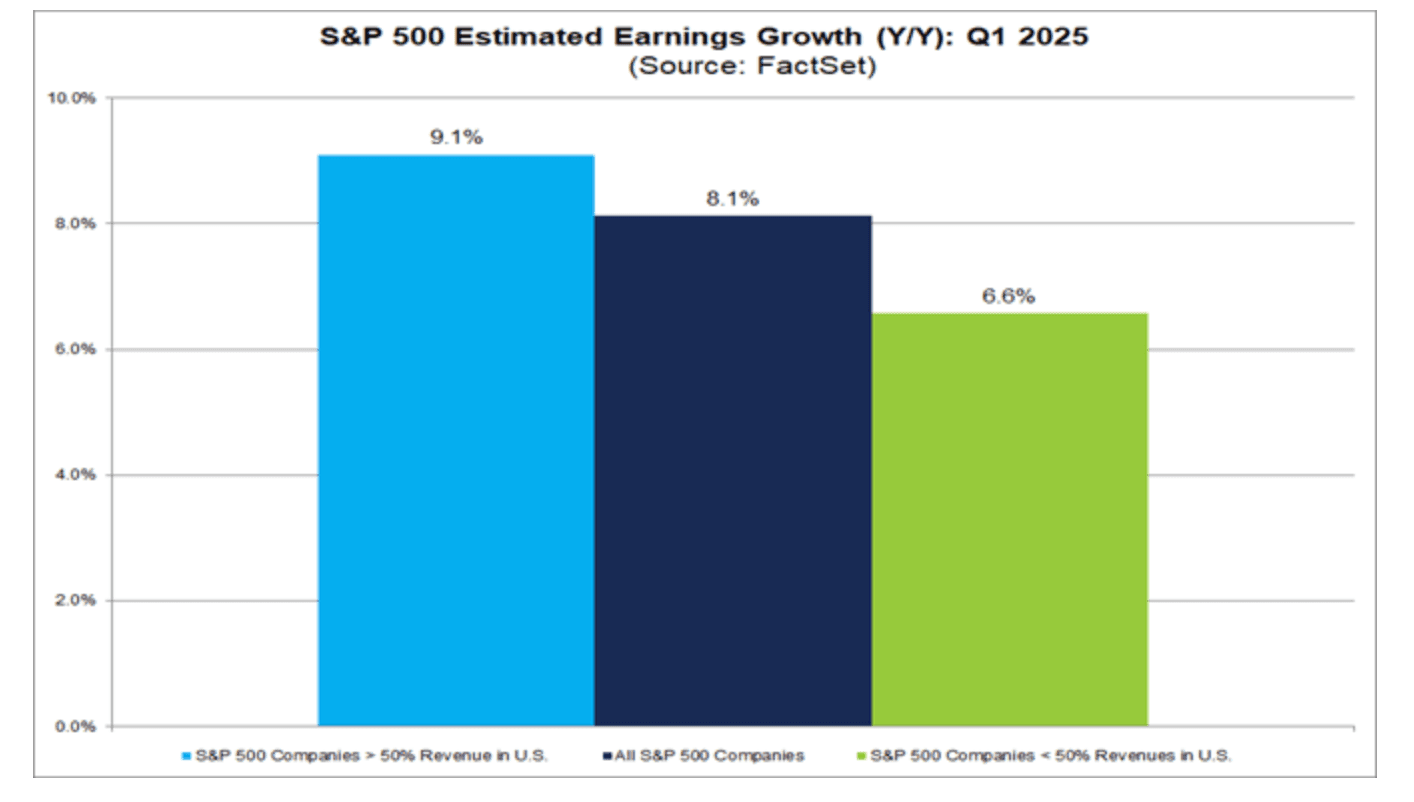
Switching from the macro to the micro picture: Q4 24 corporate earnings growth has marked a record high of 16.9%, but following timid guidance from corporates, analysts have trimmed the Q1 25 earnings growth projections to half of that rate. Again, there seems to be an issue with policy and macro uncertainty questioning growth prospects.
What would help risk appetite recover?
- Lower inflation prints would give a higher conviction to the US Fed to resume rate cuts (US January core PCE report on Friday 28 February)
- Signs that US growth is not decelerating and that corporate top-line growth is solid (Nvida reporting on Wednesday 26 February)
- Closer to the summer, some progress in the passing of the Trump administration's proposed tax cuts
- Some clarity around tariff policies (March 4 deadline for Canada & Mexico)
Crypto fundamentals: The Good, the Bad, the Ugly
Let us start with the recent “good” crypto developments because there have been some, although ignored by markets.
The Nasdaq’s ETF listing applications are making progress for Litecoin and Ripple, while Binance US resumed its services.
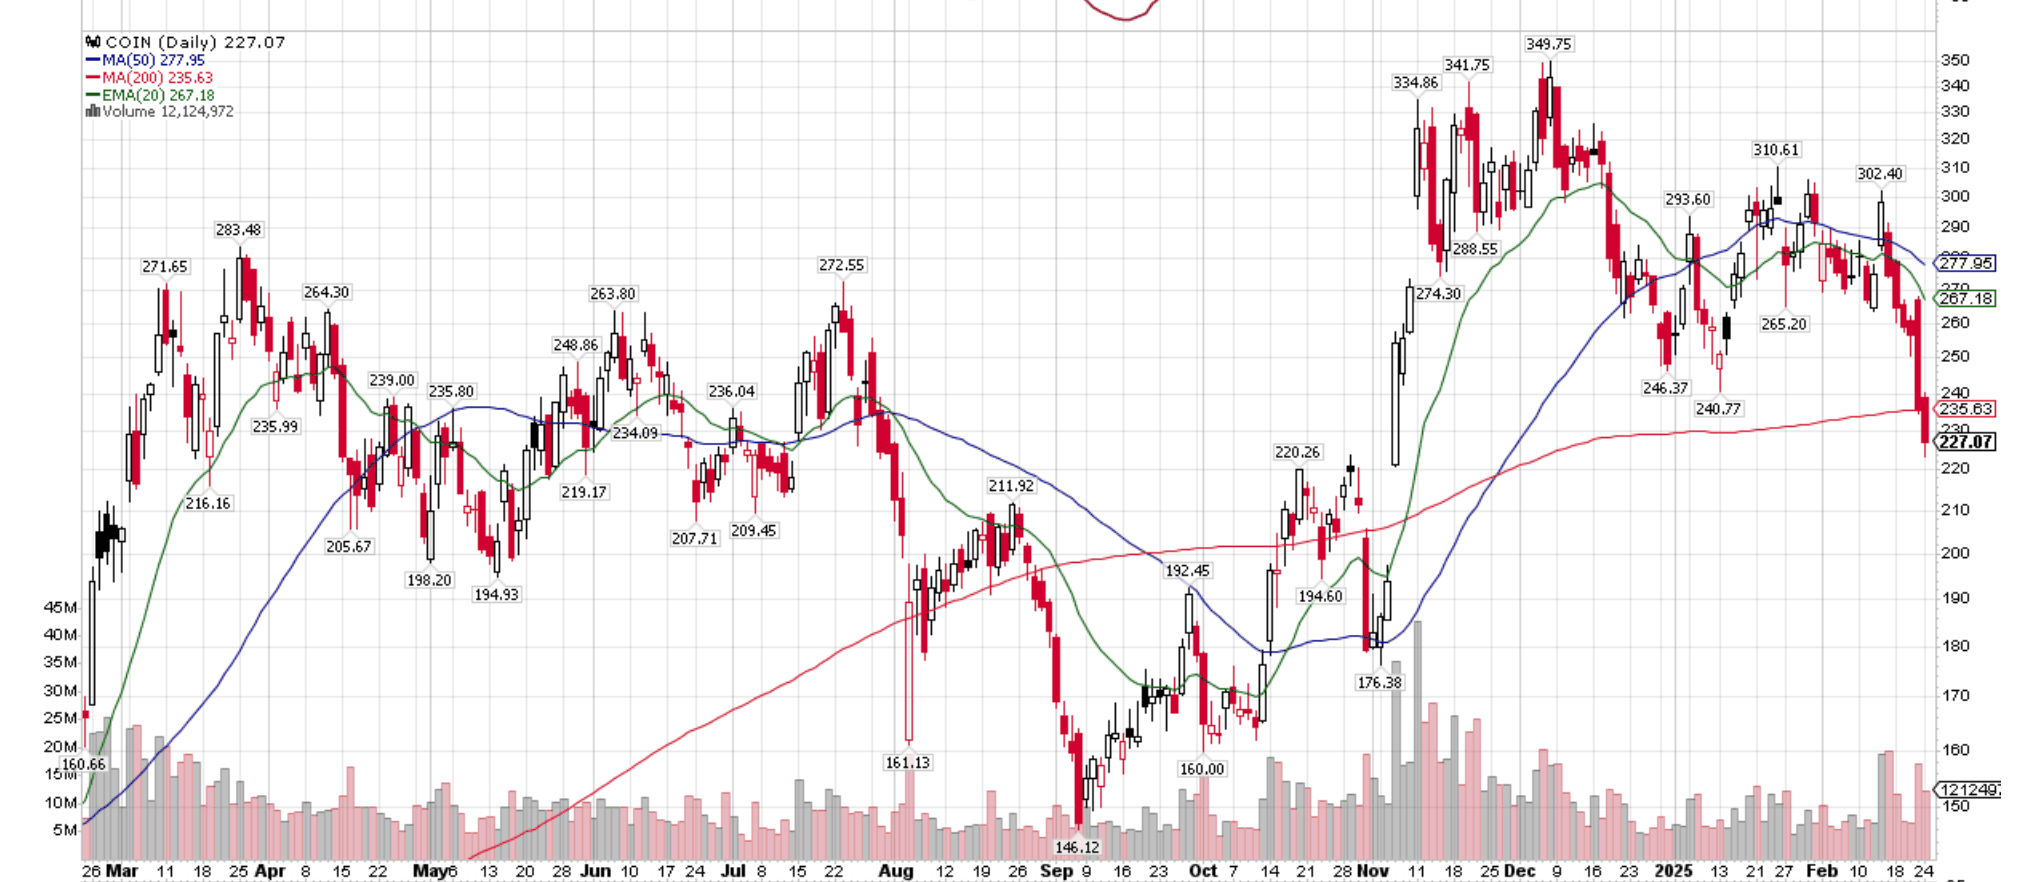
This should give us comfort that “Crypto America” is in progress. An illustration of how vulnerable sentiment is at the moment is Coinbase's share price, which has fallen just above the post-election November price gap in the days following the announcement that its SEC lawsuit is very likely to be resolved.
This brings us to the “bad” to “ugly”. The first meme coin scandal surrounding $LIBRA (see our detailed forensic report here) was, to our surprise, not sufficient to bring down crypto sentiment significantly. Although on-chain data showed an intersection between the wallets having “sniped” $LIBRA and $MELANIA memes, the US pro-crypto rhetoric remained in place, with President Trump re-posting Ripple CEO’s interview on Truth Social and President Milei joining Elon Musk during a DOGE press conference.
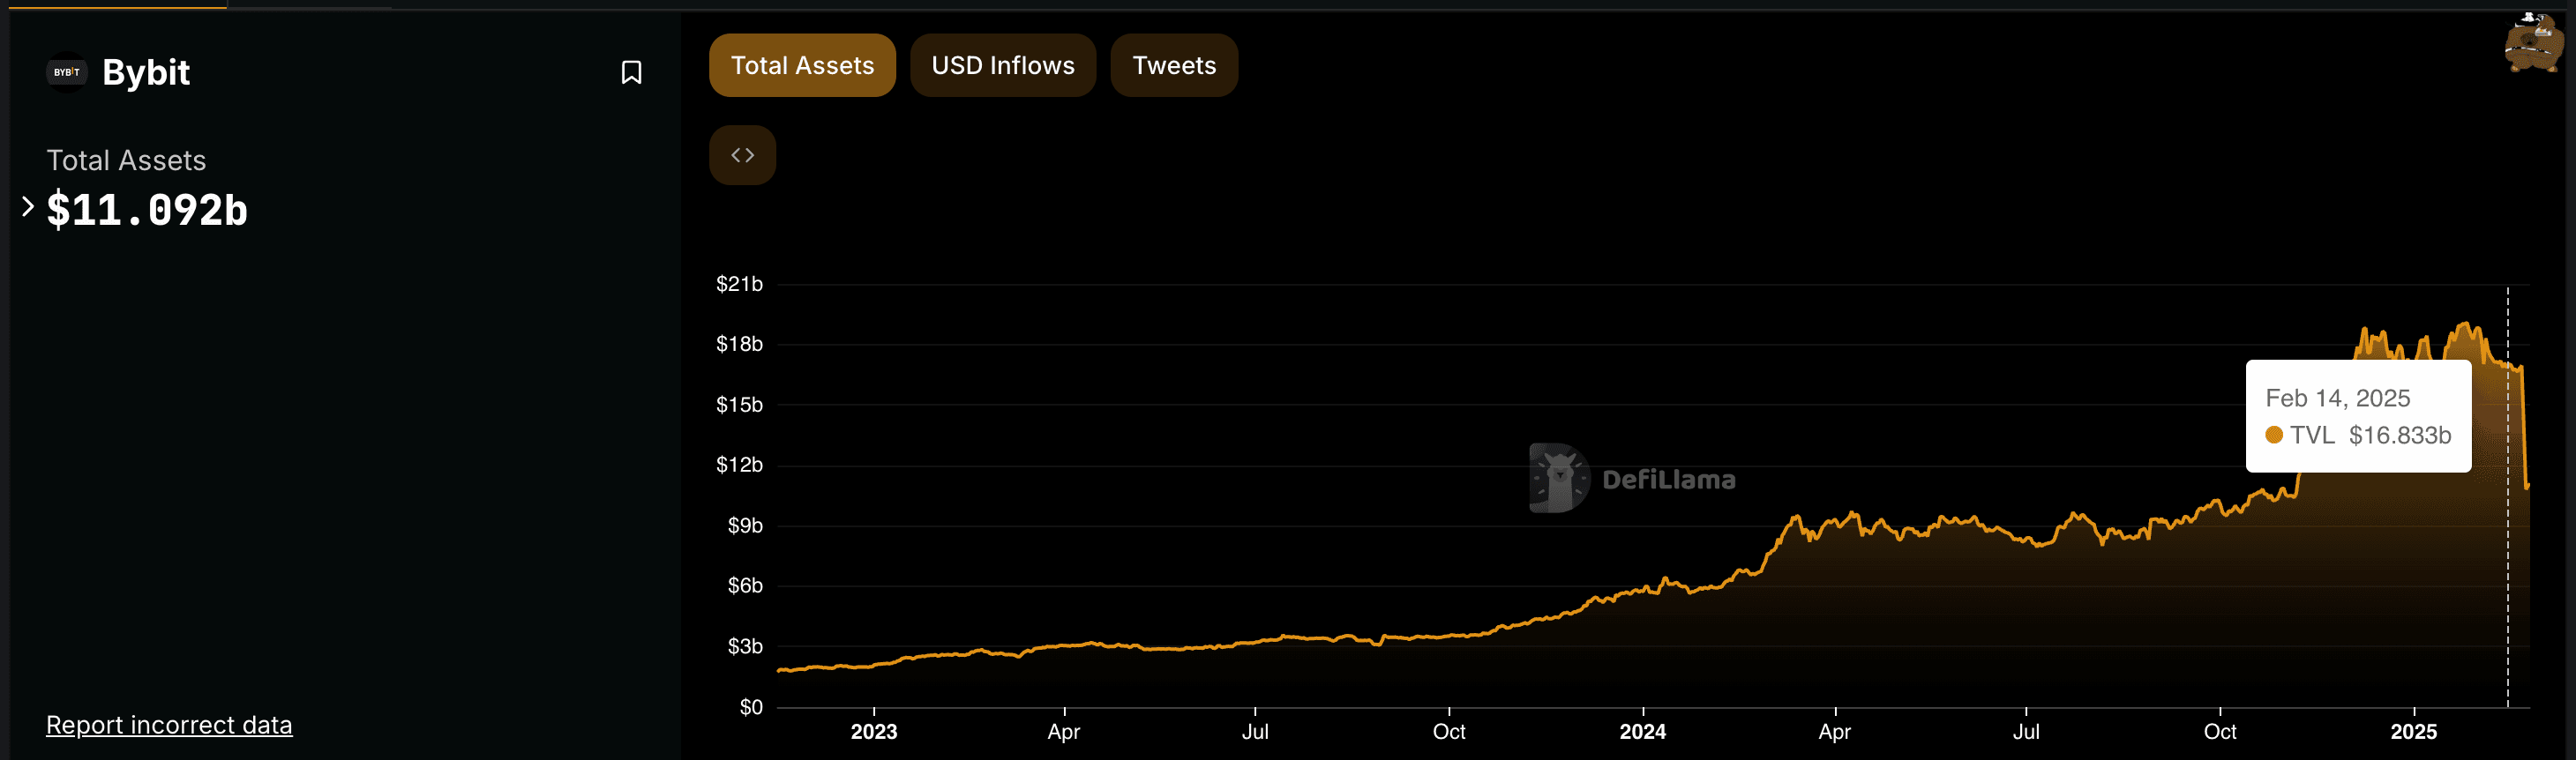
The news around the Bybit crypto exchange losing USD 1.46bn of funds to a hacker, delivered the second blow to market sentiment, though.
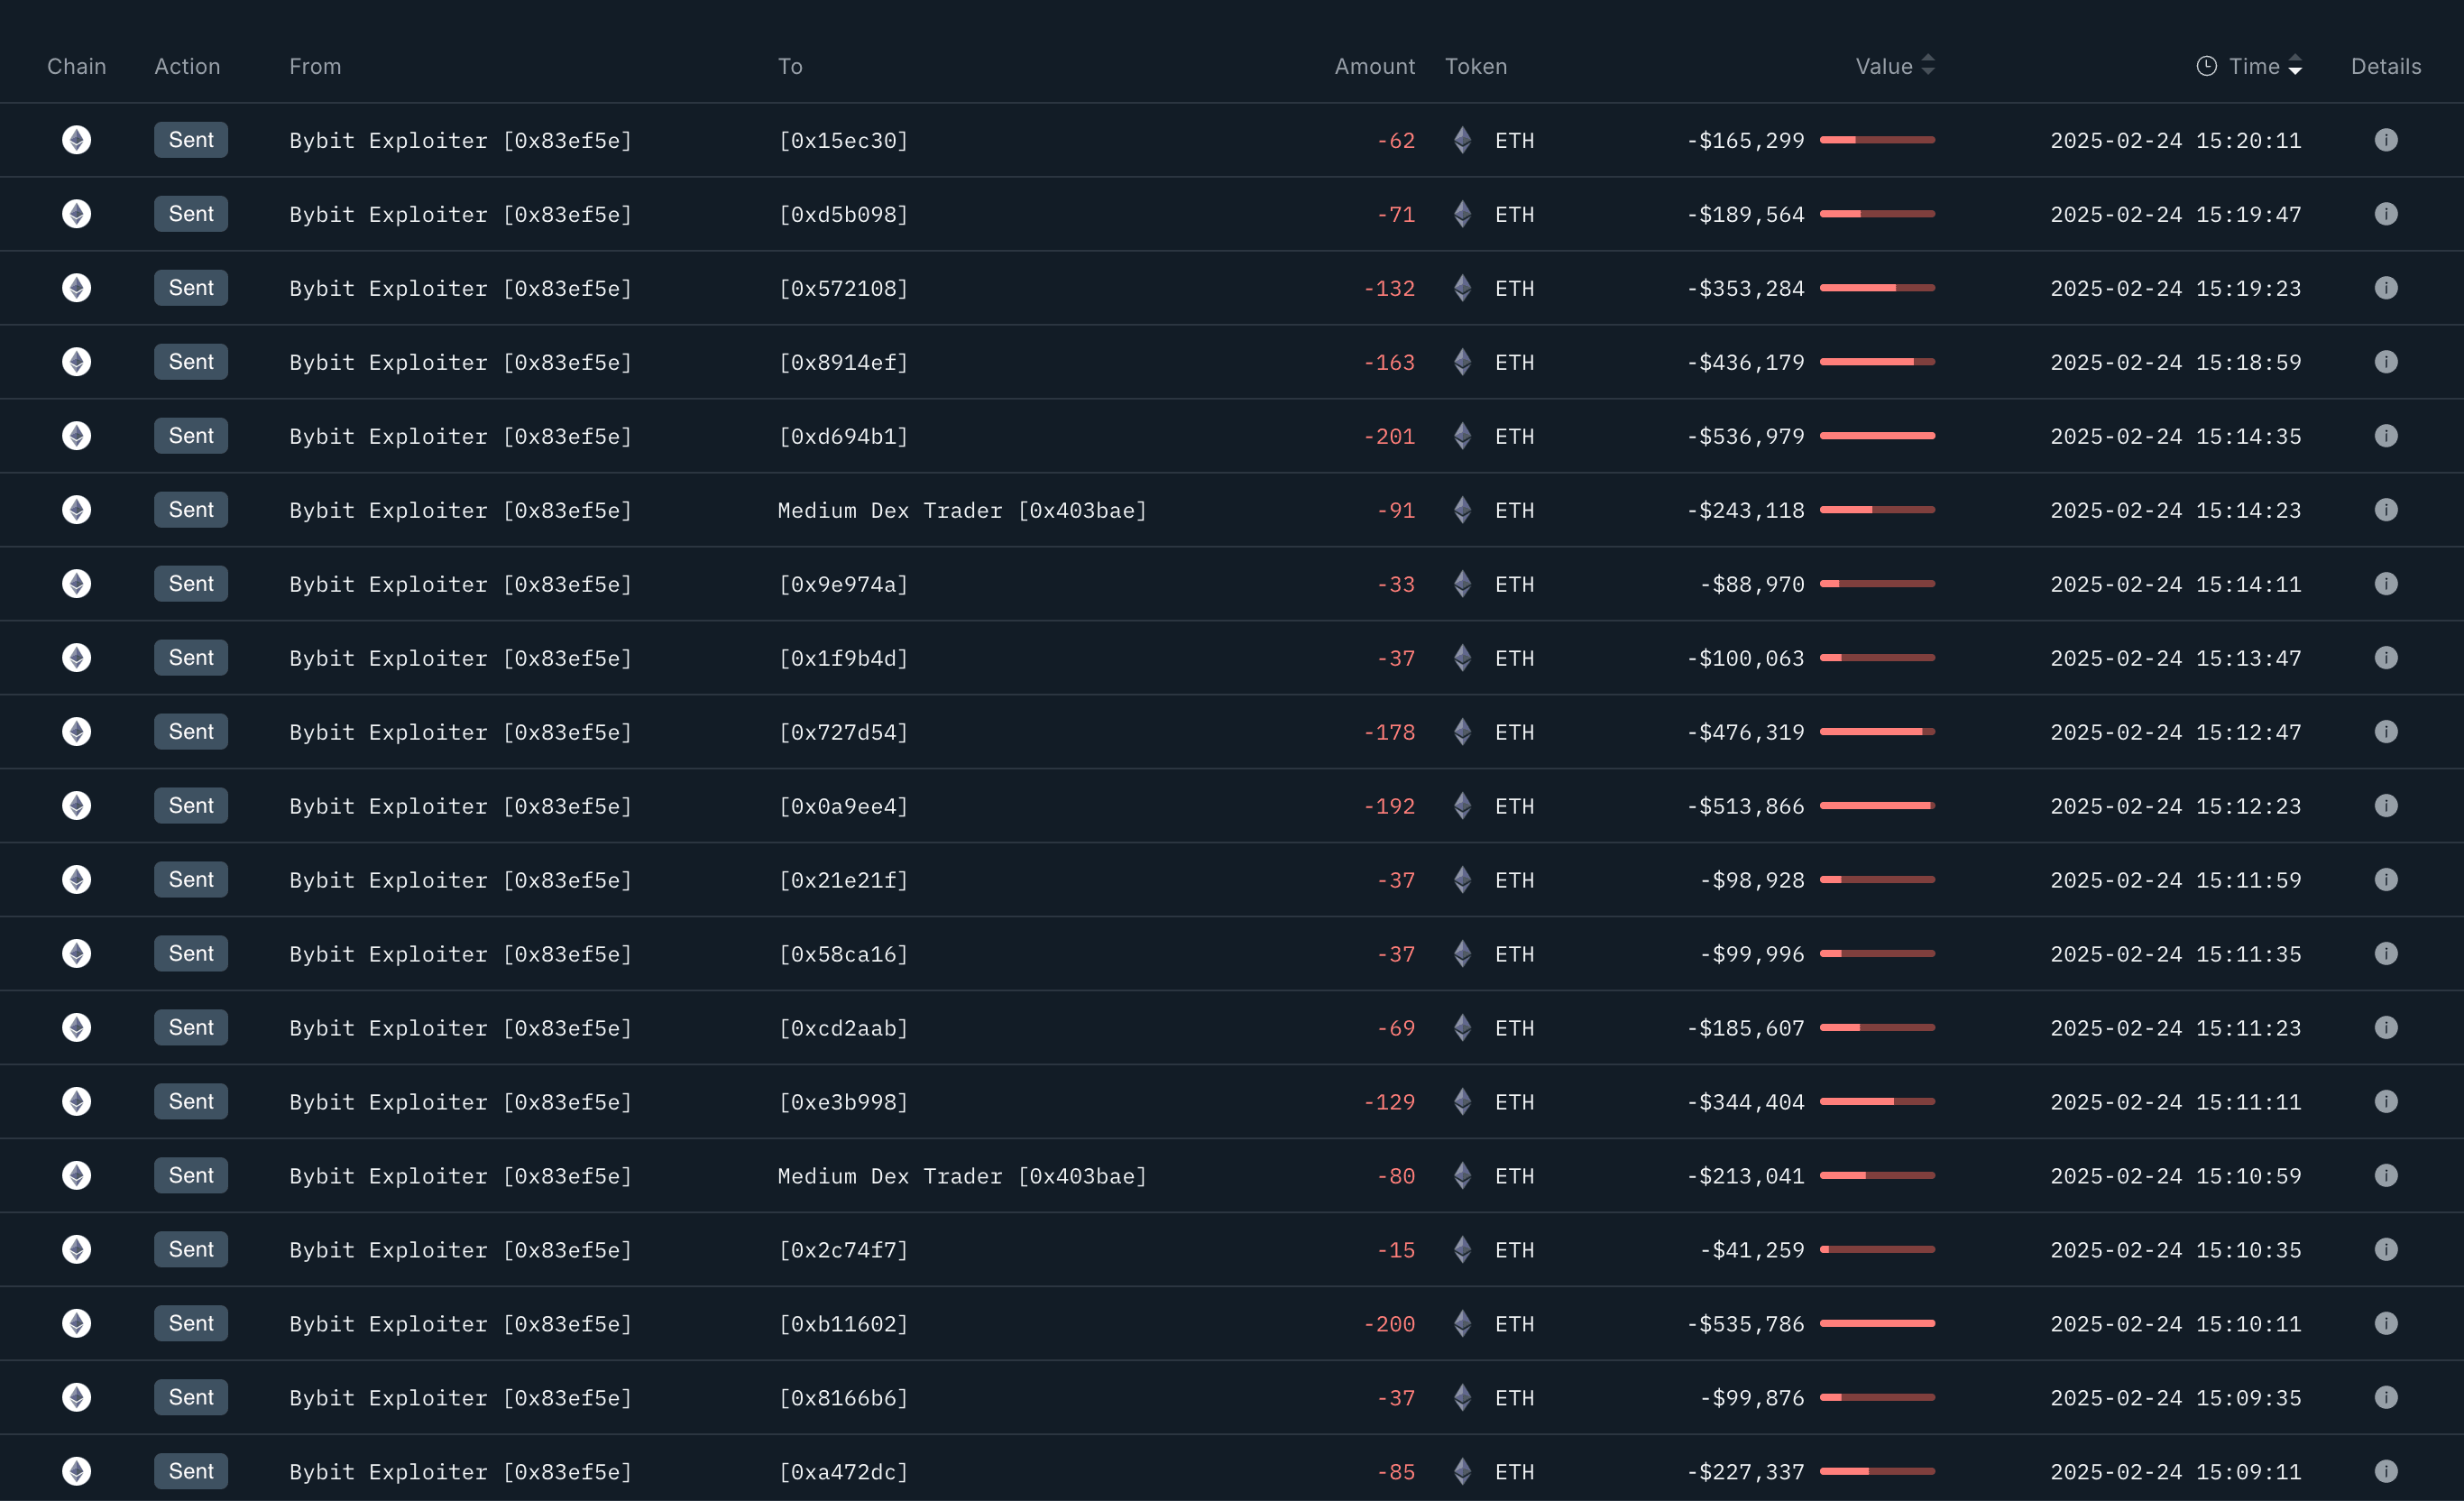
The deed, attributed to Lazarus Group, is unlikely to lead to a recovery of the stolen assets, but Bybit has ensured that client assets were safe. In that sense, it is a different set-up than the 2022 FTX episode. That said, after the riskiness of meme coin trading has been exposed, traders and investors have to reckon with the vulnerability of crypto-centralized exchanges (compliance and risk management processes), which appears sufficient to cool down risk appetite.
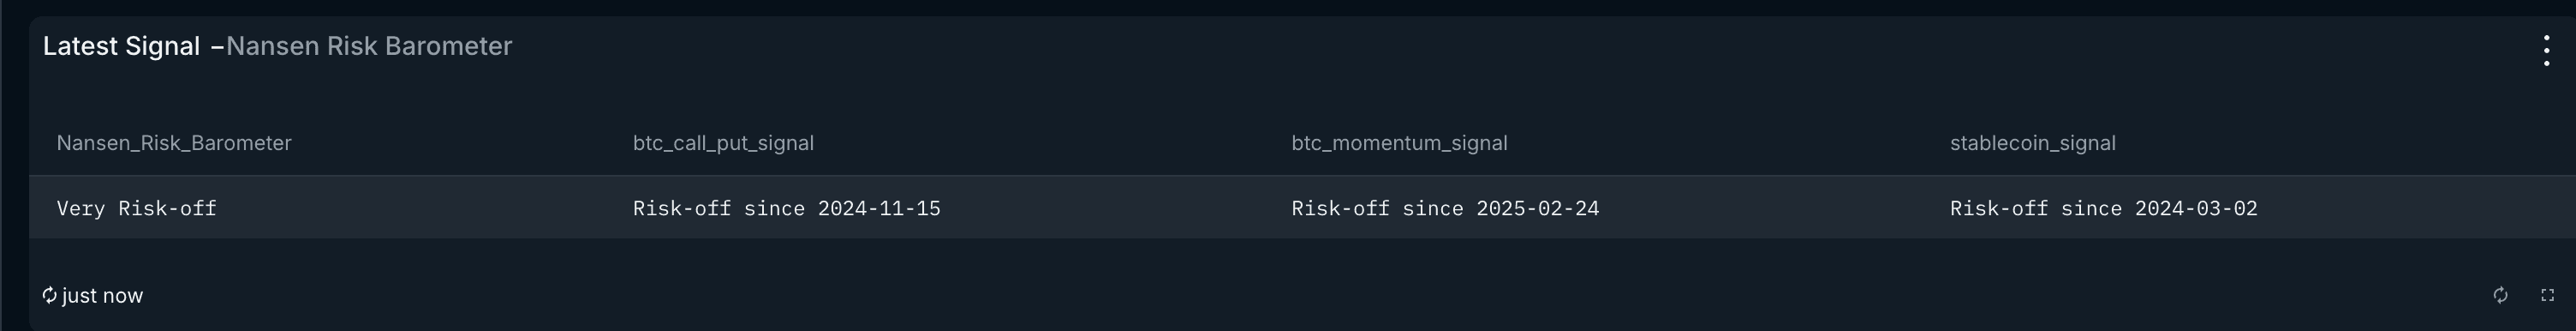
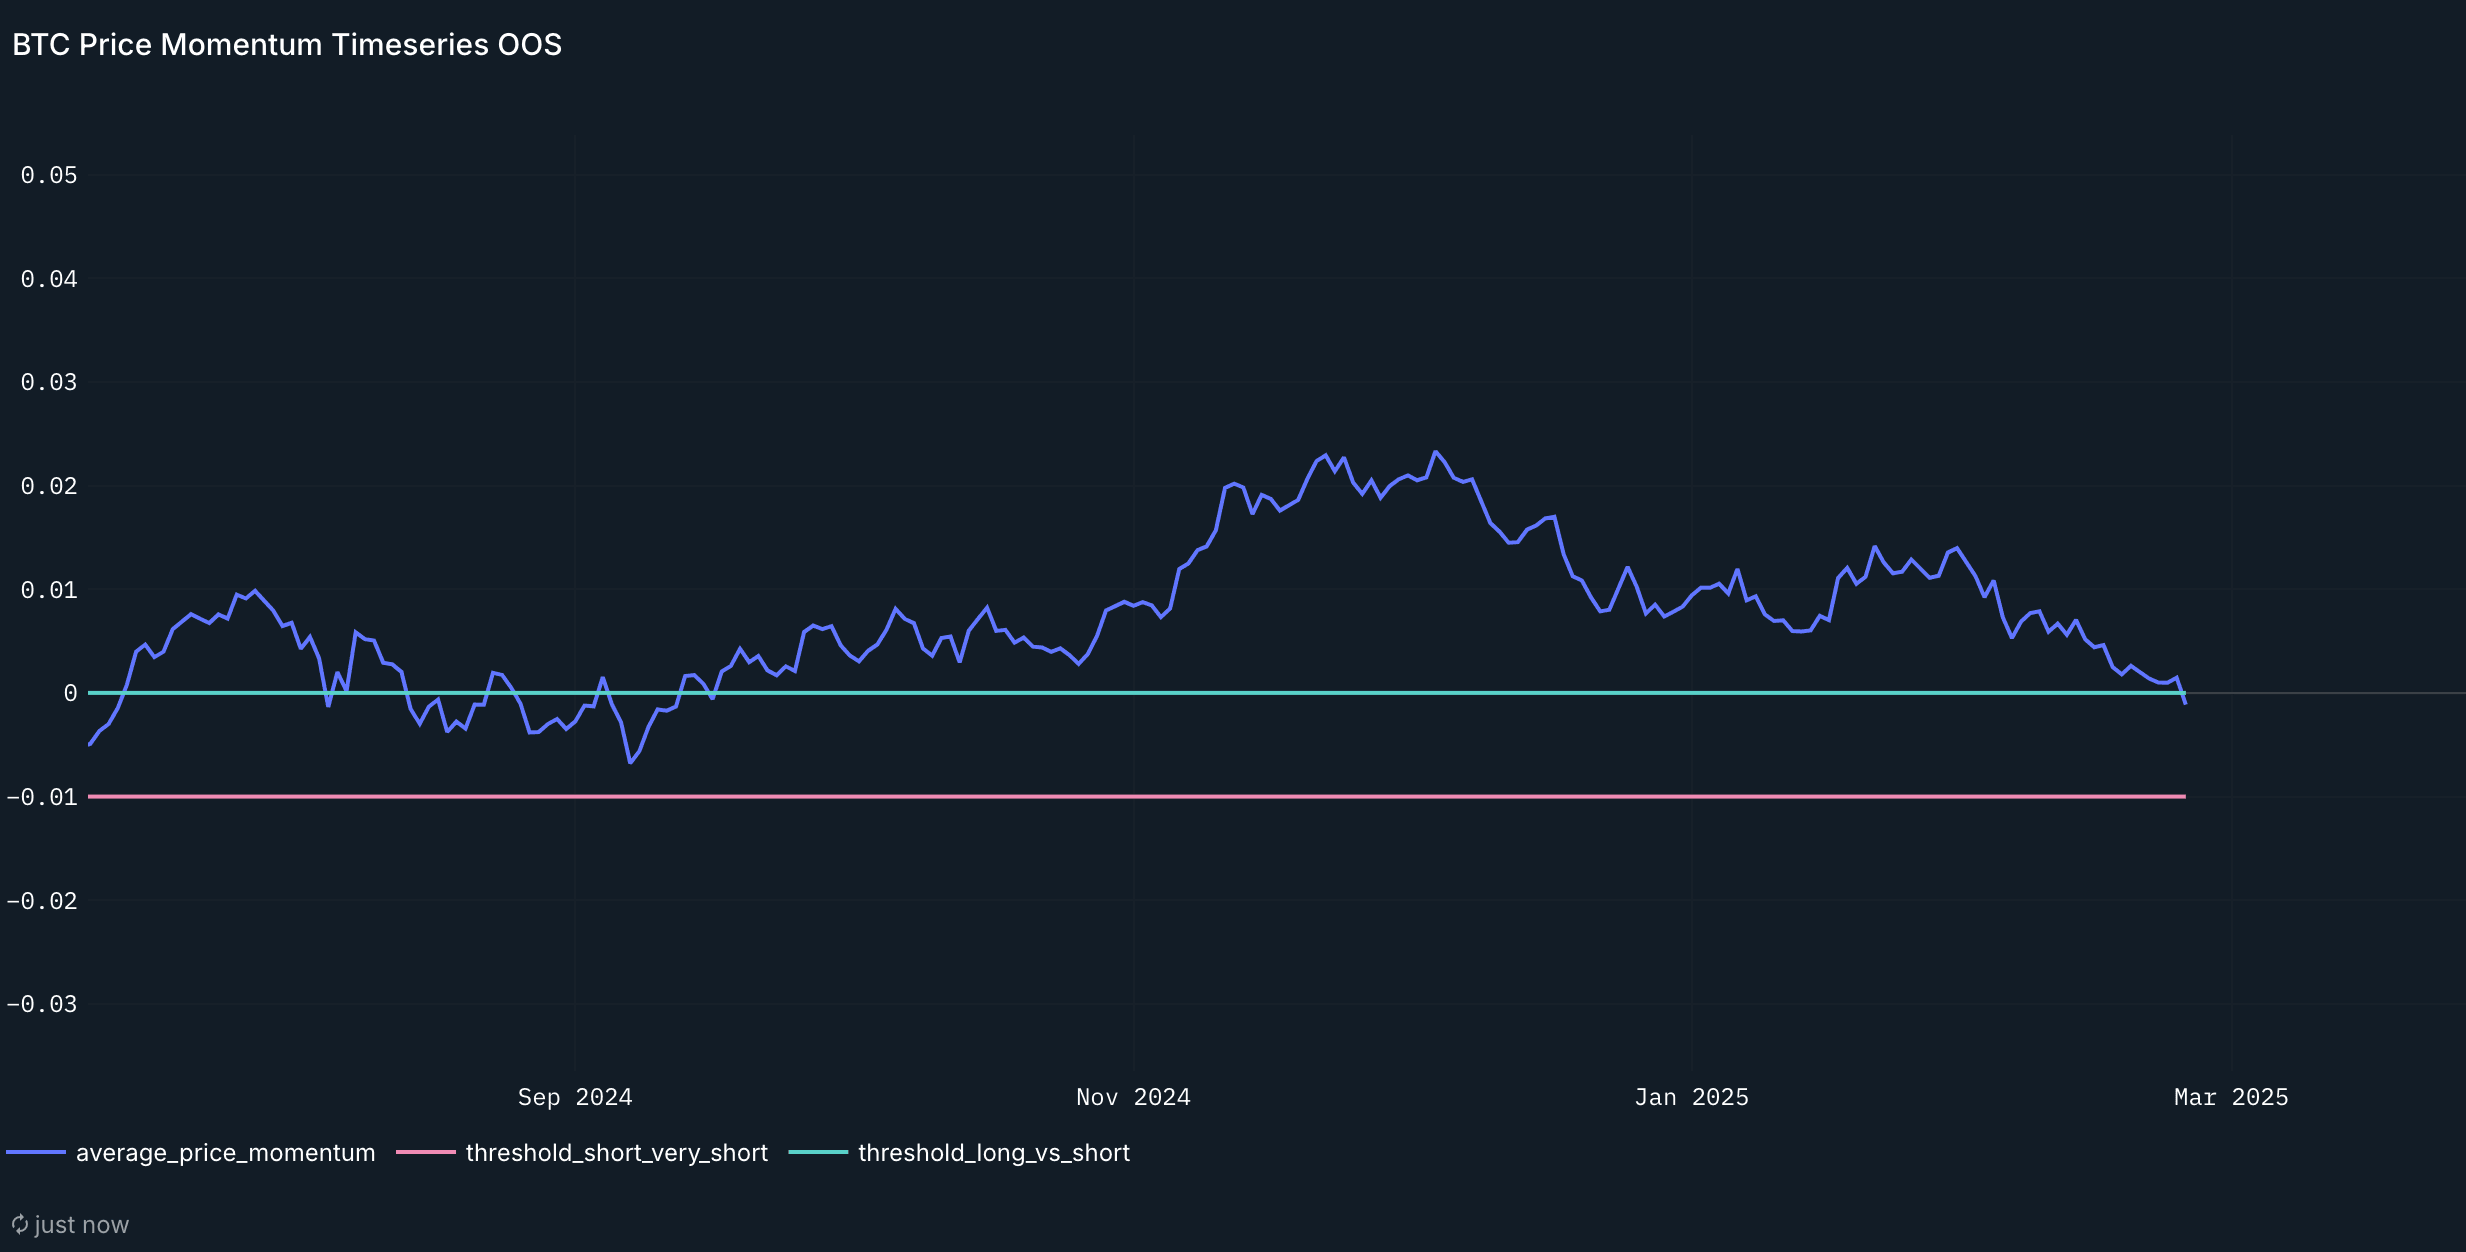
Our Nansen Risk Barometer just turned Risk-off from Neutral
Today, our Nansen Risk Barometer (see methodology here) just turned Risk-off from Neutral as the BTC price momentum converged to the Call-put spread signal. The signal had been in Neutral territory since mid-November 2024.
What to do at these levels?
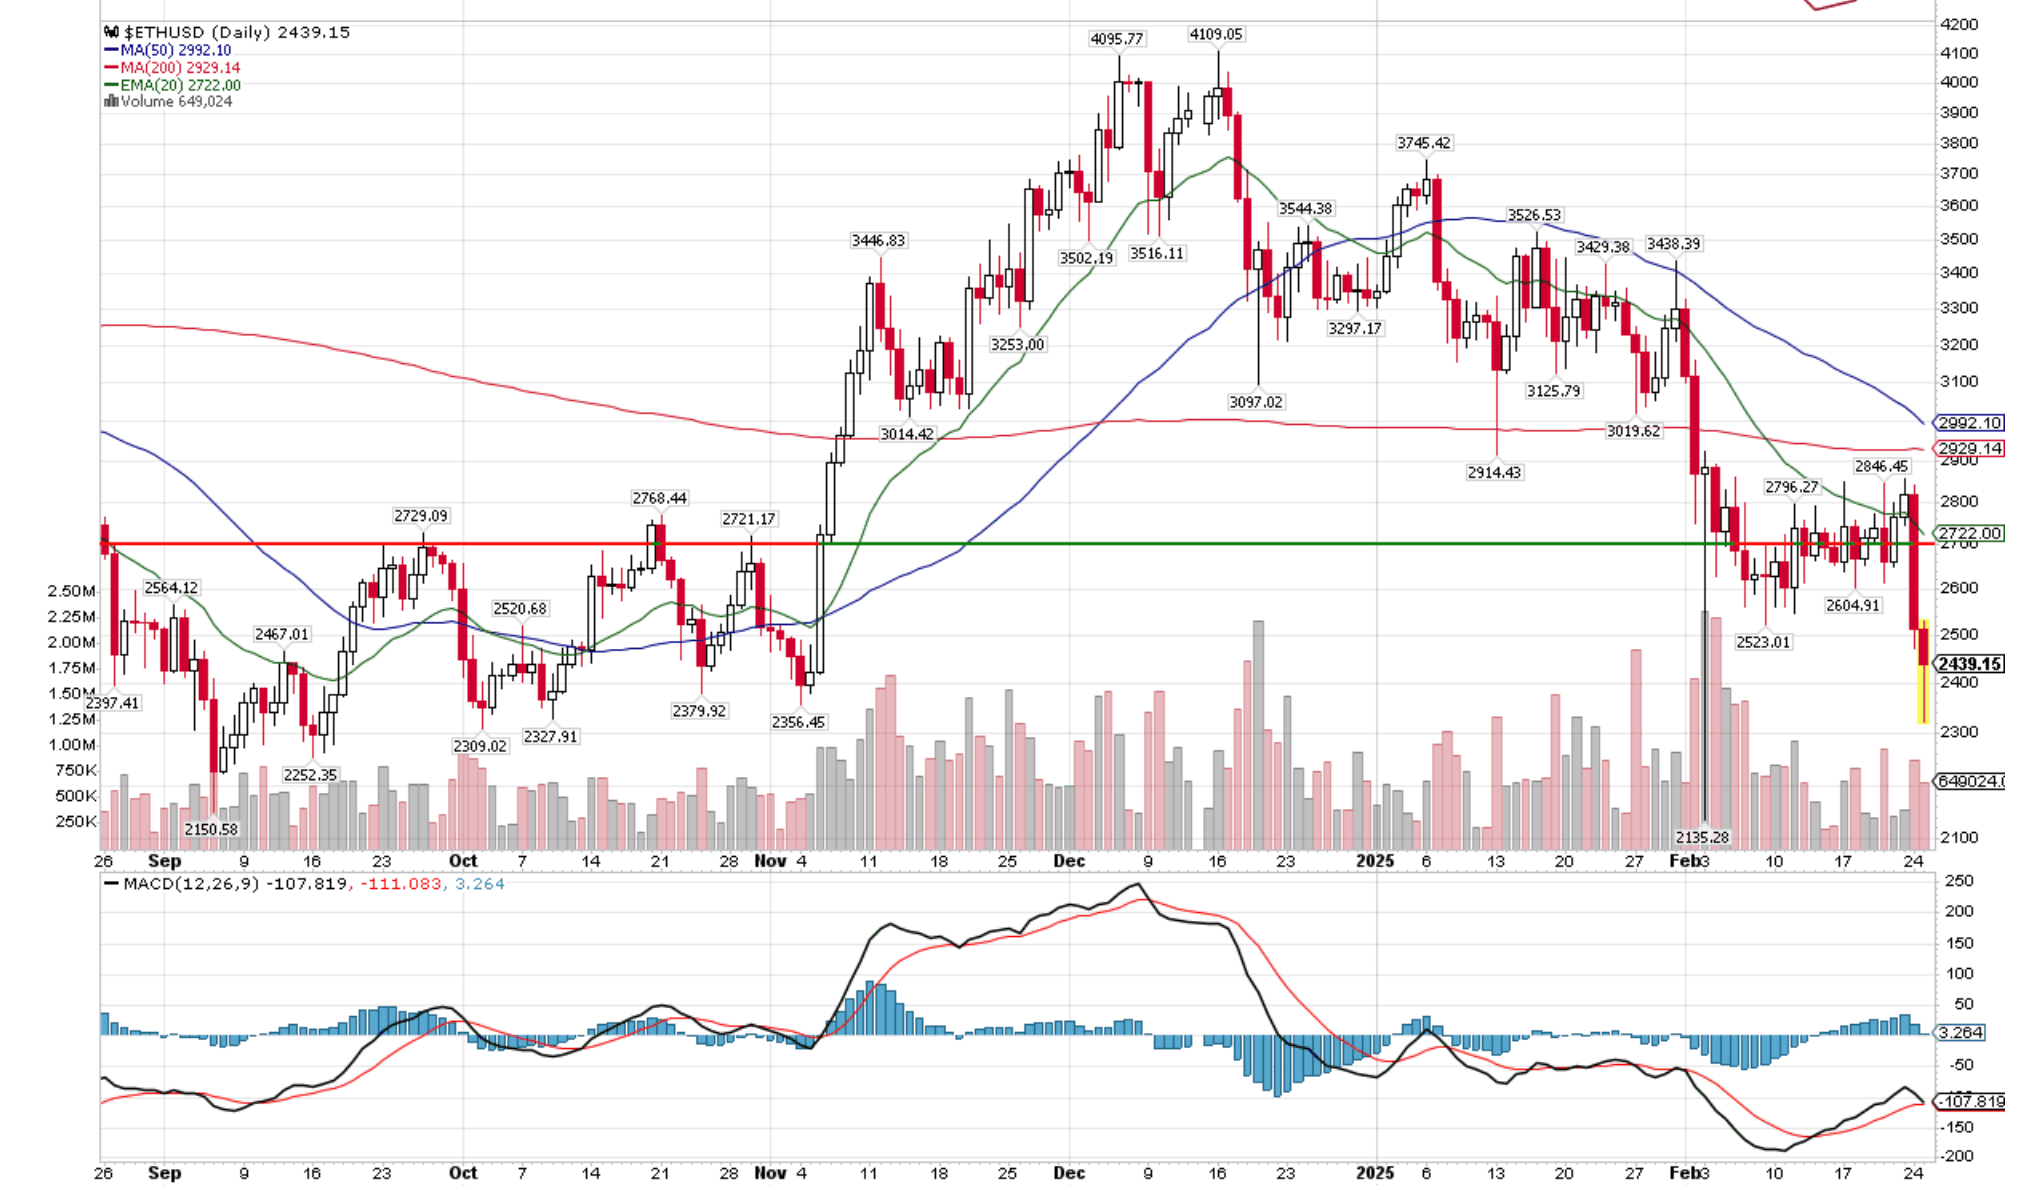
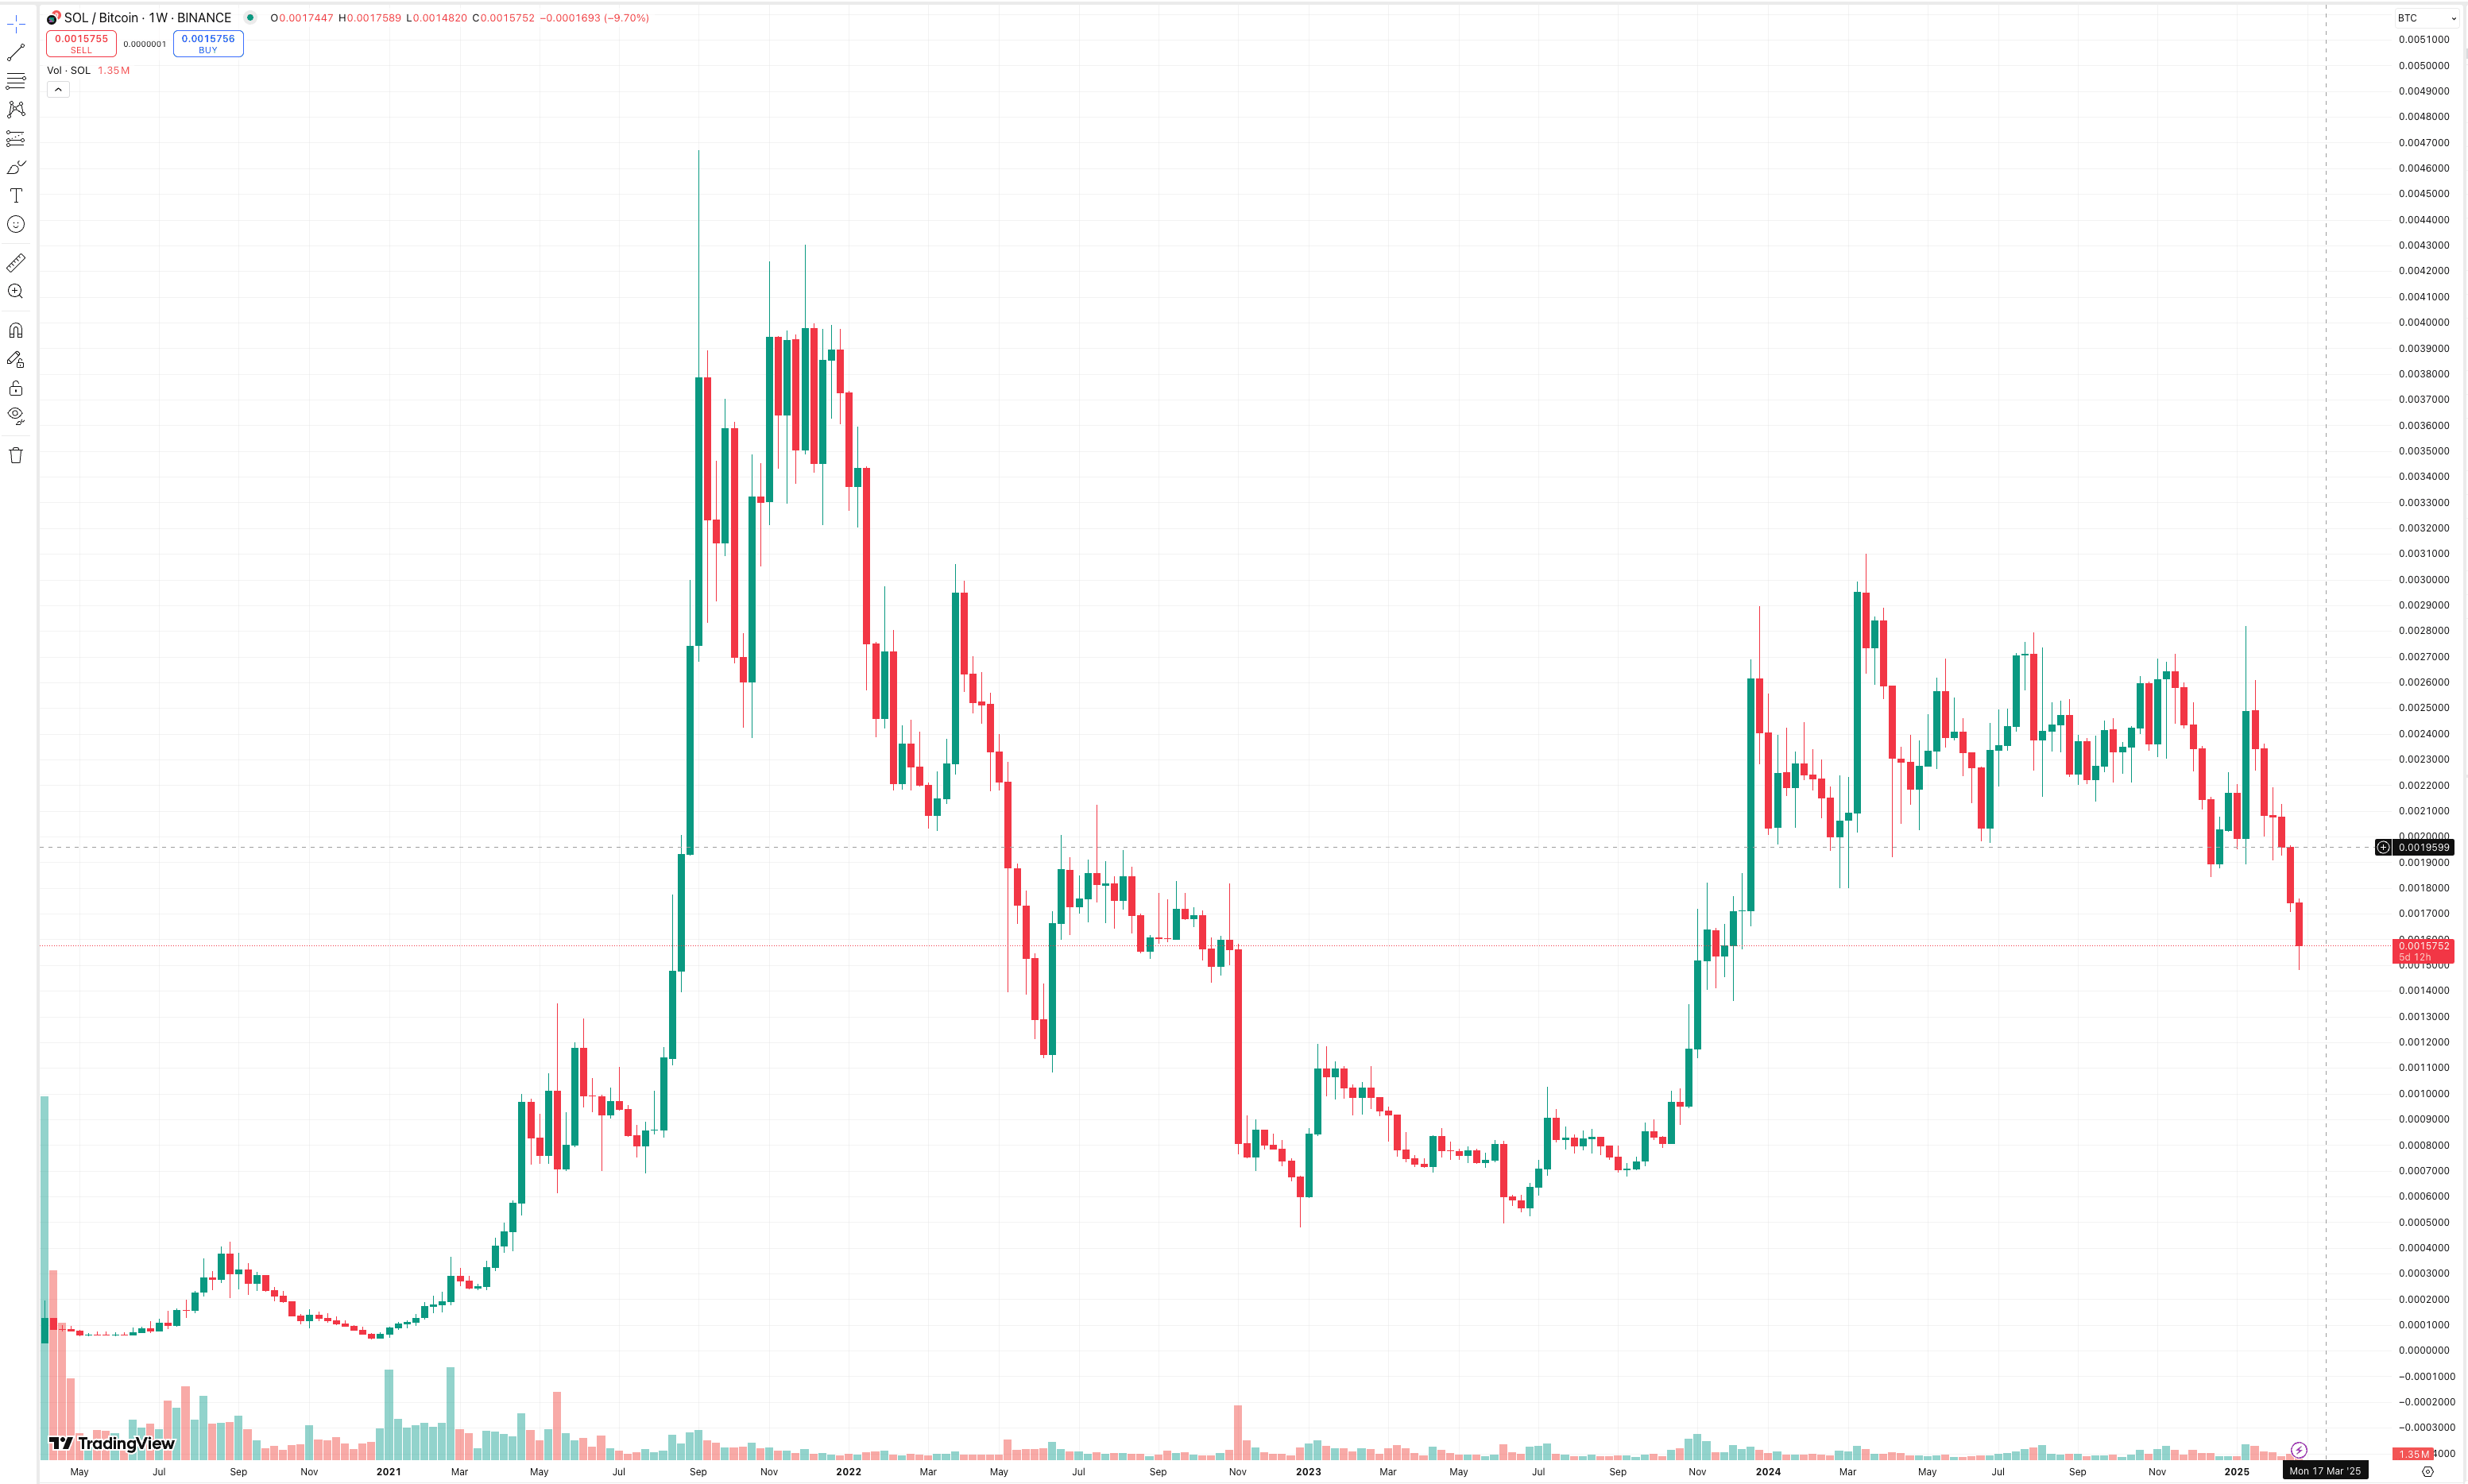
Although certain price levels appear attractive, given the sharpness of the downward moves in prices (see below ETH/USD breaking the 2.7k key level and SOL/BTC exiting its trading range held since last November), we choose to wait for a price consolidation and stabilization before adding to the tokens we like (XRP, BNB, BTC, COIN, SOL).
We will be monitoring:
- Our Nansen Risk Barometer’s signal
- Macro fundamentals e.g., clarity around US growth, tariff policy, and AI/ semi top-line